Zip Codes with the Highest Percentage of Households Without a Vehicle in South Charleston, WV
RELATED REPORTS & OPTIONS
Households without a Cars
South Charleston
Compare Zip Codes
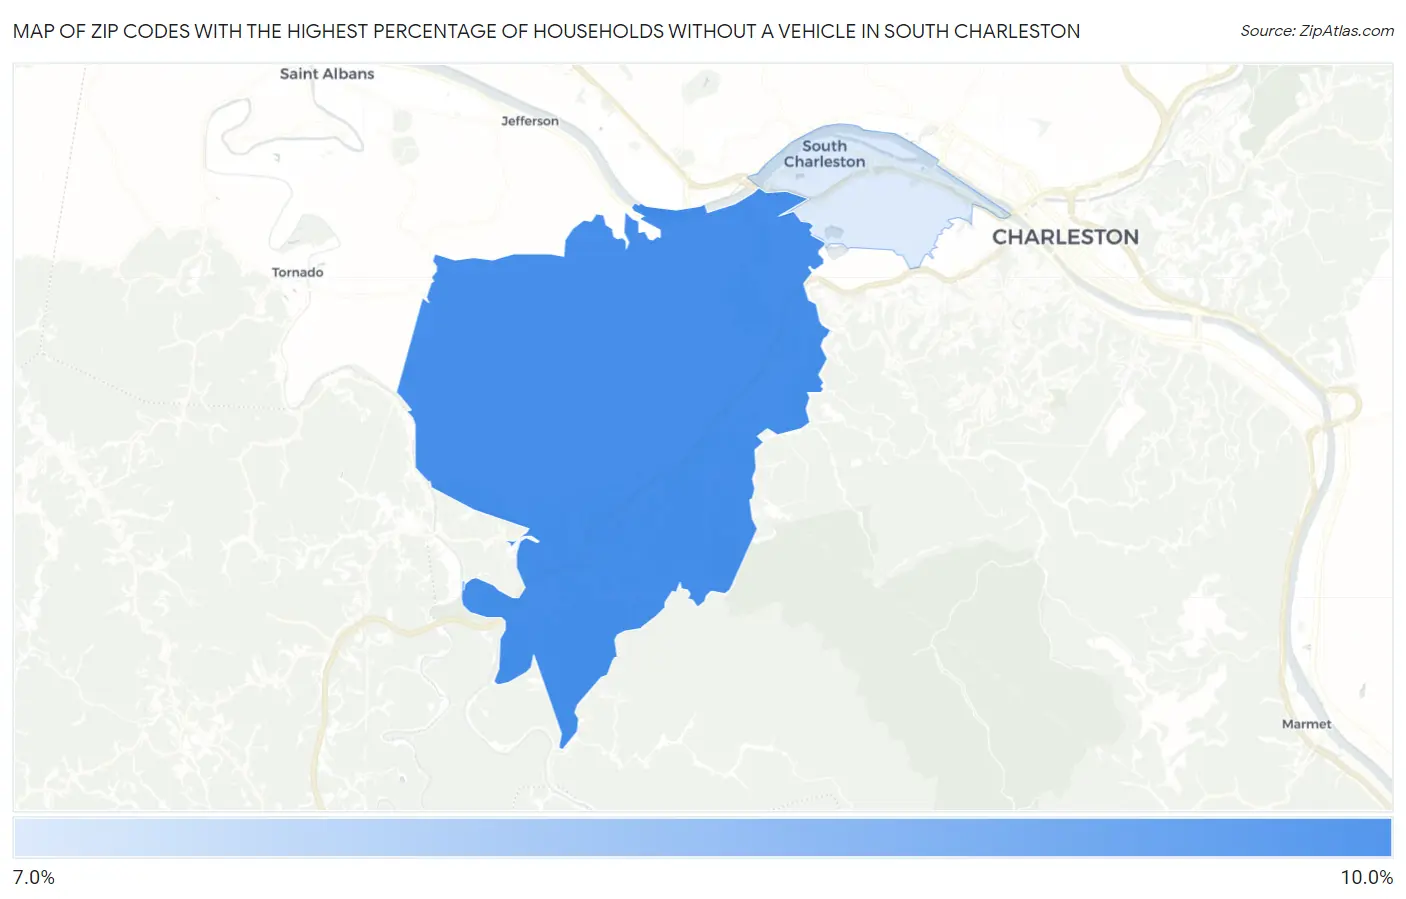
Map of Zip Codes with the Highest Percentage of Households Without a Vehicle in South Charleston
7.1%
9.1%
Zip Codes with the Highest Percentage of Households Without a Vehicle in South Charleston, WV
| Zip Code | Housholds Without a Car | vs State | vs National | |
| 1. | 25309 | 9.1% | 8.2%(+0.900)#209 | 8.3%(+0.800)#5,645 |
| 2. | 25303 | 7.1% | 8.2%(-1.10)#275 | 8.3%(-1.20)#8,438 |
1
Common Questions
What are the Top Zip Codes with the Highest Percentage of Households Without a Vehicle in South Charleston, WV?
Top Zip Codes with the Highest Percentage of Households Without a Vehicle in South Charleston, WV are:
What zip code has the Highest Percentage of Households Without a Vehicle in South Charleston, WV?
25309 has the Highest Percentage of Households Without a Vehicle in South Charleston, WV with 9.1%.
What is the Percentage of Households Without a Vehicle in South Charleston, WV?
Percentage of Households Without a Vehicle in South Charleston is 8.9%.
What is the Percentage of Households Without a Vehicle in West Virginia?
Percentage of Households Without a Vehicle in West Virginia is 8.2%.
What is the Percentage of Households Without a Vehicle in the United States?
Percentage of Households Without a Vehicle in the United States is 8.3%.