Zip Codes with the Highest Percentage of Population Employed in Office & Administration in Carrollton, GA
RELATED REPORTS & OPTIONS
Office & Administration
Carrollton
Compare Zip Codes
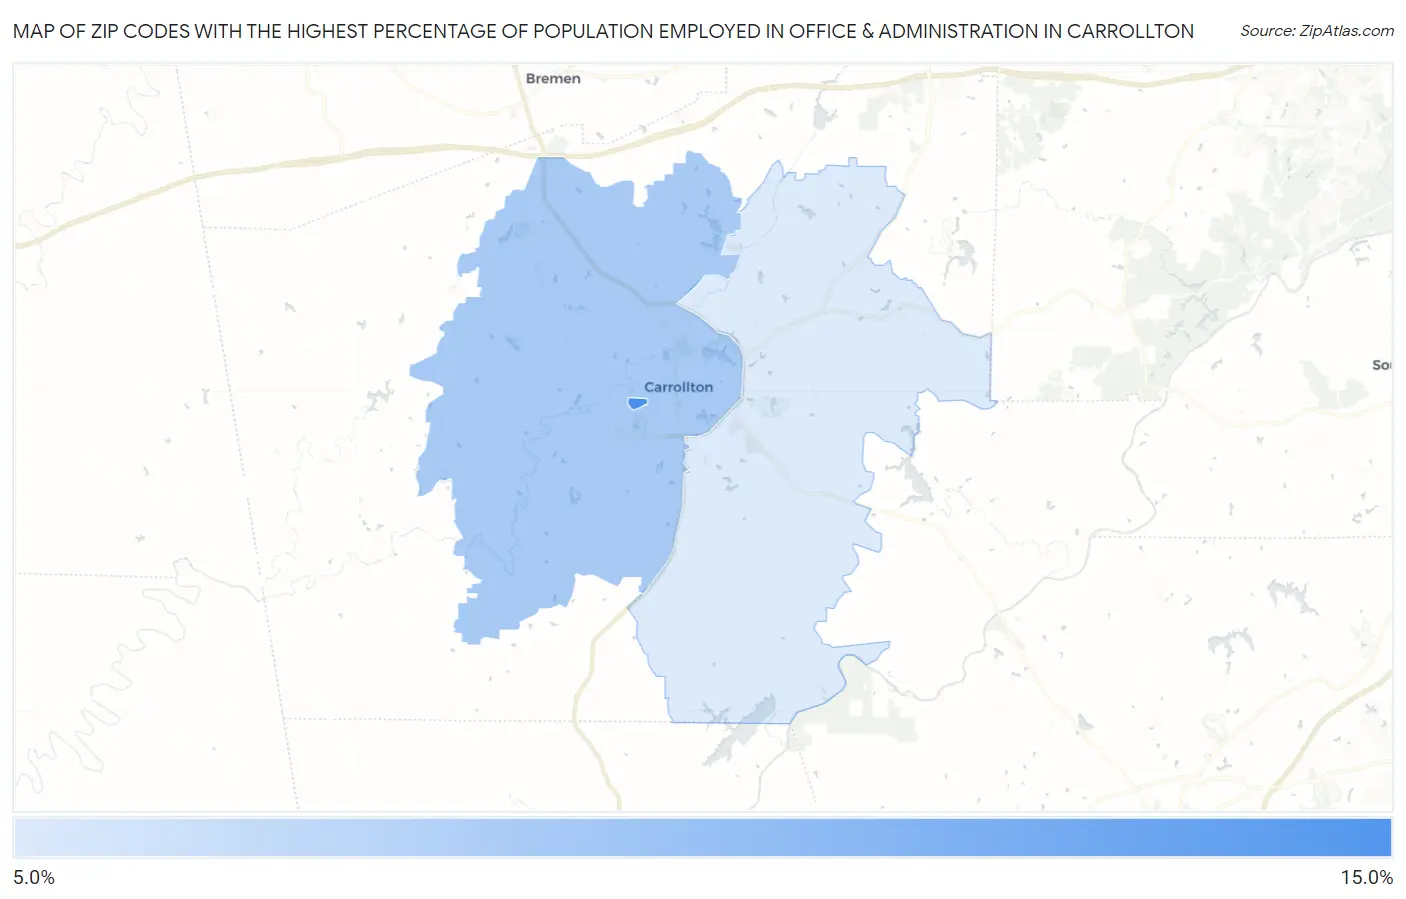
Map of Zip Codes with the Highest Percentage of Population Employed in Office & Administration in Carrollton
10.8%
13.3%
Zip Codes with the Highest Percentage of Population Employed in Office & Administration in Carrollton, GA
| Zip Code | % Employed | vs State | vs National | |
| 1. | 30118 | 13.3% | 11.1%(+2.20)#188 | 10.9%(+2.42)#7,423 |
| 2. | 30117 | 11.7% | 11.1%(+0.591)#296 | 10.9%(+0.814)#11,720 |
| 3. | 30116 | 10.8% | 11.1%(-0.268)#365 | 10.9%(-0.045)#14,469 |
1
Common Questions
What are the Top Zip Codes with the Highest Percentage of Population Employed in Office & Administration in Carrollton, GA?
Top Zip Codes with the Highest Percentage of Population Employed in Office & Administration in Carrollton, GA are:
What zip code has the Highest Percentage of Population Employed in Office & Administration in Carrollton, GA?
30118 has the Highest Percentage of Population Employed in Office & Administration in Carrollton, GA with 13.3%.
What is the Percentage of Population Employed in Office & Administration in Carrollton, GA?
Percentage of Population Employed in Office & Administration in Carrollton is 10.2%.
What is the Percentage of Population Employed in Office & Administration in Georgia?
Percentage of Population Employed in Office & Administration in Georgia is 11.1%.
What is the Percentage of Population Employed in Office & Administration in the United States?
Percentage of Population Employed in Office & Administration in the United States is 10.9%.