Hartland, VT Map & Demographics
Hartland Map
Hartland Overview
$29,203
PER CAPITA INCOME
$94,154
AVG FAMILY INCOME
$93,566
AVG HOUSEHOLD INCOME
0.30
INEQUALITY / GINI INDEX
625
TOTAL POPULATION
382
MALE POPULATION
243
FEMALE POPULATION
157.20
MALES / 100 FEMALES
63.61
FEMALES / 100 MALES
37.6
MEDIAN AGE
3.1
AVG FAMILY SIZE
3.0
AVG HOUSEHOLD SIZE
282
LABOR FORCE [ PEOPLE ]
57.9%
PERCENT IN LABOR FORCE
6.4%
UNEMPLOYMENT RATE
Hartland Zip Codes
Hartland Area Codes
Income in Hartland
Income Overview in Hartland
Per Capita Income in Hartland is $29,203, while median incomes of families and households are $94,154 and $93,566 respectively.
| Characteristic | Number | Measure |
| Per Capita Income | 625 | $29,203 |
| Median Family Income | 174 | $94,154 |
| Mean Family Income | 174 | $100,631 |
| Median Household Income | 206 | $93,566 |
| Mean Household Income | 206 | $85,158 |
| Income Deficit | 174 | $0 |
| Wage / Income Gap (%) | 625 | 0.00% |
| Wage / Income Gap ($) | 625 | 100.00¢ per $1 |
| Gini / Inequality Index | 625 | 0.30 |
Earnings by Sex in Hartland
| Sex | Number | Average Earnings |
| Male | 189 (68.7%) | $0 |
| Female | 86 (31.3%) | $0 |
| Total | 275 (100.0%) | $0 |
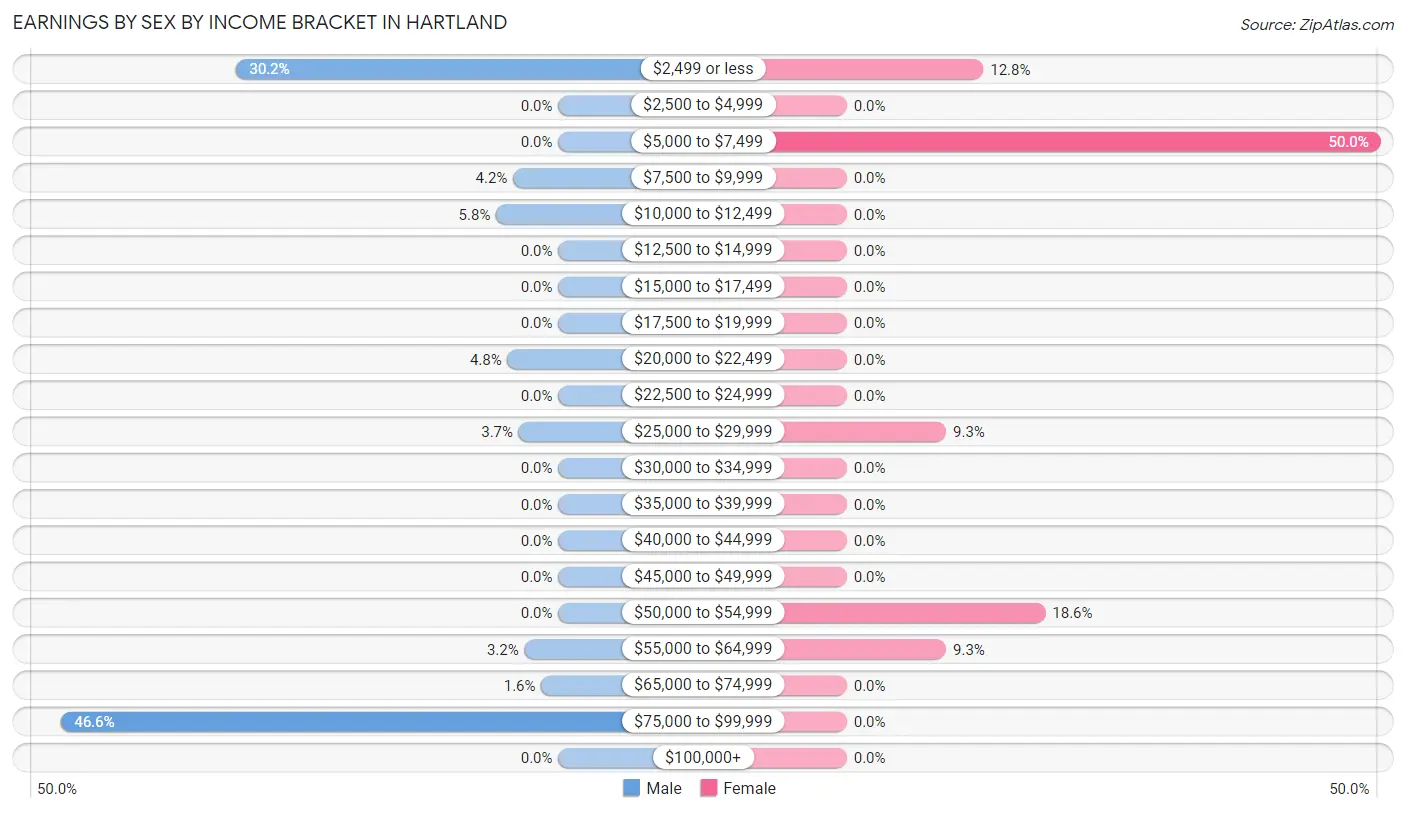
Earnings by Sex by Income Bracket in Hartland
The most common earnings brackets in Hartland are $75,000 to $99,999 for men (88 | 46.6%) and $5,000 to $7,499 for women (43 | 50.0%).
| Income | Male | Female |
| $2,499 or less | 57 (30.2%) | 11 (12.8%) |
| $2,500 to $4,999 | 0 (0.0%) | 0 (0.0%) |
| $5,000 to $7,499 | 0 (0.0%) | 43 (50.0%) |
| $7,500 to $9,999 | 8 (4.2%) | 0 (0.0%) |
| $10,000 to $12,499 | 11 (5.8%) | 0 (0.0%) |
| $12,500 to $14,999 | 0 (0.0%) | 0 (0.0%) |
| $15,000 to $17,499 | 0 (0.0%) | 0 (0.0%) |
| $17,500 to $19,999 | 0 (0.0%) | 0 (0.0%) |
| $20,000 to $22,499 | 9 (4.8%) | 0 (0.0%) |
| $22,500 to $24,999 | 0 (0.0%) | 0 (0.0%) |
| $25,000 to $29,999 | 7 (3.7%) | 8 (9.3%) |
| $30,000 to $34,999 | 0 (0.0%) | 0 (0.0%) |
| $35,000 to $39,999 | 0 (0.0%) | 0 (0.0%) |
| $40,000 to $44,999 | 0 (0.0%) | 0 (0.0%) |
| $45,000 to $49,999 | 0 (0.0%) | 0 (0.0%) |
| $50,000 to $54,999 | 0 (0.0%) | 16 (18.6%) |
| $55,000 to $64,999 | 6 (3.2%) | 8 (9.3%) |
| $65,000 to $74,999 | 3 (1.6%) | 0 (0.0%) |
| $75,000 to $99,999 | 88 (46.6%) | 0 (0.0%) |
| $100,000+ | 0 (0.0%) | 0 (0.0%) |
| Total | 189 (100.0%) | 86 (100.0%) |
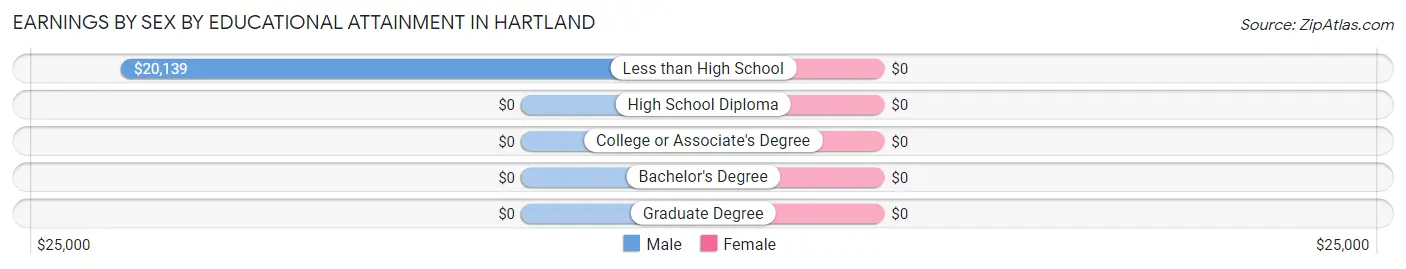
Earnings by Sex by Educational Attainment in Hartland
| Educational Attainment | Male Income | Female Income |
| Less than High School | $20,139 | $0 |
| High School Diploma | - | - |
| College or Associate's Degree | - | - |
| Bachelor's Degree | - | - |
| Graduate Degree | - | - |
| Total | - | - |
Family Income in Hartland
Family Income Brackets in Hartland
According to the Hartland family income data, there are 92 families falling into the $75,000 to $99,999 income range, which is the most common income bracket and makes up 52.9% of all families.
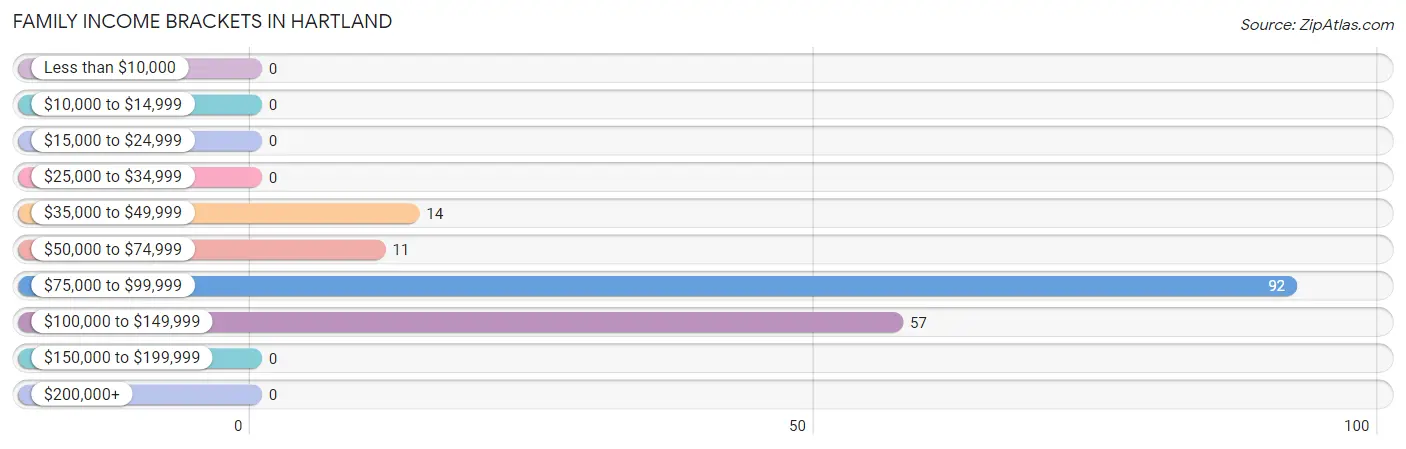
| Income Bracket | # Families | % Families |
| Less than $10,000 | 0 | 0.0% |
| $10,000 to $14,999 | 0 | 0.0% |
| $15,000 to $24,999 | 0 | 0.0% |
| $25,000 to $34,999 | 0 | 0.0% |
| $35,000 to $49,999 | 14 | 8.0% |
| $50,000 to $74,999 | 11 | 6.3% |
| $75,000 to $99,999 | 92 | 52.9% |
| $100,000 to $149,999 | 57 | 32.8% |
| $150,000 to $199,999 | 0 | 0.0% |
| $200,000+ | 0 | 0.0% |
Family Income by Famaliy Size in Hartland
2-person families (82 | 47.1%) account for the highest median family income in Hartland with $133,750 per family, while 2-person families (82 | 47.1%) have the highest median income of $66,875 per family member.
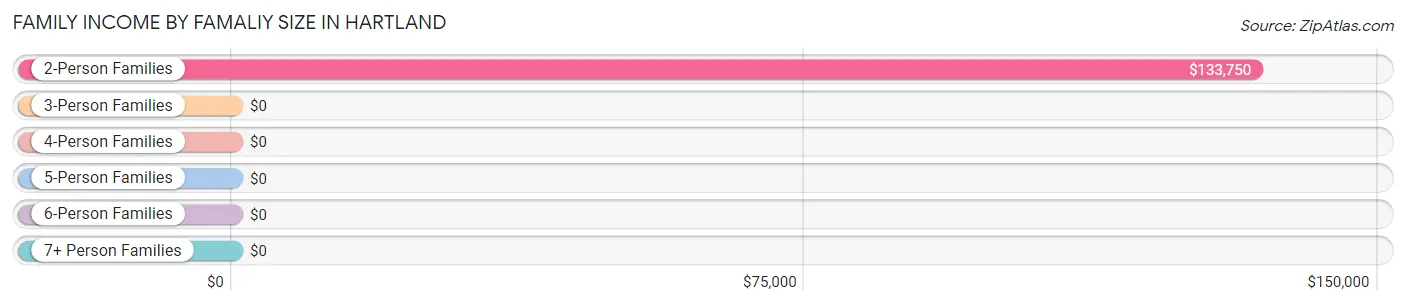
| Income Bracket | # Families | Median Income |
| 2-Person Families | 82 (47.1%) | $133,750 |
| 3-Person Families | 75 (43.1%) | $0 |
| 4-Person Families | 8 (4.6%) | $0 |
| 5-Person Families | 0 (0.0%) | $0 |
| 6-Person Families | 9 (5.2%) | $0 |
| 7+ Person Families | 0 (0.0%) | $0 |
| Total | 174 (100.0%) | $94,154 |
Family Income by Number of Earners in Hartland
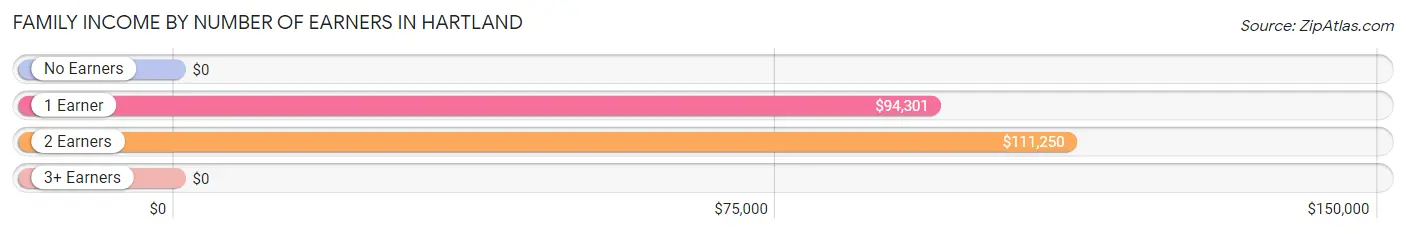
| Number of Earners | # Families | Median Income |
| No Earners | 14 (8.1%) | $0 |
| 1 Earner | 120 (69.0%) | $94,301 |
| 2 Earners | 32 (18.4%) | $111,250 |
| 3+ Earners | 8 (4.6%) | $0 |
| Total | 174 (100.0%) | $94,154 |
Household Income in Hartland
Household Income Brackets in Hartland
With 92 households falling in the category, the $75,000 to $99,999 income range is the most frequent in Hartland, accounting for 44.7% of all households.
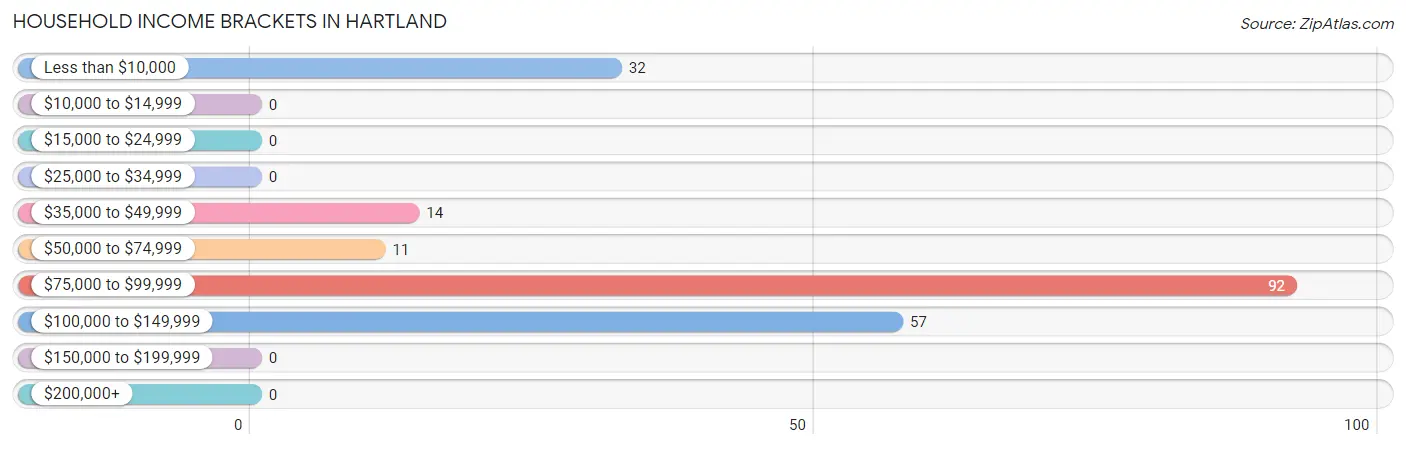
| Income Bracket | # Households | % Households |
| Less than $10,000 | 32 | 15.5% |
| $10,000 to $14,999 | 0 | 0.0% |
| $15,000 to $24,999 | 0 | 0.0% |
| $25,000 to $34,999 | 0 | 0.0% |
| $35,000 to $49,999 | 14 | 6.8% |
| $50,000 to $74,999 | 11 | 5.3% |
| $75,000 to $99,999 | 92 | 44.7% |
| $100,000 to $149,999 | 57 | 27.7% |
| $150,000 to $199,999 | 0 | 0.0% |
| $200,000+ | 0 | 0.0% |
Household Income by Householder Age in Hartland
The median household income in Hartland is $93,566, with the highest median household income of $122,578 found in the 45 to 64 years age bracket for the primary householder. A total of 31 households (15.0%) fall into this category.
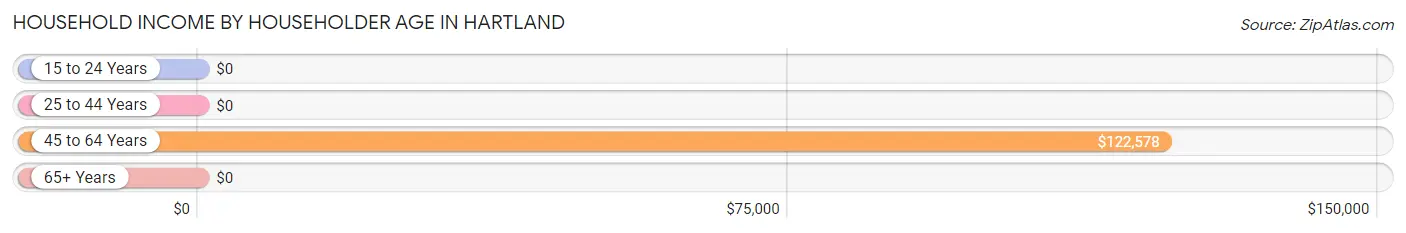
| Income Bracket | # Households | Median Income |
| 15 to 24 Years | 0 (0.0%) | $0 |
| 25 to 44 Years | 100 (48.5%) | $0 |
| 45 to 64 Years | 31 (15.0%) | $122,578 |
| 65+ Years | 75 (36.4%) | $0 |
| Total | 206 (100.0%) | $93,566 |
Poverty in Hartland
Income Below Poverty by Sex and Age in Hartland
With 14.9% poverty level for males and 13.2% for females among the residents of Hartland, 25 to 34 year old males and 25 to 34 year old females are the most vulnerable to poverty, with 57 males (100.0%) and 32 females (100.0%) in their respective age groups living below the poverty level.
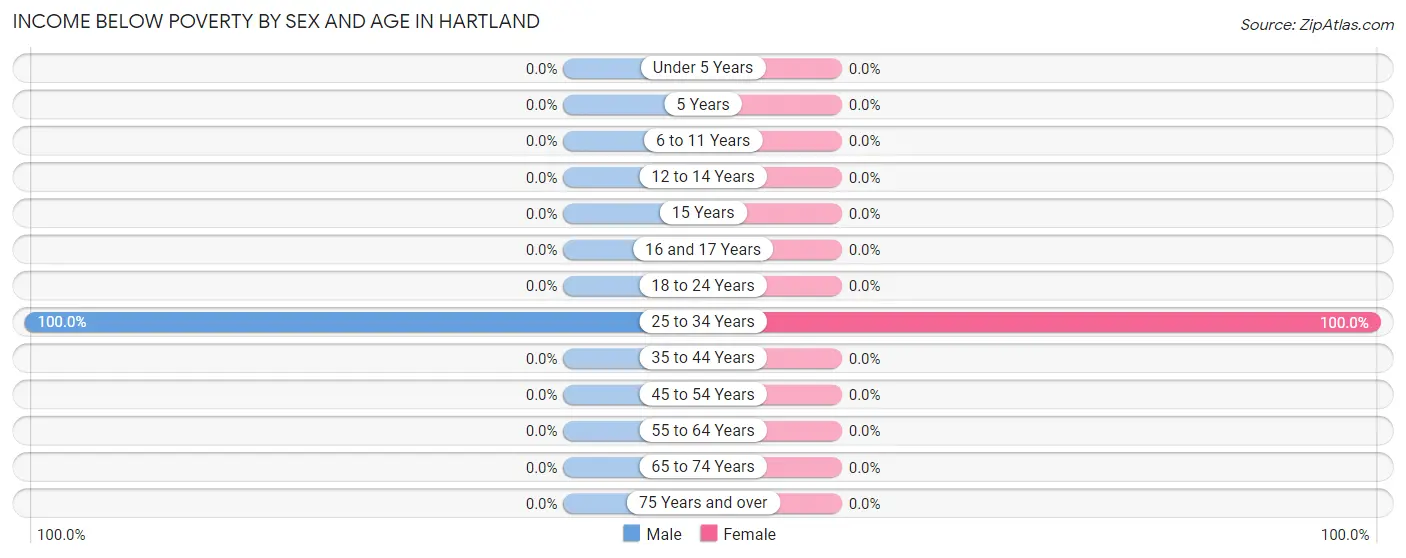
| Age Bracket | Male | Female |
| Under 5 Years | 0 (0.0%) | 0 (0.0%) |
| 5 Years | 0 (0.0%) | 0 (0.0%) |
| 6 to 11 Years | 0 (0.0%) | 0 (0.0%) |
| 12 to 14 Years | 0 (0.0%) | 0 (0.0%) |
| 15 Years | 0 (0.0%) | 0 (0.0%) |
| 16 and 17 Years | 0 (0.0%) | 0 (0.0%) |
| 18 to 24 Years | 0 (0.0%) | 0 (0.0%) |
| 25 to 34 Years | 57 (100.0%) | 32 (100.0%) |
| 35 to 44 Years | 0 (0.0%) | 0 (0.0%) |
| 45 to 54 Years | 0 (0.0%) | 0 (0.0%) |
| 55 to 64 Years | 0 (0.0%) | 0 (0.0%) |
| 65 to 74 Years | 0 (0.0%) | 0 (0.0%) |
| 75 Years and over | 0 (0.0%) | 0 (0.0%) |
| Total | 57 (14.9%) | 32 (13.2%) |
Income Above Poverty by Sex and Age in Hartland
According to the poverty statistics in Hartland, males aged 6 to 11 years and females aged 5 years are the age groups that are most secure financially, with 100.0% of males and 100.0% of females in these age groups living above the poverty line.
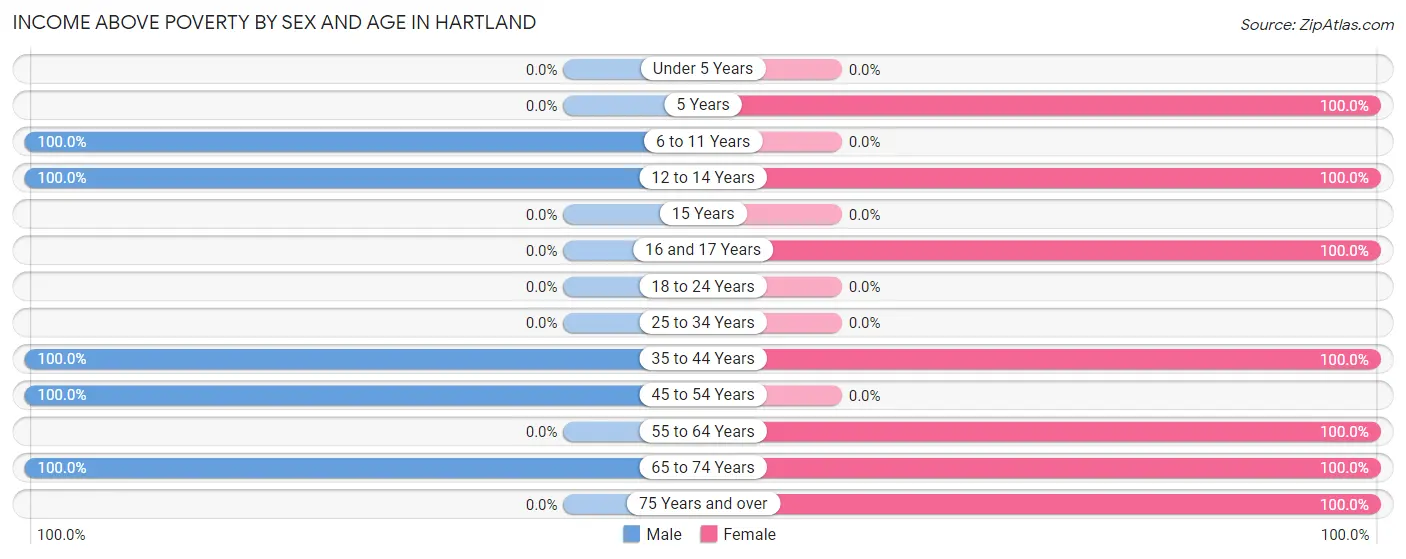
| Age Bracket | Male | Female |
| Under 5 Years | 0 (0.0%) | 0 (0.0%) |
| 5 Years | 0 (0.0%) | 7 (100.0%) |
| 6 to 11 Years | 108 (100.0%) | 0 (0.0%) |
| 12 to 14 Years | 12 (100.0%) | 11 (100.0%) |
| 15 Years | 0 (0.0%) | 0 (0.0%) |
| 16 and 17 Years | 0 (0.0%) | 11 (100.0%) |
| 18 to 24 Years | 0 (0.0%) | 0 (0.0%) |
| 25 to 34 Years | 0 (0.0%) | 0 (0.0%) |
| 35 to 44 Years | 106 (100.0%) | 68 (100.0%) |
| 45 to 54 Years | 18 (100.0%) | 0 (0.0%) |
| 55 to 64 Years | 0 (0.0%) | 32 (100.0%) |
| 65 to 74 Years | 81 (100.0%) | 68 (100.0%) |
| 75 Years and over | 0 (0.0%) | 14 (100.0%) |
| Total | 325 (85.1%) | 211 (86.8%) |
Income Below Poverty Among Married-Couple Families in Hartland
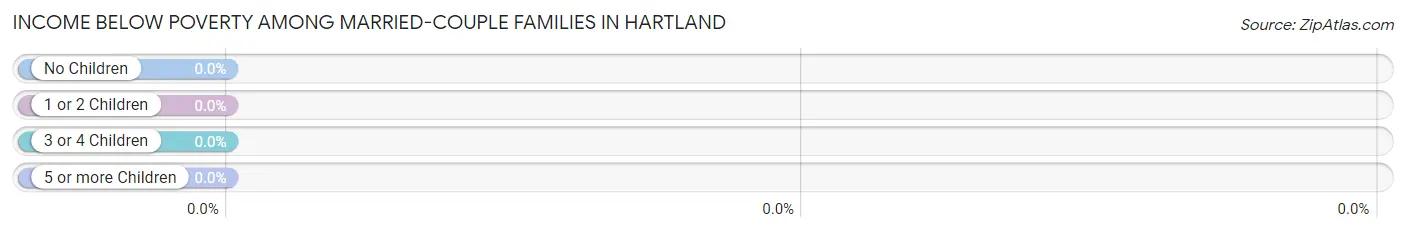
| Children | Above Poverty | Below Poverty |
| No Children | 82 (100.0%) | 0 (0.0%) |
| 1 or 2 Children | 85 (100.0%) | 0 (0.0%) |
| 3 or 4 Children | 0 (0.0%) | 0 (0.0%) |
| 5 or more Children | 0 (0.0%) | 0 (0.0%) |
| Total | 167 (100.0%) | 0 (0.0%) |
Income Below Poverty Among Single-Parent Households in Hartland
| Children | Single Father | Single Mother |
| No Children | 0 (0.0%) | 0 (0.0%) |
| 1 or 2 Children | 0 (0.0%) | 0 (0.0%) |
| 3 or 4 Children | 0 (0.0%) | 0 (0.0%) |
| 5 or more Children | 0 (0.0%) | 0 (0.0%) |
| Total | 0 (0.0%) | 0 (0.0%) |
Income Below Poverty Among Married-Couple vs Single-Parent Households in Hartland
| Children | Married-Couple Families | Single-Parent Households |
| No Children | 0 (0.0%) | 0 (0.0%) |
| 1 or 2 Children | 0 (0.0%) | 0 (0.0%) |
| 3 or 4 Children | 0 (0.0%) | 0 (0.0%) |
| 5 or more Children | 0 (0.0%) | 0 (0.0%) |
| Total | 0 (0.0%) | 0 (0.0%) |
Race in Hartland
The most populous races in Hartland are White / Caucasian (591 | 94.6%), Two or more Races (23 | 3.7%), and Asian (8 | 1.3%).
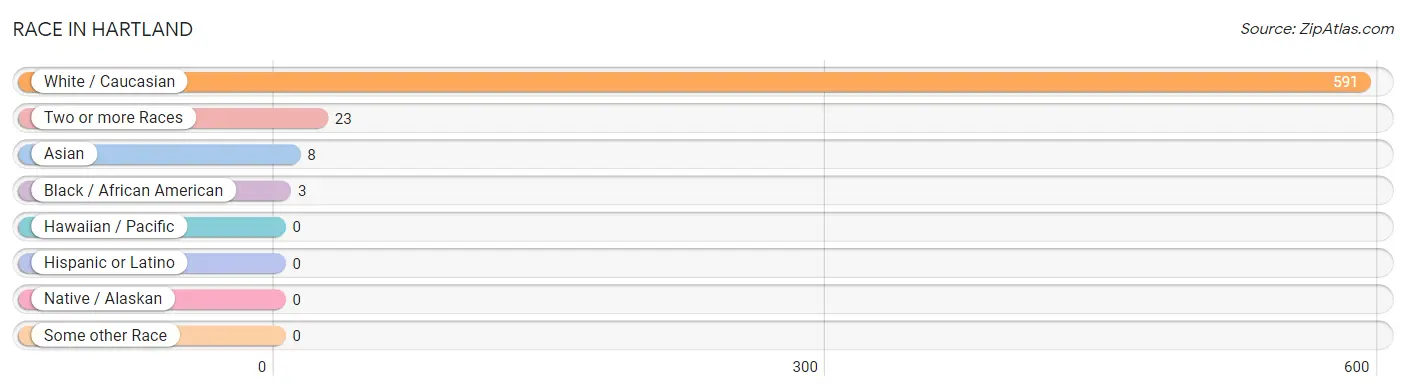
| Race | # Population | % Population |
| Asian | 8 | 1.3% |
| Black / African American | 3 | 0.5% |
| Hawaiian / Pacific | 0 | 0.0% |
| Hispanic or Latino | 0 | 0.0% |
| Native / Alaskan | 0 | 0.0% |
| White / Caucasian | 591 | 94.6% |
| Two or more Races | 23 | 3.7% |
| Some other Race | 0 | 0.0% |
| Total | 625 | 100.0% |
Ancestry in Hartland
The most populous ancestries reported in Hartland are Irish (66 | 10.6%), French (46 | 7.4%), Welsh (43 | 6.9%), German (41 | 6.6%), and Austrian (31 | 5.0%), together accounting for 36.3% of all Hartland residents.
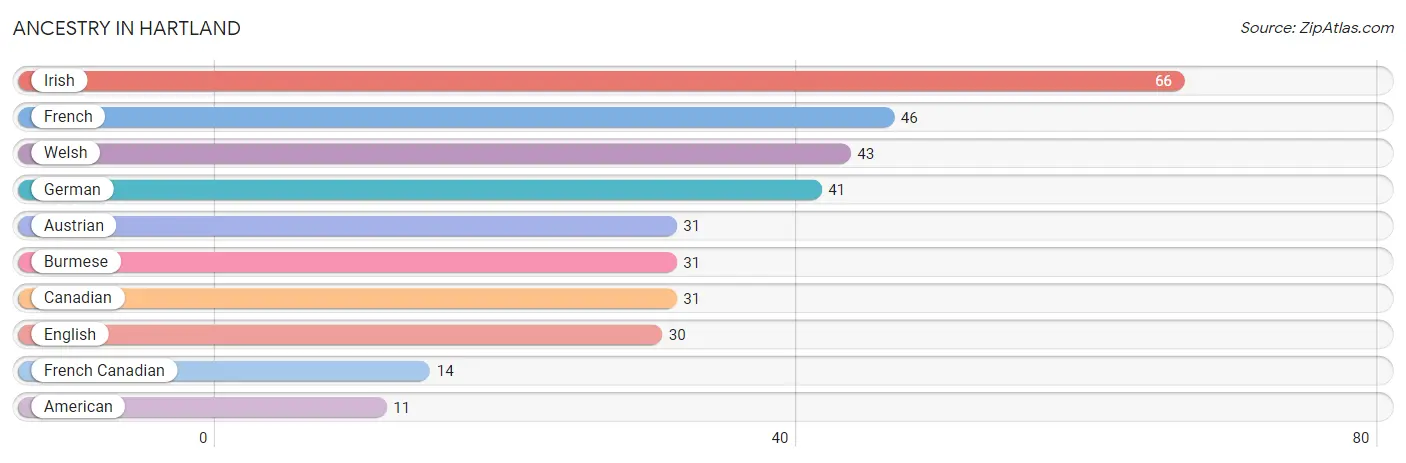
| Ancestry | # Population | % Population |
| American | 11 | 1.8% |
| Austrian | 31 | 5.0% |
| Burmese | 31 | 5.0% |
| Canadian | 31 | 5.0% |
| English | 30 | 4.8% |
| French | 46 | 7.4% |
| French Canadian | 14 | 2.2% |
| German | 41 | 6.6% |
| Irish | 66 | 10.6% |
| Welsh | 43 | 6.9% | View All 10 Rows |
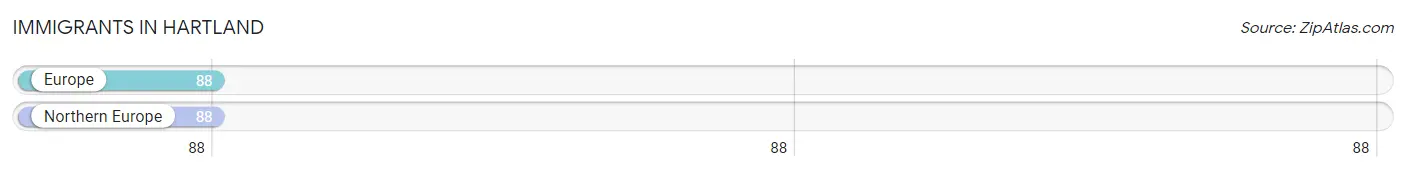
Immigrants in Hartland
The most numerous immigrant groups reported in Hartland came from Europe (88 | 14.1%), and Northern Europe (88 | 14.1%), together accounting for 28.2% of all Hartland residents.
| Immigration Origin | # Population | % Population |
| Europe | 88 | 14.1% |
| Northern Europe | 88 | 14.1% | View All 2 Rows |
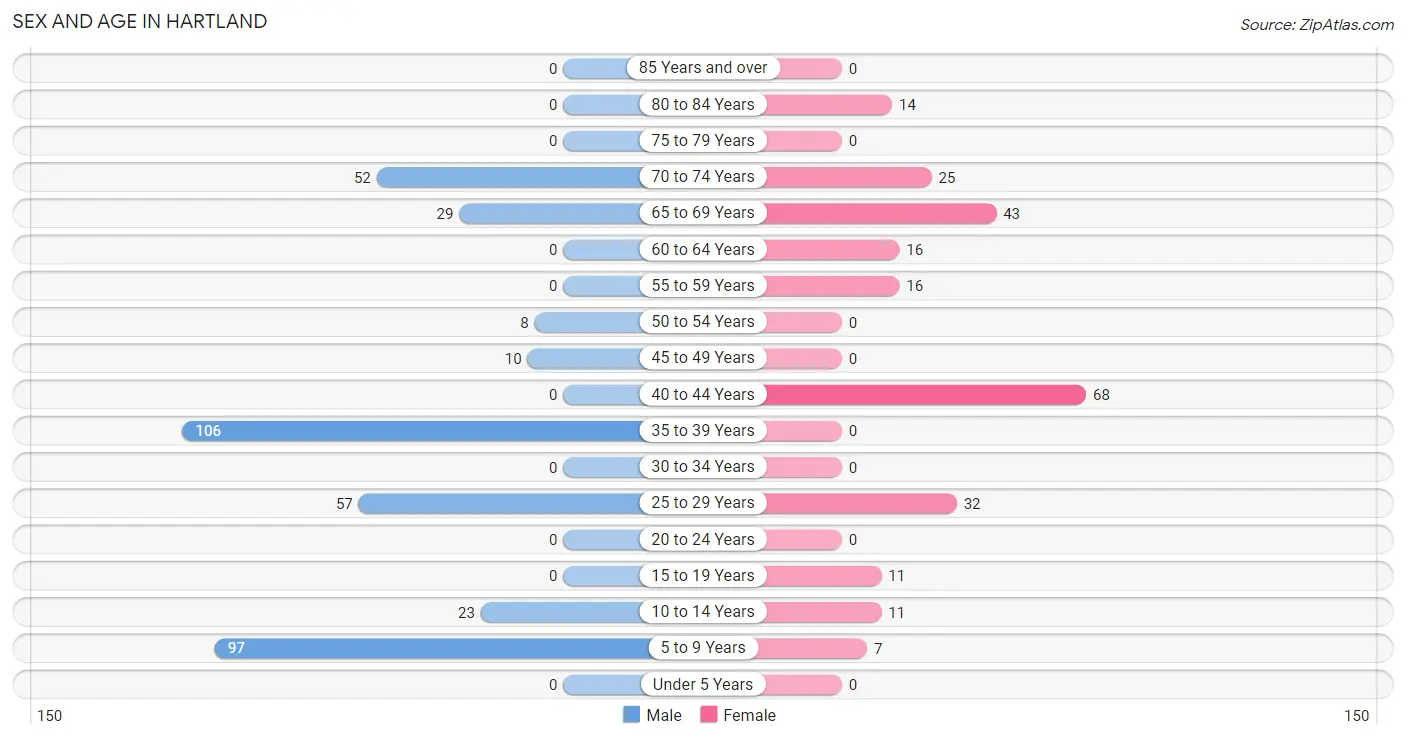
Sex and Age in Hartland
Sex and Age in Hartland
The most populous age groups in Hartland are 35 to 39 Years (106 | 27.8%) for men and 40 to 44 Years (68 | 28.0%) for women.
| Age Bracket | Male | Female |
| Under 5 Years | 0 (0.0%) | 0 (0.0%) |
| 5 to 9 Years | 97 (25.4%) | 7 (2.9%) |
| 10 to 14 Years | 23 (6.0%) | 11 (4.5%) |
| 15 to 19 Years | 0 (0.0%) | 11 (4.5%) |
| 20 to 24 Years | 0 (0.0%) | 0 (0.0%) |
| 25 to 29 Years | 57 (14.9%) | 32 (13.2%) |
| 30 to 34 Years | 0 (0.0%) | 0 (0.0%) |
| 35 to 39 Years | 106 (27.8%) | 0 (0.0%) |
| 40 to 44 Years | 0 (0.0%) | 68 (28.0%) |
| 45 to 49 Years | 10 (2.6%) | 0 (0.0%) |
| 50 to 54 Years | 8 (2.1%) | 0 (0.0%) |
| 55 to 59 Years | 0 (0.0%) | 16 (6.6%) |
| 60 to 64 Years | 0 (0.0%) | 16 (6.6%) |
| 65 to 69 Years | 29 (7.6%) | 43 (17.7%) |
| 70 to 74 Years | 52 (13.6%) | 25 (10.3%) |
| 75 to 79 Years | 0 (0.0%) | 0 (0.0%) |
| 80 to 84 Years | 0 (0.0%) | 14 (5.8%) |
| 85 Years and over | 0 (0.0%) | 0 (0.0%) |
| Total | 382 (100.0%) | 243 (100.0%) |
Families and Households in Hartland
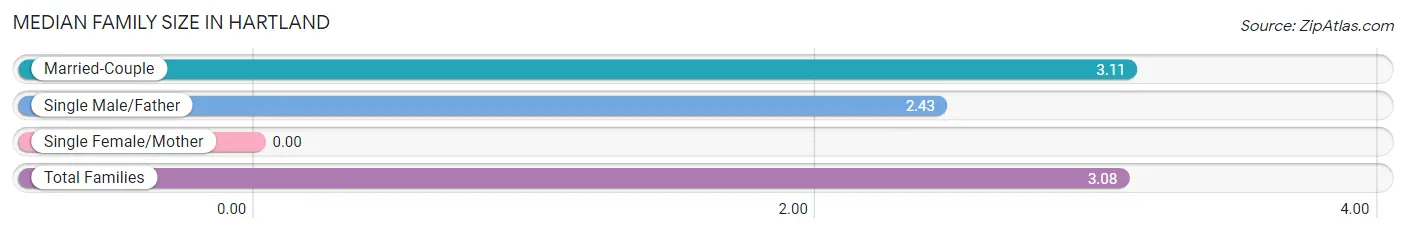
Median Family Size in Hartland
| Family Type | # Families | Family Size |
| Married-Couple | 167 (96.0%) | 3.11 |
| Single Male/Father | 7 (4.0%) | 2.43 |
| Single Female/Mother | 0 (0.0%) | - |
| Total Families | 174 (100.0%) | 3.08 |
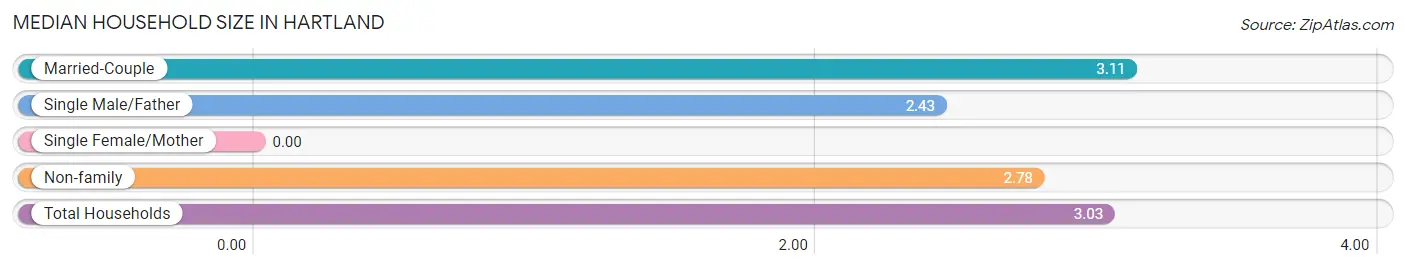
Median Household Size in Hartland
| Household Type | # Households | Household Size |
| Married-Couple | 167 (81.1%) | 3.11 |
| Single Male/Father | 7 (3.4%) | 2.43 |
| Single Female/Mother | 0 (0.0%) | - |
| Non-family | 32 (15.5%) | 2.78 |
| Total Households | 206 (100.0%) | 3.03 |
Household Size by Marriage Status in Hartland
Out of a total of 206 households in Hartland, 174 (84.5%) are family households, while 32 (15.5%) are nonfamily households. The most numerous type of family households are 2-person households, comprising 82, and the most common type of nonfamily households are 2-person households, comprising 32.
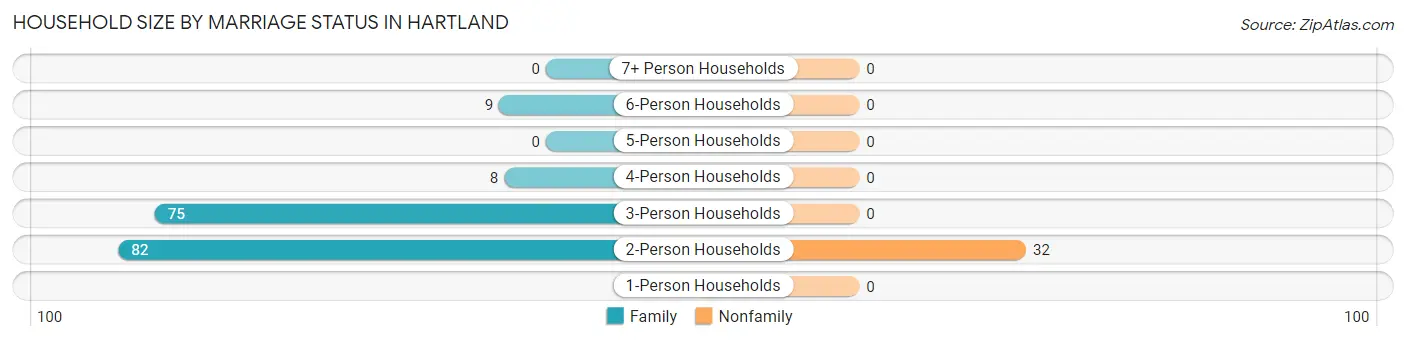
| Household Size | Family Households | Nonfamily Households |
| 1-Person Households | - | 0 (0.0%) |
| 2-Person Households | 82 (39.8%) | 32 (15.5%) |
| 3-Person Households | 75 (36.4%) | 0 (0.0%) |
| 4-Person Households | 8 (3.9%) | 0 (0.0%) |
| 5-Person Households | 0 (0.0%) | 0 (0.0%) |
| 6-Person Households | 9 (4.4%) | 0 (0.0%) |
| 7+ Person Households | 0 (0.0%) | 0 (0.0%) |
| Total | 174 (84.5%) | 32 (15.5%) |
Female Fertility in Hartland
Fertility by Age in Hartland
| Age Bracket | Women with Births | Births / 1,000 Women |
| 15 to 19 years | 0 (0.0%) | 0.0 |
| 20 to 34 years | 0 (0.0%) | 0.0 |
| 35 to 50 years | 0 (0.0%) | 0.0 |
| Total | 0 (0.0%) | 0.0 |
Fertility by Age by Marriage Status in Hartland
| Age Bracket | Married | Unmarried |
| 15 to 19 years | 0 (0.0%) | 0 (0.0%) |
| 20 to 34 years | 0 (0.0%) | 0 (0.0%) |
| 35 to 50 years | 0 (0.0%) | 0 (0.0%) |
| Total | 0 (0.0%) | 0 (0.0%) |
Fertility by Education in Hartland
| Educational Attainment | Women with Births | Births / 1,000 Women |
| Less than High School | 0 (0.0%) | 0.0 |
| High School Diploma | 0 (0.0%) | 0.0 |
| College or Associate's Degree | 0 (0.0%) | 0.0 |
| Bachelor's Degree | 0 (0.0%) | 0.0 |
| Graduate Degree | 0 (0.0%) | 0.0 |
| Total | 0 (0.0%) | 0.0 |
Fertility by Education by Marriage Status in Hartland
| Educational Attainment | Married | Unmarried |
| Less than High School | 0 (0.0%) | 0 (0.0%) |
| High School Diploma | 0 (0.0%) | 0 (0.0%) |
| College or Associate's Degree | 0 (0.0%) | 0 (0.0%) |
| Bachelor's Degree | 0 (0.0%) | 0 (0.0%) |
| Graduate Degree | 0 (0.0%) | 0 (0.0%) |
| Total | 0 (0.0%) | 0 (0.0%) |
Employment Characteristics in Hartland
Employment by Class of Employer in Hartland
Among the 264 employed individuals in Hartland, private company employees (172 | 65.1%), self-employed (incorporated) (46 | 17.4%), and not-for-profit organizations (24 | 9.1%) make up the most common classes of employment.
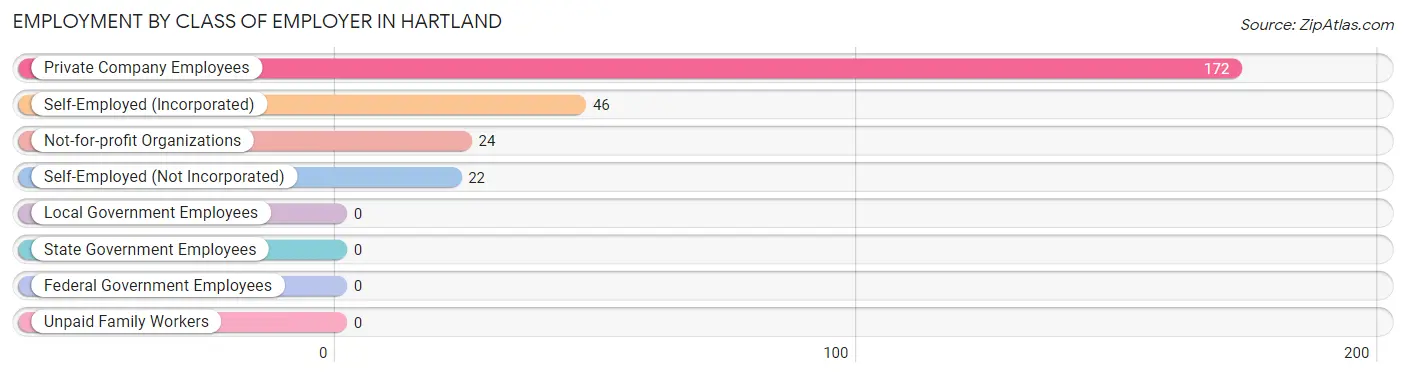
| Employer Class | # Employees | % Employees |
| Private Company Employees | 172 | 65.1% |
| Self-Employed (Incorporated) | 46 | 17.4% |
| Self-Employed (Not Incorporated) | 22 | 8.3% |
| Not-for-profit Organizations | 24 | 9.1% |
| Local Government Employees | 0 | 0.0% |
| State Government Employees | 0 | 0.0% |
| Federal Government Employees | 0 | 0.0% |
| Unpaid Family Workers | 0 | 0.0% |
| Total | 264 | 100.0% |
Employment Status by Age in Hartland
According to the labor force statistics for Hartland, out of the total population over 16 years of age (487), 57.9% or 282 individuals are in the labor force, with 6.4% or 18 of them unemployed. The age group with the highest labor force participation rate is 45 to 54 years, with 100.0% or 18 individuals in the labor force. Within the labor force, the 35 to 44 years age range has the highest percentage of unemployed individuals, with 17.0% or 18 of them being unemployed.
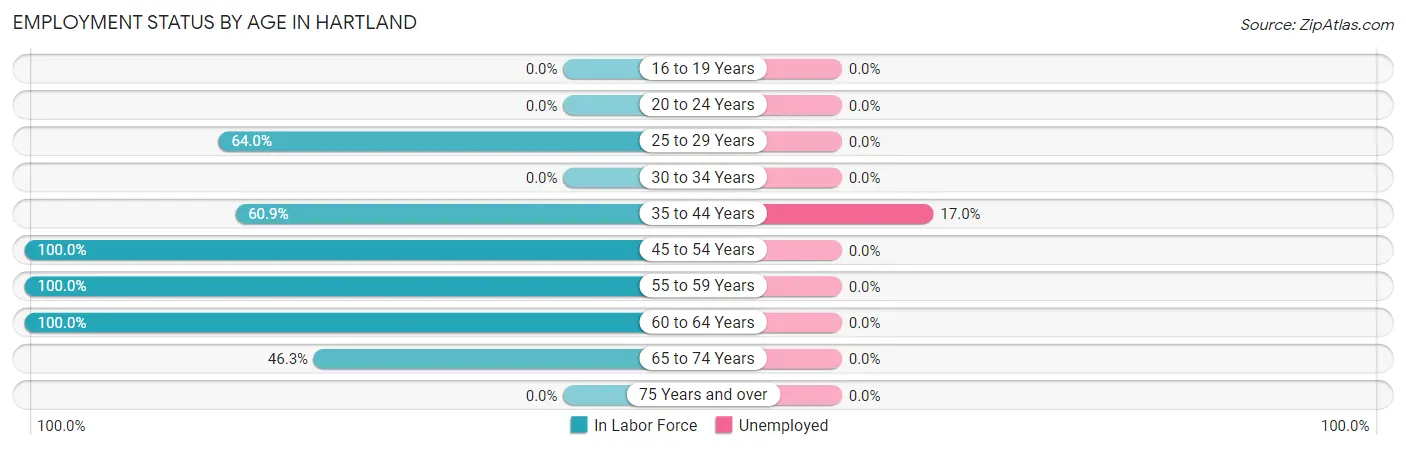
| Age Bracket | In Labor Force | Unemployed |
| 16 to 19 Years | 0 (0.0%) | 0 (0.0%) |
| 20 to 24 Years | 0 (0.0%) | 0 (0.0%) |
| 25 to 29 Years | 57 (64.0%) | 0 (0.0%) |
| 30 to 34 Years | 0 (0.0%) | 0 (0.0%) |
| 35 to 44 Years | 106 (60.9%) | 18 (17.0%) |
| 45 to 54 Years | 18 (100.0%) | 0 (0.0%) |
| 55 to 59 Years | 16 (100.0%) | 0 (0.0%) |
| 60 to 64 Years | 16 (100.0%) | 0 (0.0%) |
| 65 to 74 Years | 69 (46.3%) | 0 (0.0%) |
| 75 Years and over | 0 (0.0%) | 0 (0.0%) |
| Total | 282 (57.9%) | 18 (6.4%) |
Employment Status by Educational Attainment in Hartland
According to labor force statistics for Hartland, 68.1% of individuals (213) out of the total population between 25 and 64 years of age (313) are in the labor force, with 8.5% or 18 of them being unemployed. The group with the highest labor force participation rate are those with the educational attainment of less than high school, with 100.0% or 3 individuals in the labor force. Within the labor force, individuals with high school diploma education have the highest percentage of unemployment, with 42.9% or 18 of them being unemployed.
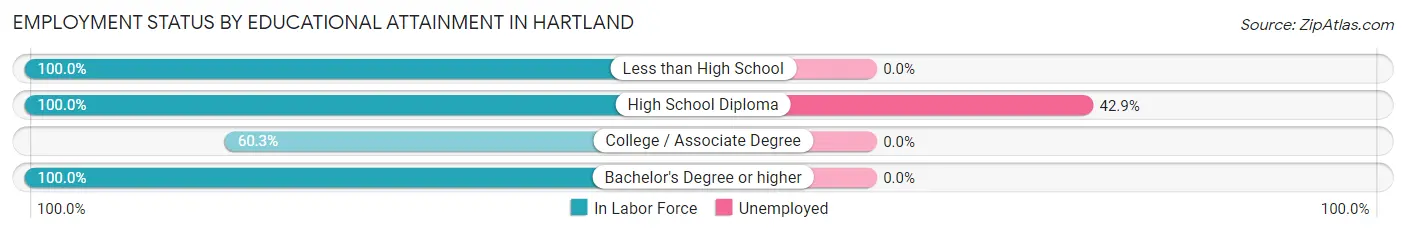
| Educational Attainment | In Labor Force | Unemployed |
| Less than High School | 3 (100.0%) | 0 (0.0%) |
| High School Diploma | 42 (100.0%) | 18 (42.9%) |
| College / Associate Degree | 152 (60.3%) | 0 (0.0%) |
| Bachelor's Degree or higher | 16 (100.0%) | 0 (0.0%) |
| Total | 213 (68.1%) | 27 (8.5%) |
Employment Occupations by Sex in Hartland
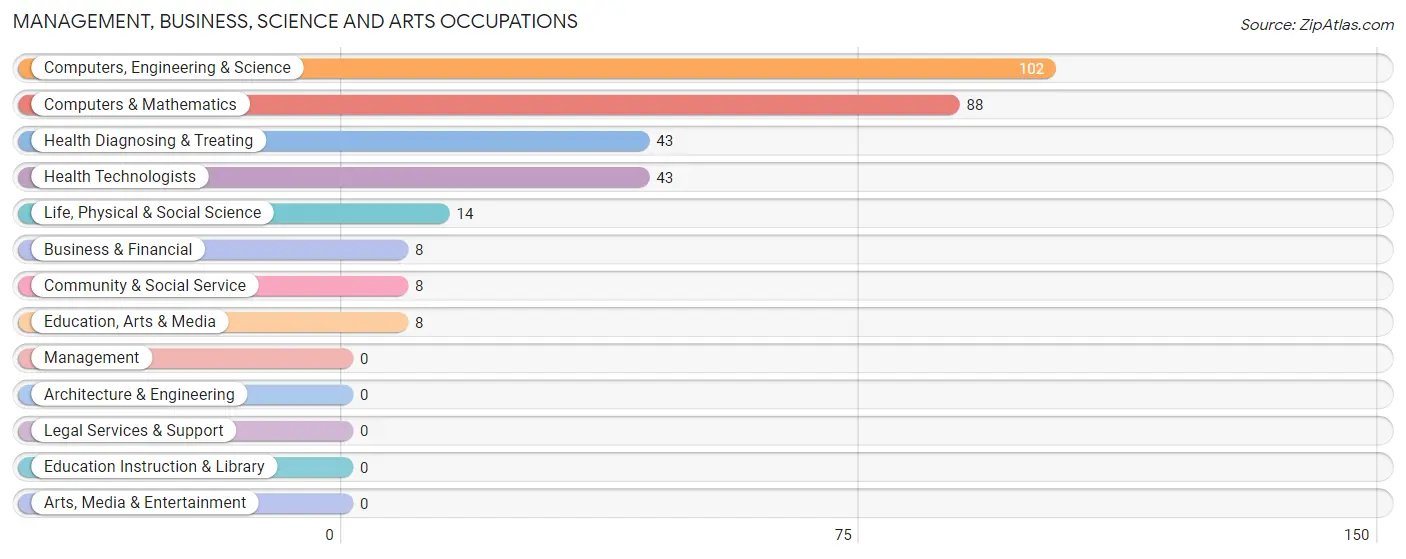
Management, Business, Science and Arts Occupations
The most common Management, Business, Science and Arts occupations in Hartland are Computers, Engineering & Science (102 | 38.6%), Computers & Mathematics (88 | 33.3%), Health Diagnosing & Treating (43 | 16.3%), Health Technologists (43 | 16.3%), and Life, Physical & Social Science (14 | 5.3%).
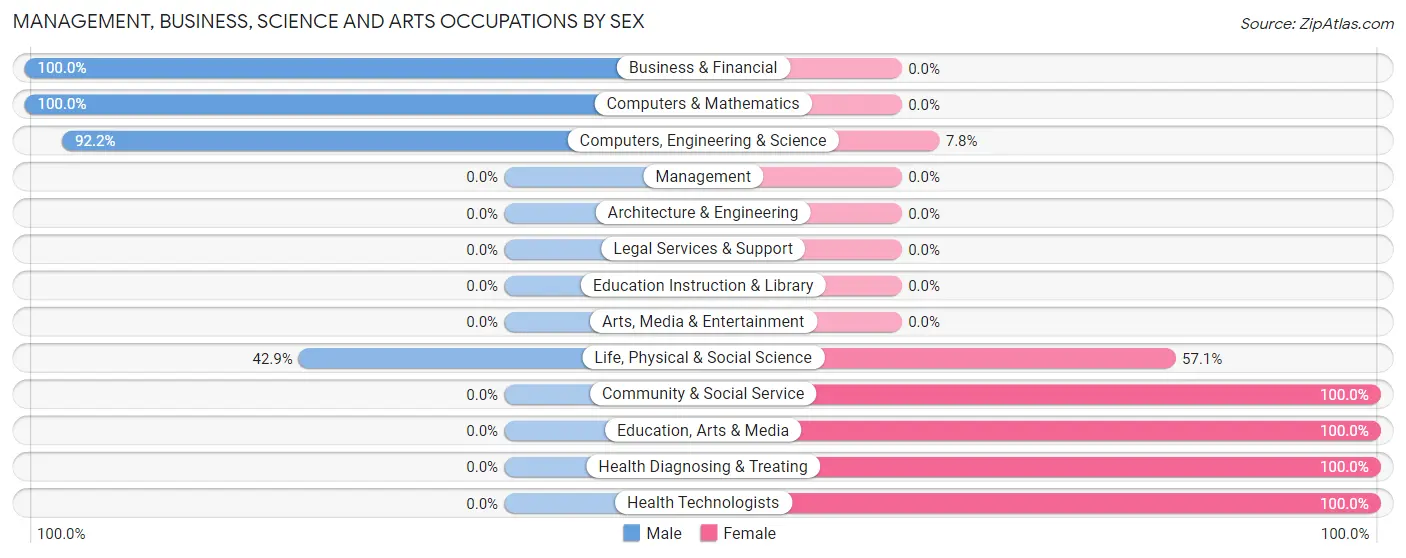
Management, Business, Science and Arts Occupations by Sex
Within the Management, Business, Science and Arts occupations in Hartland, the most male-oriented occupations are Business & Financial (100.0%), Computers & Mathematics (100.0%), and Computers, Engineering & Science (92.2%), while the most female-oriented occupations are Community & Social Service (100.0%), Education, Arts & Media (100.0%), and Health Diagnosing & Treating (100.0%).
| Occupation | Male | Female |
| Management | 0 (0.0%) | 0 (0.0%) |
| Business & Financial | 8 (100.0%) | 0 (0.0%) |
| Computers, Engineering & Science | 94 (92.2%) | 8 (7.8%) |
| Computers & Mathematics | 88 (100.0%) | 0 (0.0%) |
| Architecture & Engineering | 0 (0.0%) | 0 (0.0%) |
| Life, Physical & Social Science | 6 (42.9%) | 8 (57.1%) |
| Community & Social Service | 0 (0.0%) | 8 (100.0%) |
| Education, Arts & Media | 0 (0.0%) | 8 (100.0%) |
| Legal Services & Support | 0 (0.0%) | 0 (0.0%) |
| Education Instruction & Library | 0 (0.0%) | 0 (0.0%) |
| Arts, Media & Entertainment | 0 (0.0%) | 0 (0.0%) |
| Health Diagnosing & Treating | 0 (0.0%) | 43 (100.0%) |
| Health Technologists | 0 (0.0%) | 43 (100.0%) |
| Total (Category) | 102 (63.3%) | 59 (36.6%) |
| Total (Overall) | 189 (71.6%) | 75 (28.4%) |
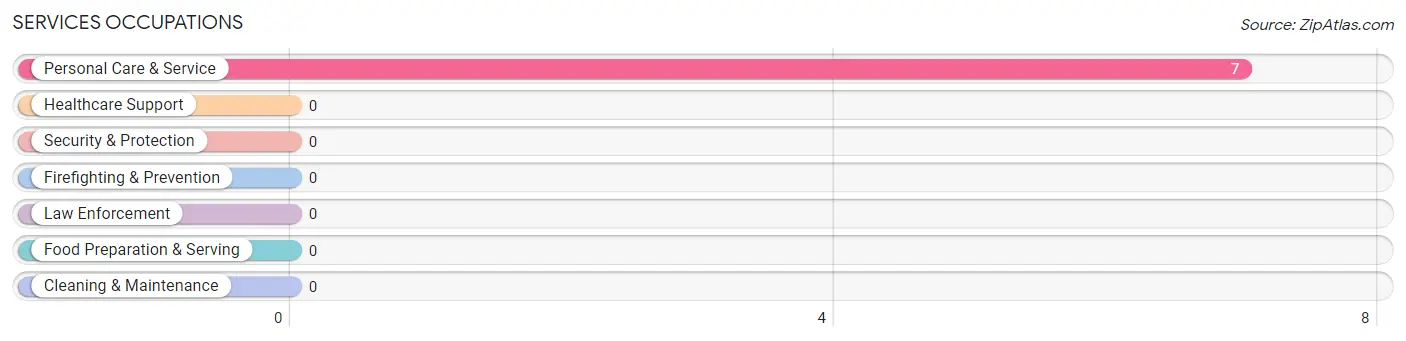
Services Occupations
The most common Services occupations in Hartland are , and Personal Care & Service (7 | 2.6%).
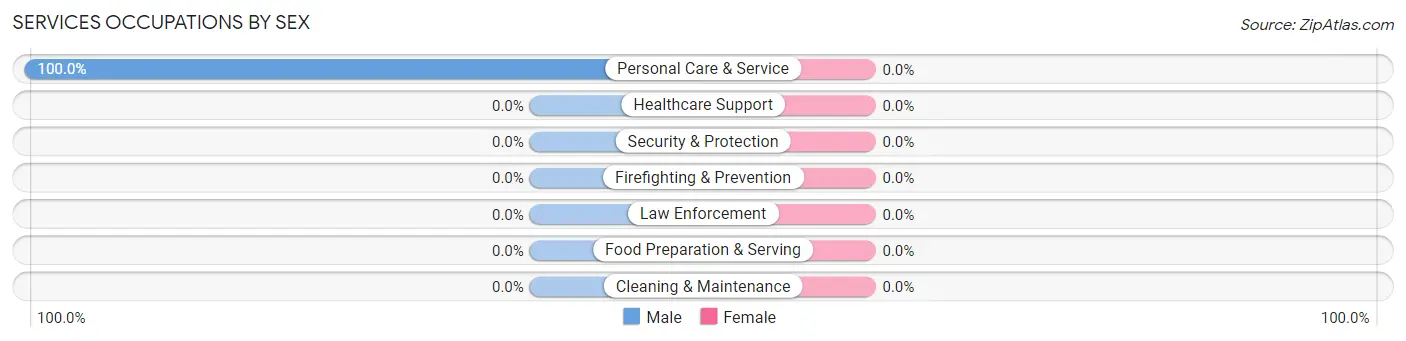
Services Occupations by Sex
| Occupation | Male | Female |
| Healthcare Support | 0 (0.0%) | 0 (0.0%) |
| Security & Protection | 0 (0.0%) | 0 (0.0%) |
| Firefighting & Prevention | 0 (0.0%) | 0 (0.0%) |
| Law Enforcement | 0 (0.0%) | 0 (0.0%) |
| Food Preparation & Serving | 0 (0.0%) | 0 (0.0%) |
| Cleaning & Maintenance | 0 (0.0%) | 0 (0.0%) |
| Personal Care & Service | 7 (100.0%) | 0 (0.0%) |
| Total (Category) | 7 (100.0%) | 0 (0.0%) |
| Total (Overall) | 189 (71.6%) | 75 (28.4%) |
Sales and Office Occupations
The most common Sales and Office occupations in Hartland are , and Office & Administration (16 | 6.1%).
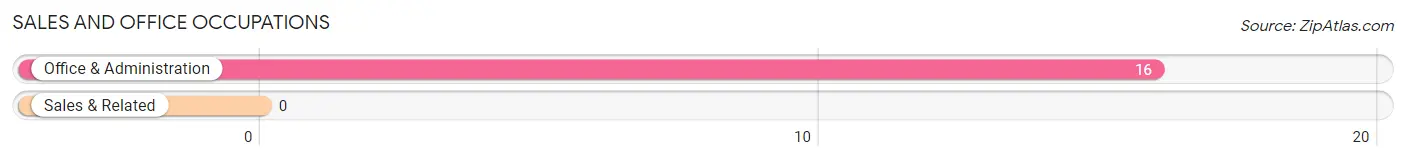
Sales and Office Occupations by Sex
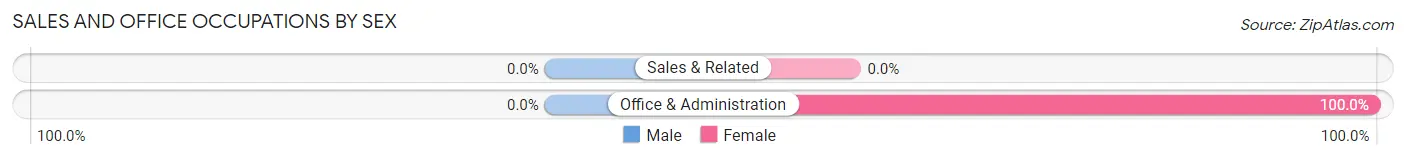
| Occupation | Male | Female |
| Sales & Related | 0 (0.0%) | 0 (0.0%) |
| Office & Administration | 0 (0.0%) | 16 (100.0%) |
| Total (Category) | 0 (0.0%) | 16 (100.0%) |
| Total (Overall) | 189 (71.6%) | 75 (28.4%) |
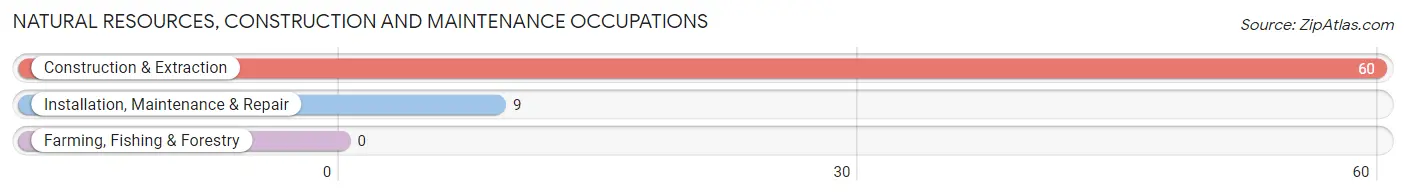
Natural Resources, Construction and Maintenance Occupations
The most common Natural Resources, Construction and Maintenance occupations in Hartland are Construction & Extraction (60 | 22.7%), and Installation, Maintenance & Repair (9 | 3.4%).
Natural Resources, Construction and Maintenance Occupations by Sex
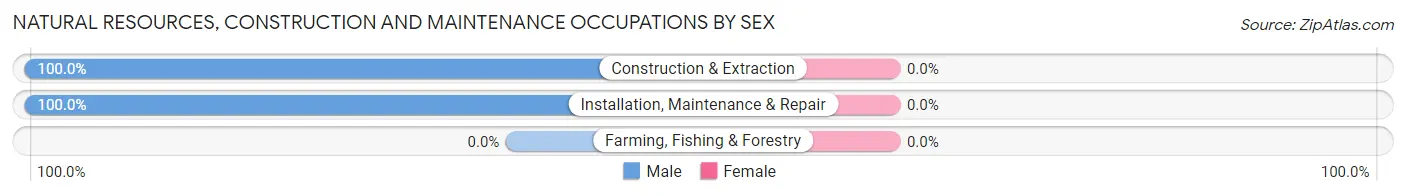
| Occupation | Male | Female |
| Farming, Fishing & Forestry | 0 (0.0%) | 0 (0.0%) |
| Construction & Extraction | 60 (100.0%) | 0 (0.0%) |
| Installation, Maintenance & Repair | 9 (100.0%) | 0 (0.0%) |
| Total (Category) | 69 (100.0%) | 0 (0.0%) |
| Total (Overall) | 189 (71.6%) | 75 (28.4%) |
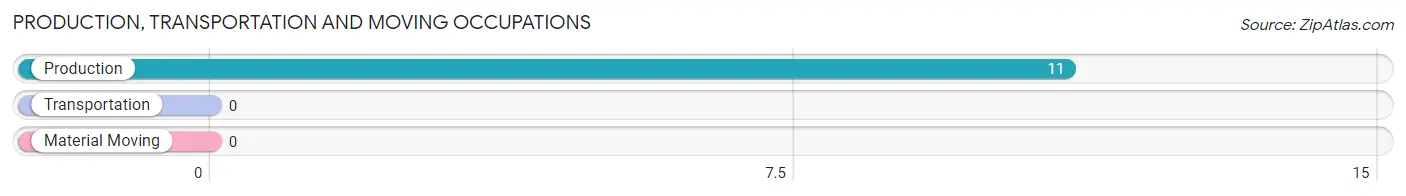
Production, Transportation and Moving Occupations
The most common Production, Transportation and Moving occupations in Hartland are , and Production (11 | 4.2%).
Production, Transportation and Moving Occupations by Sex
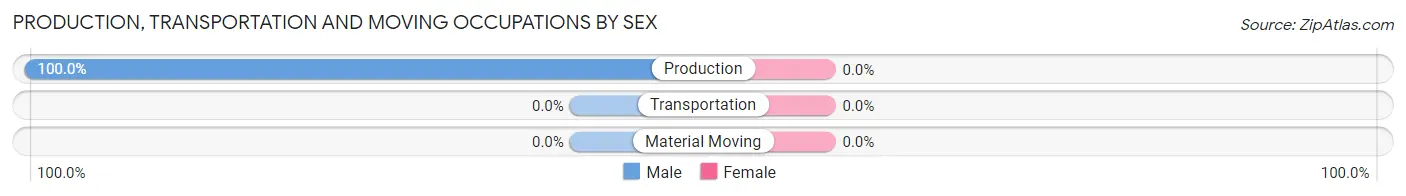
| Occupation | Male | Female |
| Production | 11 (100.0%) | 0 (0.0%) |
| Transportation | 0 (0.0%) | 0 (0.0%) |
| Material Moving | 0 (0.0%) | 0 (0.0%) |
| Total (Category) | 11 (100.0%) | 0 (0.0%) |
| Total (Overall) | 189 (71.6%) | 75 (28.4%) |
Employment Industries by Sex in Hartland
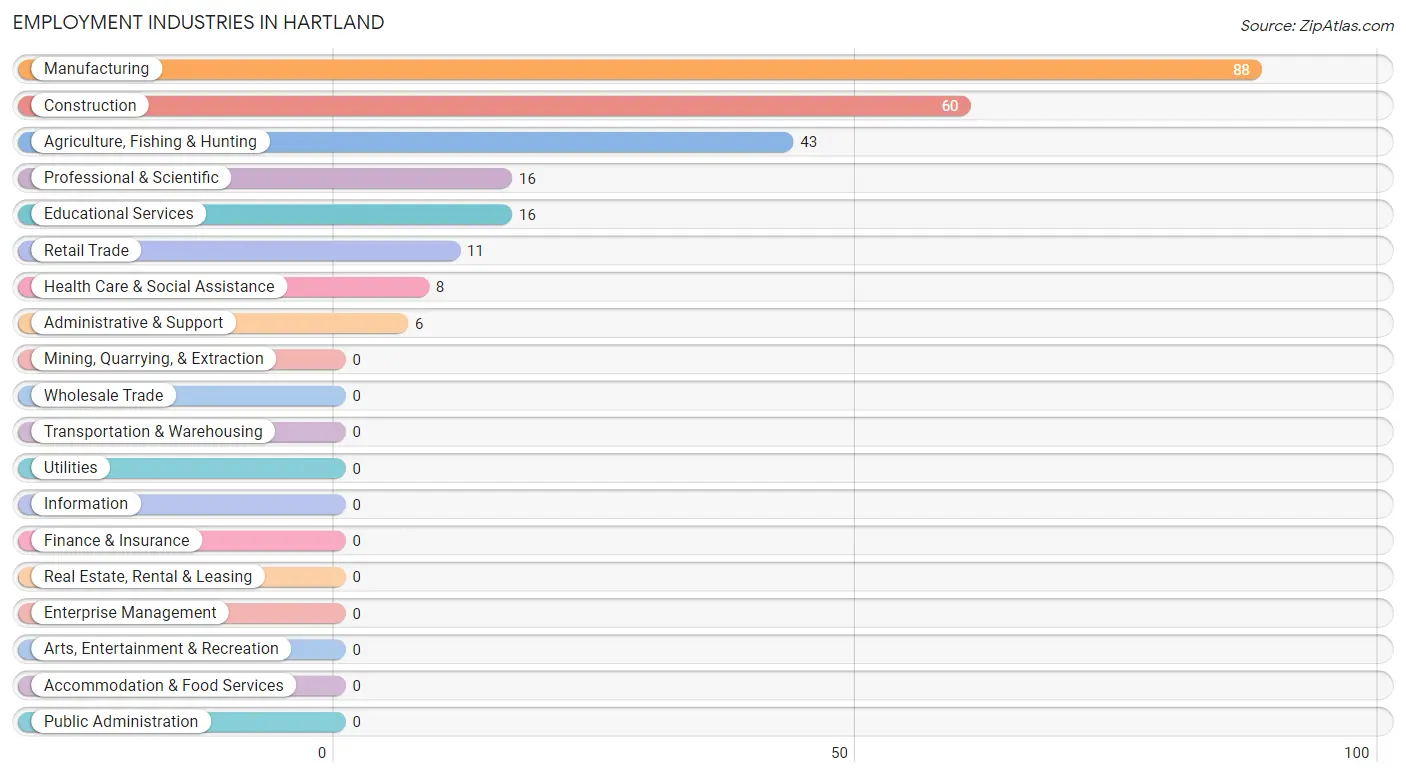
Employment Industries in Hartland
The major employment industries in Hartland include Manufacturing (88 | 33.3%), Construction (60 | 22.7%), Agriculture, Fishing & Hunting (43 | 16.3%), Professional & Scientific (16 | 6.1%), and Educational Services (16 | 6.1%).
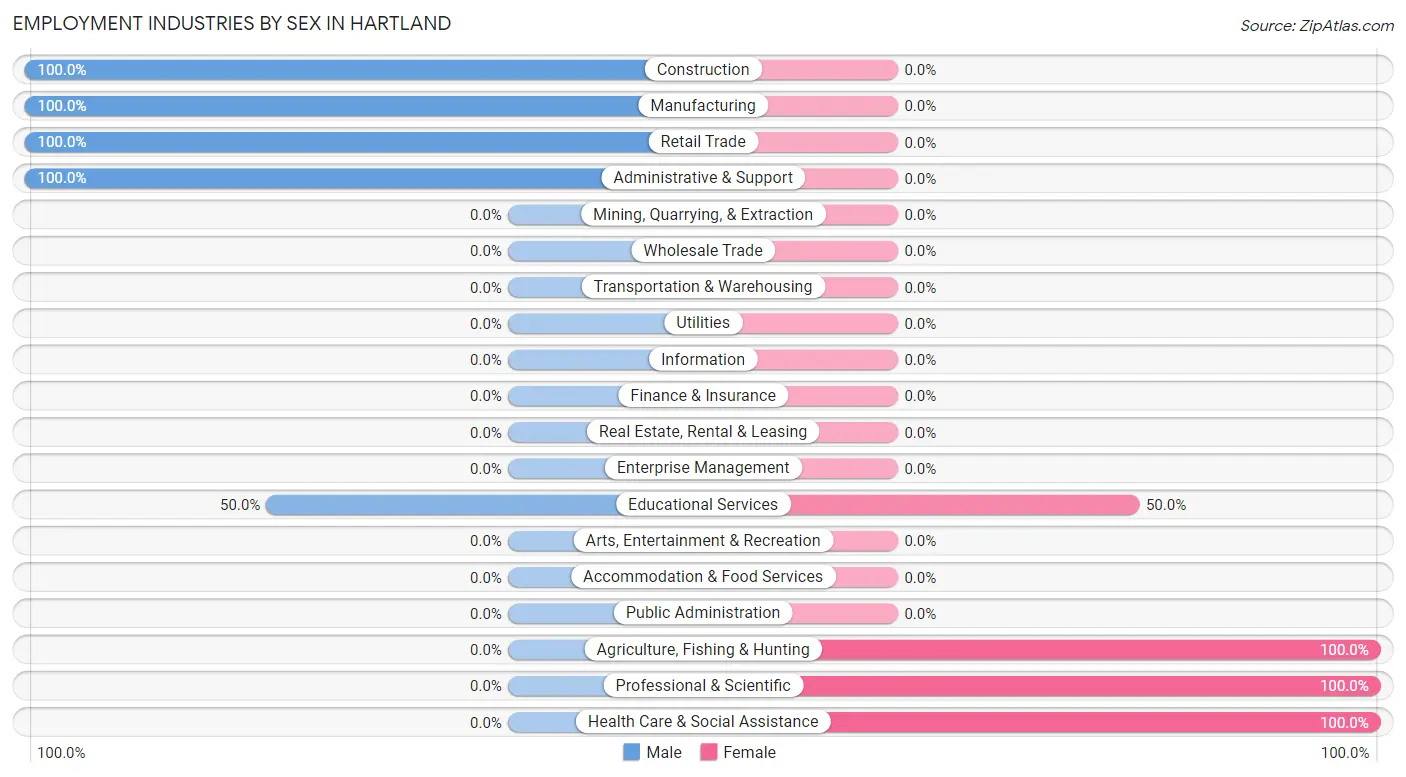
Employment Industries by Sex in Hartland
The Hartland industries that see more men than women are Construction (100.0%), Manufacturing (100.0%), and Retail Trade (100.0%), whereas the industries that tend to have a higher number of women are Agriculture, Fishing & Hunting (100.0%), Professional & Scientific (100.0%), and Health Care & Social Assistance (100.0%).
| Industry | Male | Female |
| Agriculture, Fishing & Hunting | 0 (0.0%) | 43 (100.0%) |
| Mining, Quarrying, & Extraction | 0 (0.0%) | 0 (0.0%) |
| Construction | 60 (100.0%) | 0 (0.0%) |
| Manufacturing | 88 (100.0%) | 0 (0.0%) |
| Wholesale Trade | 0 (0.0%) | 0 (0.0%) |
| Retail Trade | 11 (100.0%) | 0 (0.0%) |
| Transportation & Warehousing | 0 (0.0%) | 0 (0.0%) |
| Utilities | 0 (0.0%) | 0 (0.0%) |
| Information | 0 (0.0%) | 0 (0.0%) |
| Finance & Insurance | 0 (0.0%) | 0 (0.0%) |
| Real Estate, Rental & Leasing | 0 (0.0%) | 0 (0.0%) |
| Professional & Scientific | 0 (0.0%) | 16 (100.0%) |
| Enterprise Management | 0 (0.0%) | 0 (0.0%) |
| Administrative & Support | 6 (100.0%) | 0 (0.0%) |
| Educational Services | 8 (50.0%) | 8 (50.0%) |
| Health Care & Social Assistance | 0 (0.0%) | 8 (100.0%) |
| Arts, Entertainment & Recreation | 0 (0.0%) | 0 (0.0%) |
| Accommodation & Food Services | 0 (0.0%) | 0 (0.0%) |
| Public Administration | 0 (0.0%) | 0 (0.0%) |
| Total | 189 (71.6%) | 75 (28.4%) |
Education in Hartland
School Enrollment in Hartland
The most common levels of schooling among the 149 students in Hartland are elementary school (97 | 65.1%), middle school (34 | 22.8%), and high school (11 | 7.4%).
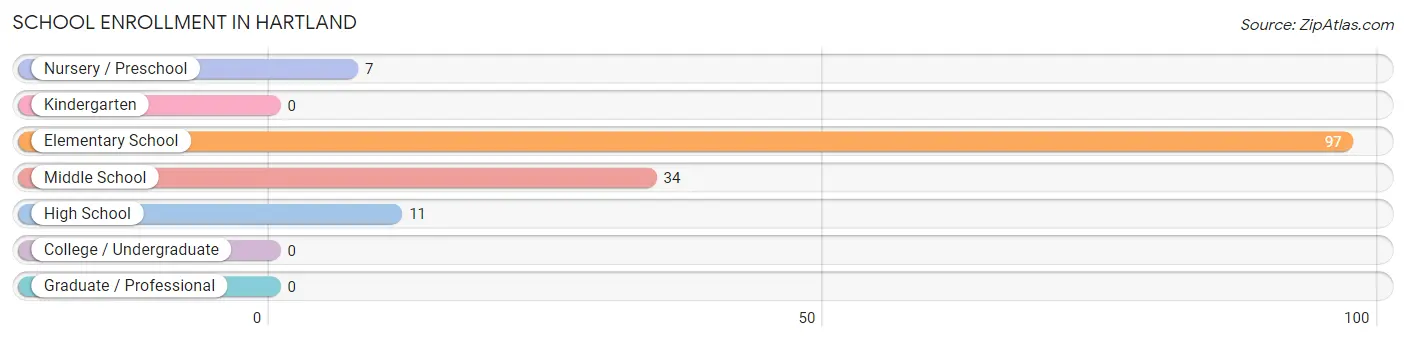
| School Level | # Students | % Students |
| Nursery / Preschool | 7 | 4.7% |
| Kindergarten | 0 | 0.0% |
| Elementary School | 97 | 65.1% |
| Middle School | 34 | 22.8% |
| High School | 11 | 7.4% |
| College / Undergraduate | 0 | 0.0% |
| Graduate / Professional | 0 | 0.0% |
| Total | 149 | 100.0% |
School Enrollment by Age by Funding Source in Hartland
Out of a total of 149 students who are enrolled in schools in Hartland, 12 (8.1%) attend a private institution, while the remaining 137 (91.9%) are enrolled in public schools. The age group of 10 to 14 year olds has the highest likelihood of being enrolled in private schools, with 12 (35.3% in the age bracket) enrolled. Conversely, the age group of 5 to 9 year old has the lowest likelihood of being enrolled in a private school, with 104 (100.0% in the age bracket) attending a public institution.
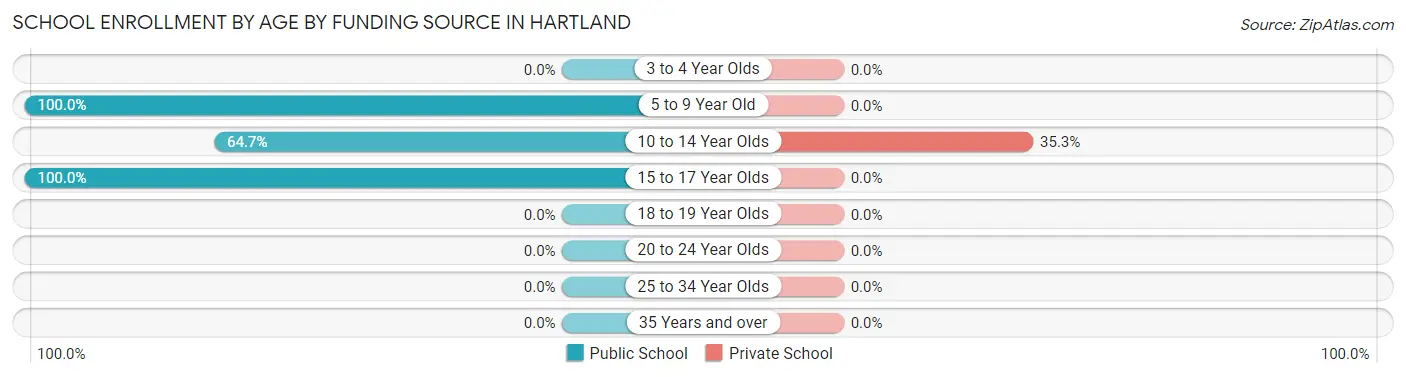
| Age Bracket | Public School | Private School |
| 3 to 4 Year Olds | 0 (0.0%) | 0 (0.0%) |
| 5 to 9 Year Old | 104 (100.0%) | 0 (0.0%) |
| 10 to 14 Year Olds | 22 (64.7%) | 12 (35.3%) |
| 15 to 17 Year Olds | 11 (100.0%) | 0 (0.0%) |
| 18 to 19 Year Olds | 0 (0.0%) | 0 (0.0%) |
| 20 to 24 Year Olds | 0 (0.0%) | 0 (0.0%) |
| 25 to 34 Year Olds | 0 (0.0%) | 0 (0.0%) |
| 35 Years and over | 0 (0.0%) | 0 (0.0%) |
| Total | 137 (91.9%) | 12 (8.1%) |
Educational Attainment by Field of Study in Hartland
Science & technology (43 | 66.1%), bio, nature & agricultural (14 | 21.5%), and social sciences (8 | 12.3%) are the most common fields of study among 65 individuals in Hartland who have obtained a bachelor's degree or higher.
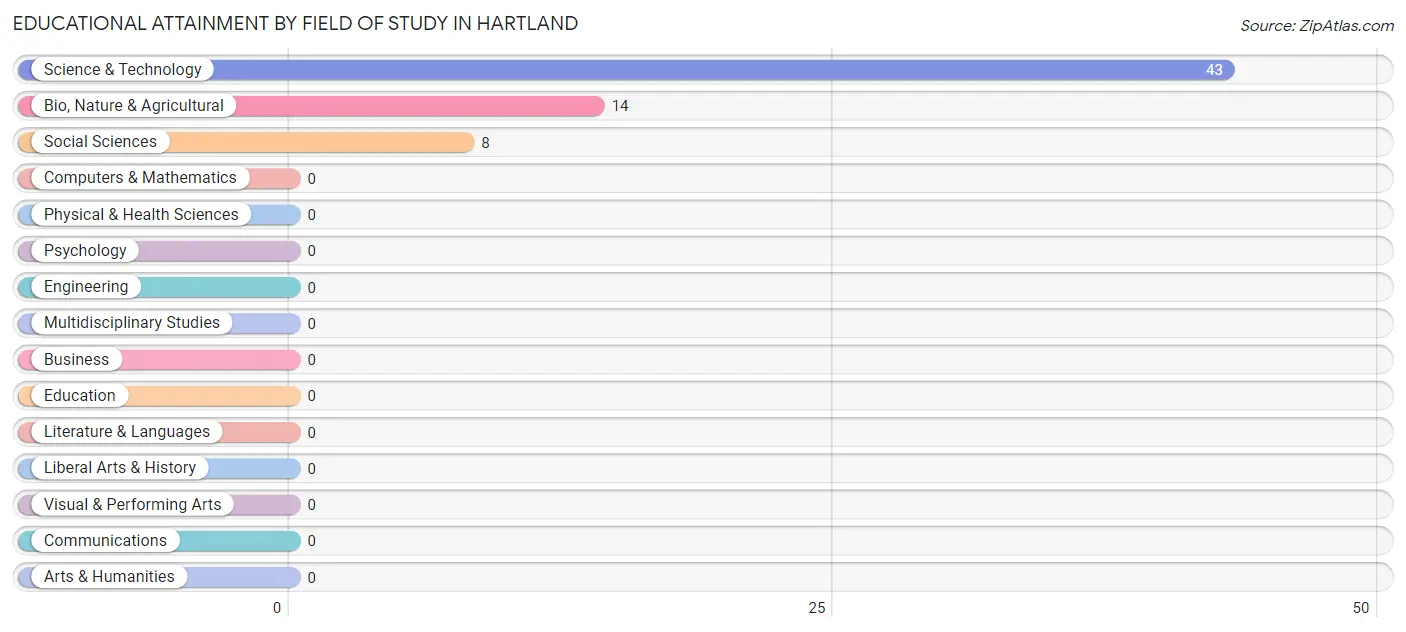
| Field of Study | # Graduates | % Graduates |
| Computers & Mathematics | 0 | 0.0% |
| Bio, Nature & Agricultural | 14 | 21.5% |
| Physical & Health Sciences | 0 | 0.0% |
| Psychology | 0 | 0.0% |
| Social Sciences | 8 | 12.3% |
| Engineering | 0 | 0.0% |
| Multidisciplinary Studies | 0 | 0.0% |
| Science & Technology | 43 | 66.1% |
| Business | 0 | 0.0% |
| Education | 0 | 0.0% |
| Literature & Languages | 0 | 0.0% |
| Liberal Arts & History | 0 | 0.0% |
| Visual & Performing Arts | 0 | 0.0% |
| Communications | 0 | 0.0% |
| Arts & Humanities | 0 | 0.0% |
| Total | 65 | 100.0% |
Transportation & Commute in Hartland
Vehicle Availability by Sex in Hartland
The most prevalent vehicle ownership categories in Hartland are males with 2 vehicles (173, accounting for 91.5%) and females with 2 vehicles (59, making up 230.7%).
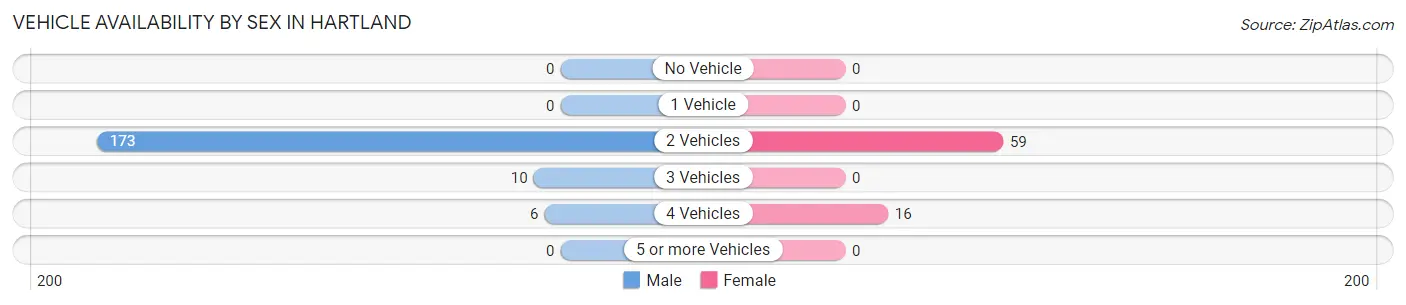
| Vehicles Available | Male | Female |
| No Vehicle | 0 (0.0%) | 0 (0.0%) |
| 1 Vehicle | 0 (0.0%) | 0 (0.0%) |
| 2 Vehicles | 173 (91.5%) | 59 (78.7%) |
| 3 Vehicles | 10 (5.3%) | 0 (0.0%) |
| 4 Vehicles | 6 (3.2%) | 16 (21.3%) |
| 5 or more Vehicles | 0 (0.0%) | 0 (0.0%) |
| Total | 189 (100.0%) | 75 (100.0%) |
Commute Time in Hartland
The most frequently occuring commute durations in Hartland are 25 to 29 minutes (99 commuters, 46.7%), 20 to 24 minutes (72 commuters, 34.0%), and 15 to 19 minutes (19 commuters, 9.0%).
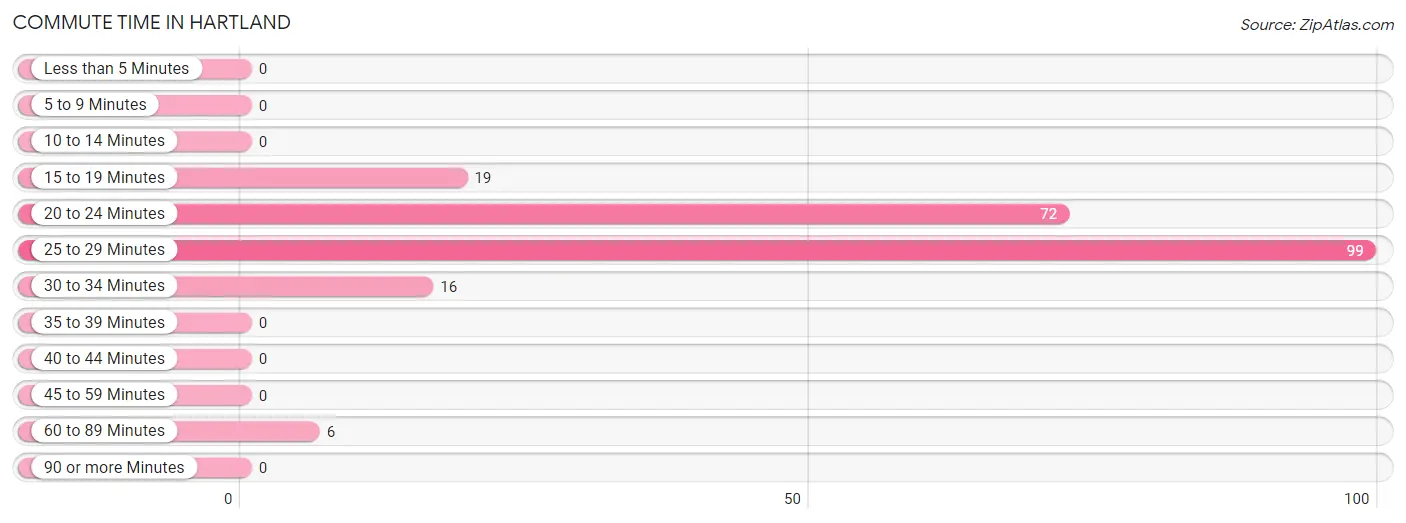
| Commute Time | # Commuters | % Commuters |
| Less than 5 Minutes | 0 | 0.0% |
| 5 to 9 Minutes | 0 | 0.0% |
| 10 to 14 Minutes | 0 | 0.0% |
| 15 to 19 Minutes | 19 | 9.0% |
| 20 to 24 Minutes | 72 | 34.0% |
| 25 to 29 Minutes | 99 | 46.7% |
| 30 to 34 Minutes | 16 | 7.5% |
| 35 to 39 Minutes | 0 | 0.0% |
| 40 to 44 Minutes | 0 | 0.0% |
| 45 to 59 Minutes | 0 | 0.0% |
| 60 to 89 Minutes | 6 | 2.8% |
| 90 or more Minutes | 0 | 0.0% |
Commute Time by Sex in Hartland
The most common commute times in Hartland are 25 to 29 minutes (99 commuters, 55.0%) for males and 15 to 19 minutes (16 commuters, 50.0%) for females.
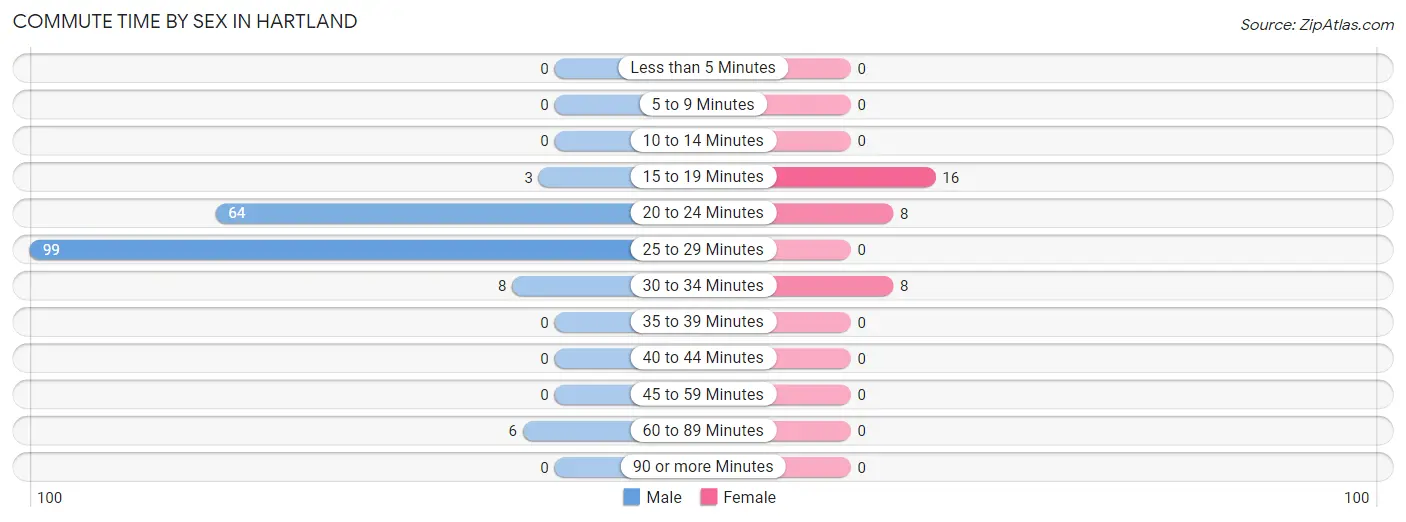
| Commute Time | Male | Female |
| Less than 5 Minutes | 0 (0.0%) | 0 (0.0%) |
| 5 to 9 Minutes | 0 (0.0%) | 0 (0.0%) |
| 10 to 14 Minutes | 0 (0.0%) | 0 (0.0%) |
| 15 to 19 Minutes | 3 (1.7%) | 16 (50.0%) |
| 20 to 24 Minutes | 64 (35.6%) | 8 (25.0%) |
| 25 to 29 Minutes | 99 (55.0%) | 0 (0.0%) |
| 30 to 34 Minutes | 8 (4.4%) | 8 (25.0%) |
| 35 to 39 Minutes | 0 (0.0%) | 0 (0.0%) |
| 40 to 44 Minutes | 0 (0.0%) | 0 (0.0%) |
| 45 to 59 Minutes | 0 (0.0%) | 0 (0.0%) |
| 60 to 89 Minutes | 6 (3.3%) | 0 (0.0%) |
| 90 or more Minutes | 0 (0.0%) | 0 (0.0%) |
Time of Departure to Work by Sex in Hartland
The most frequent times of departure to work in Hartland are 6:00 AM to 6:29 AM (88, 48.9%) for males and 8:00 AM to 8:29 AM (16, 50.0%) for females.
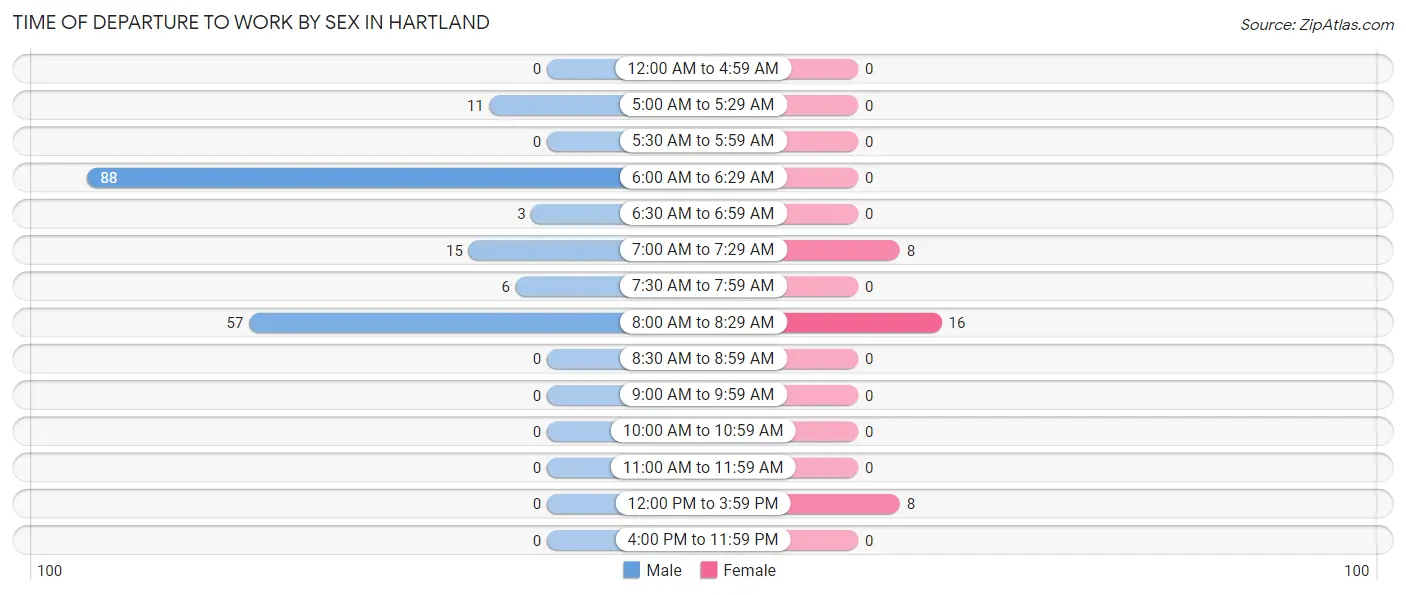
| Time of Departure | Male | Female |
| 12:00 AM to 4:59 AM | 0 (0.0%) | 0 (0.0%) |
| 5:00 AM to 5:29 AM | 11 (6.1%) | 0 (0.0%) |
| 5:30 AM to 5:59 AM | 0 (0.0%) | 0 (0.0%) |
| 6:00 AM to 6:29 AM | 88 (48.9%) | 0 (0.0%) |
| 6:30 AM to 6:59 AM | 3 (1.7%) | 0 (0.0%) |
| 7:00 AM to 7:29 AM | 15 (8.3%) | 8 (25.0%) |
| 7:30 AM to 7:59 AM | 6 (3.3%) | 0 (0.0%) |
| 8:00 AM to 8:29 AM | 57 (31.7%) | 16 (50.0%) |
| 8:30 AM to 8:59 AM | 0 (0.0%) | 0 (0.0%) |
| 9:00 AM to 9:59 AM | 0 (0.0%) | 0 (0.0%) |
| 10:00 AM to 10:59 AM | 0 (0.0%) | 0 (0.0%) |
| 11:00 AM to 11:59 AM | 0 (0.0%) | 0 (0.0%) |
| 12:00 PM to 3:59 PM | 0 (0.0%) | 8 (25.0%) |
| 4:00 PM to 11:59 PM | 0 (0.0%) | 0 (0.0%) |
| Total | 180 (100.0%) | 32 (100.0%) |
Housing Occupancy in Hartland
Occupancy by Ownership in Hartland
Of the total 206 dwellings in Hartland, owner-occupied units account for 160 (77.7%), while renter-occupied units make up 46 (22.3%).
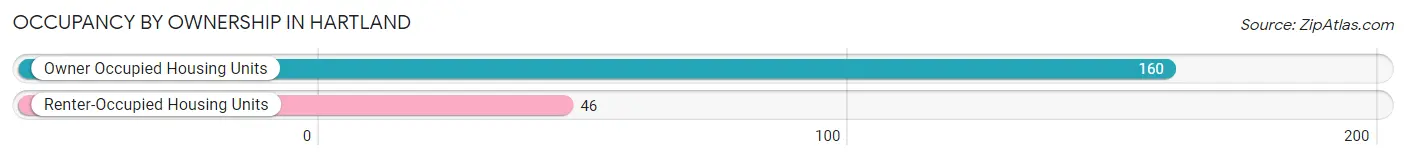
| Occupancy | # Housing Units | % Housing Units |
| Owner Occupied Housing Units | 160 | 77.7% |
| Renter-Occupied Housing Units | 46 | 22.3% |
| Total Occupied Housing Units | 206 | 100.0% |
Occupancy by Household Size in Hartland
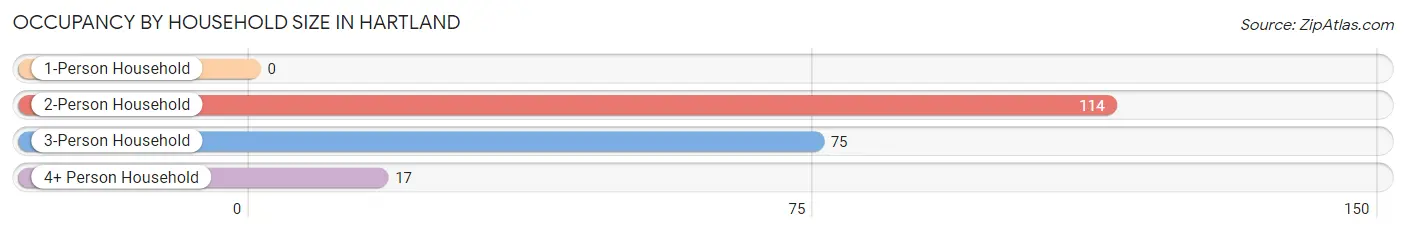
| Household Size | # Housing Units | % Housing Units |
| 1-Person Household | 0 | 0.0% |
| 2-Person Household | 114 | 55.3% |
| 3-Person Household | 75 | 36.4% |
| 4+ Person Household | 17 | 8.3% |
| Total Housing Units | 206 | 100.0% |
Occupancy by Ownership by Household Size in Hartland
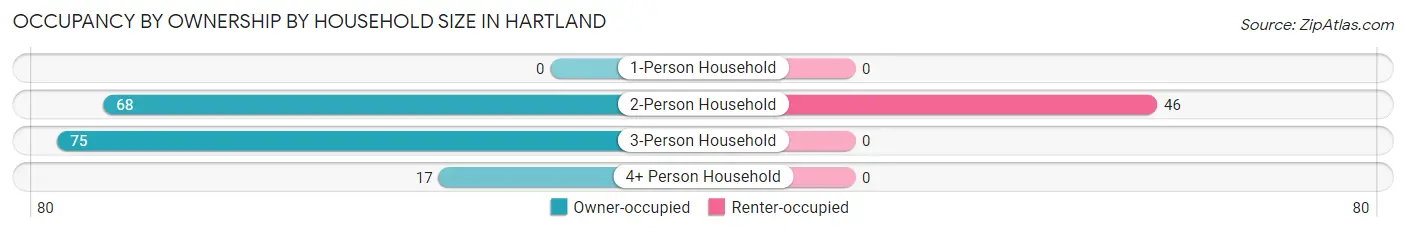
| Household Size | Owner-occupied | Renter-occupied |
| 1-Person Household | 0 (0.0%) | 0 (0.0%) |
| 2-Person Household | 68 (59.7%) | 46 (40.4%) |
| 3-Person Household | 75 (100.0%) | 0 (0.0%) |
| 4+ Person Household | 17 (100.0%) | 0 (0.0%) |
| Total Housing Units | 160 (77.7%) | 46 (22.3%) |
Occupancy by Educational Attainment in Hartland
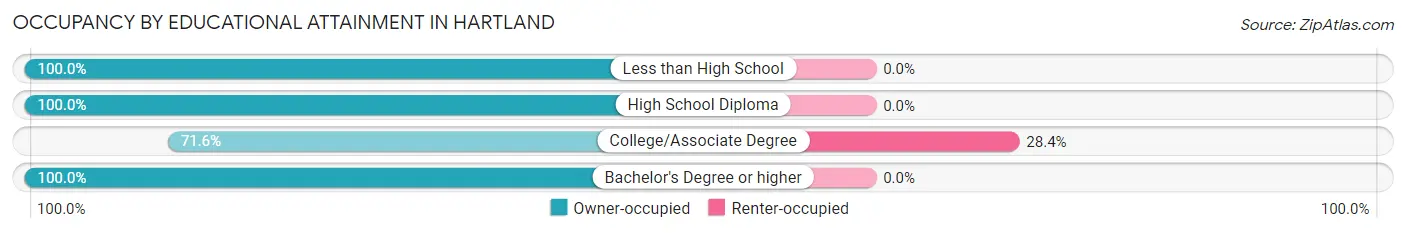
| Household Size | Owner-occupied | Renter-occupied |
| Less than High School | 20 (100.0%) | 0 (0.0%) |
| High School Diploma | 16 (100.0%) | 0 (0.0%) |
| College/Associate Degree | 116 (71.6%) | 46 (28.4%) |
| Bachelor's Degree or higher | 8 (100.0%) | 0 (0.0%) |
Occupancy by Age of Householder in Hartland
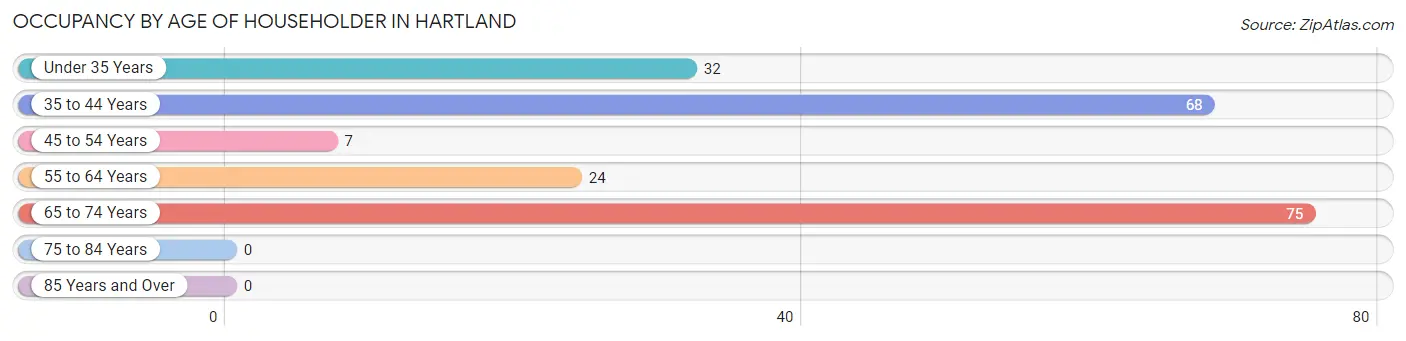
| Age Bracket | # Households | % Households |
| Under 35 Years | 32 | 15.5% |
| 35 to 44 Years | 68 | 33.0% |
| 45 to 54 Years | 7 | 3.4% |
| 55 to 64 Years | 24 | 11.7% |
| 65 to 74 Years | 75 | 36.4% |
| 75 to 84 Years | 0 | 0.0% |
| 85 Years and Over | 0 | 0.0% |
| Total | 206 | 100.0% |
Housing Finances in Hartland
Median Income by Occupancy in Hartland
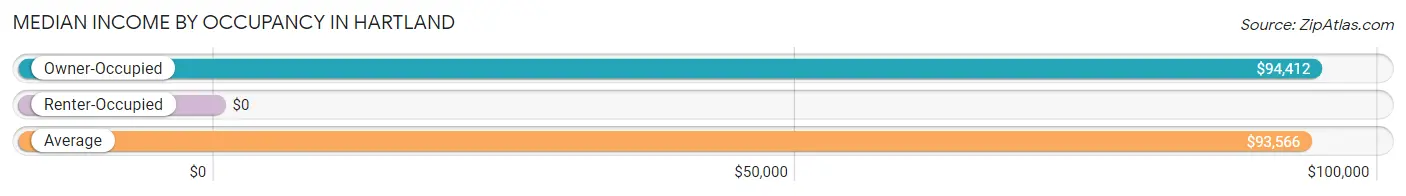
| Occupancy Type | # Households | Median Income |
| Owner-Occupied | 160 (77.7%) | $94,412 |
| Renter-Occupied | 46 (22.3%) | $0 |
| Average | 206 (100.0%) | $93,566 |
Occupancy by Householder Income Bracket in Hartland
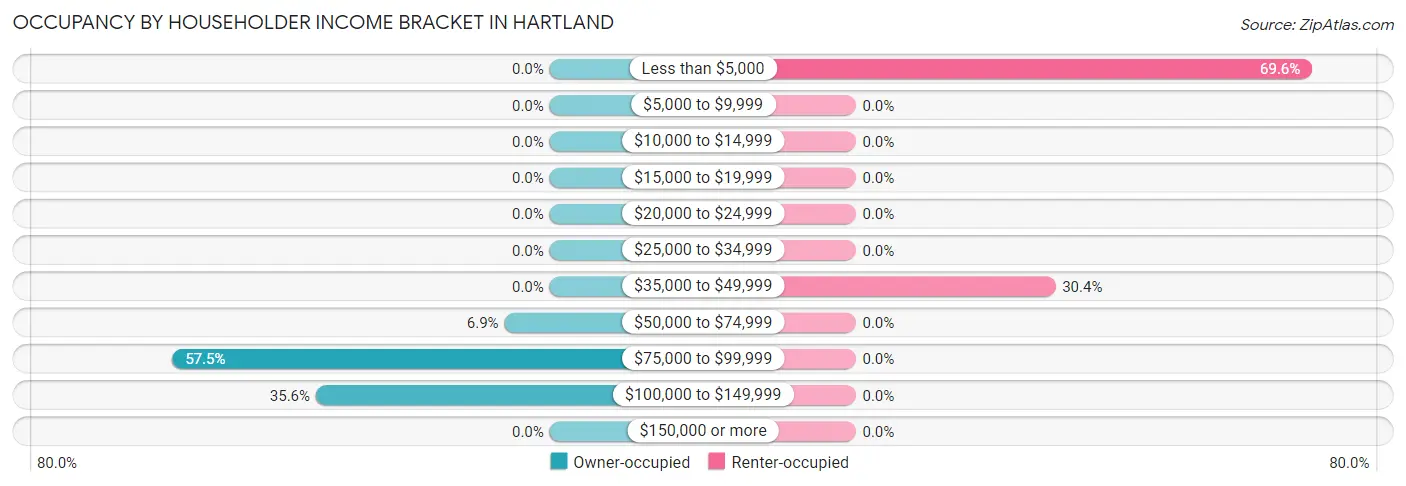
| Income Bracket | Owner-occupied | Renter-occupied |
| Less than $5,000 | 0 (0.0%) | 32 (69.6%) |
| $5,000 to $9,999 | 0 (0.0%) | 0 (0.0%) |
| $10,000 to $14,999 | 0 (0.0%) | 0 (0.0%) |
| $15,000 to $19,999 | 0 (0.0%) | 0 (0.0%) |
| $20,000 to $24,999 | 0 (0.0%) | 0 (0.0%) |
| $25,000 to $34,999 | 0 (0.0%) | 0 (0.0%) |
| $35,000 to $49,999 | 0 (0.0%) | 14 (30.4%) |
| $50,000 to $74,999 | 11 (6.9%) | 0 (0.0%) |
| $75,000 to $99,999 | 92 (57.5%) | 0 (0.0%) |
| $100,000 to $149,999 | 57 (35.6%) | 0 (0.0%) |
| $150,000 or more | 0 (0.0%) | 0 (0.0%) |
| Total | 160 (100.0%) | 46 (100.0%) |
Monthly Housing Cost Tiers in Hartland
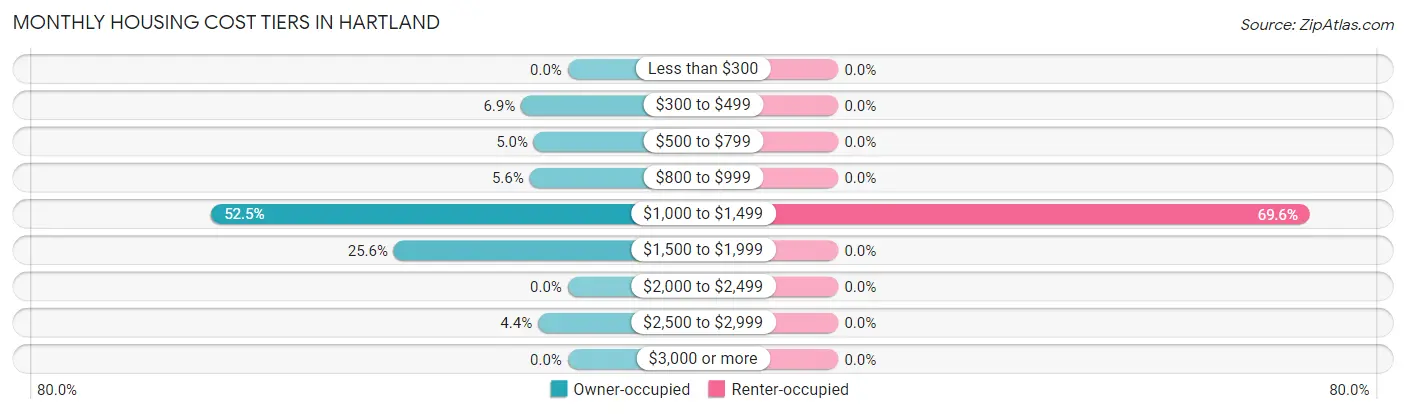
| Monthly Cost | Owner-occupied | Renter-occupied |
| Less than $300 | 0 (0.0%) | 0 (0.0%) |
| $300 to $499 | 11 (6.9%) | 0 (0.0%) |
| $500 to $799 | 8 (5.0%) | 0 (0.0%) |
| $800 to $999 | 9 (5.6%) | 0 (0.0%) |
| $1,000 to $1,499 | 84 (52.5%) | 32 (69.6%) |
| $1,500 to $1,999 | 41 (25.6%) | 0 (0.0%) |
| $2,000 to $2,499 | 0 (0.0%) | 0 (0.0%) |
| $2,500 to $2,999 | 7 (4.4%) | 0 (0.0%) |
| $3,000 or more | 0 (0.0%) | 0 (0.0%) |
| Total | 160 (100.0%) | 46 (100.0%) |
Physical Housing Characteristics in Hartland
Housing Structures in Hartland
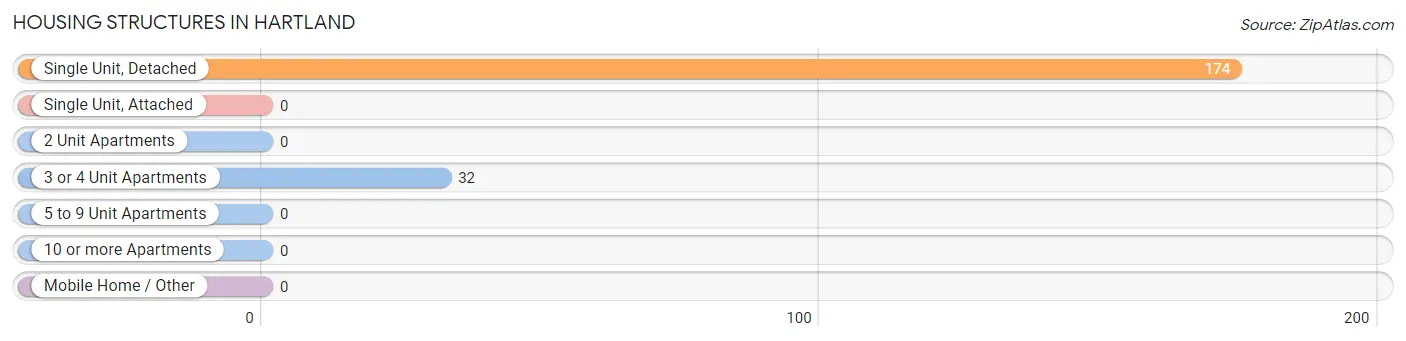
| Structure Type | # Housing Units | % Housing Units |
| Single Unit, Detached | 174 | 84.5% |
| Single Unit, Attached | 0 | 0.0% |
| 2 Unit Apartments | 0 | 0.0% |
| 3 or 4 Unit Apartments | 32 | 15.5% |
| 5 to 9 Unit Apartments | 0 | 0.0% |
| 10 or more Apartments | 0 | 0.0% |
| Mobile Home / Other | 0 | 0.0% |
| Total | 206 | 100.0% |
Housing Structures by Occupancy in Hartland
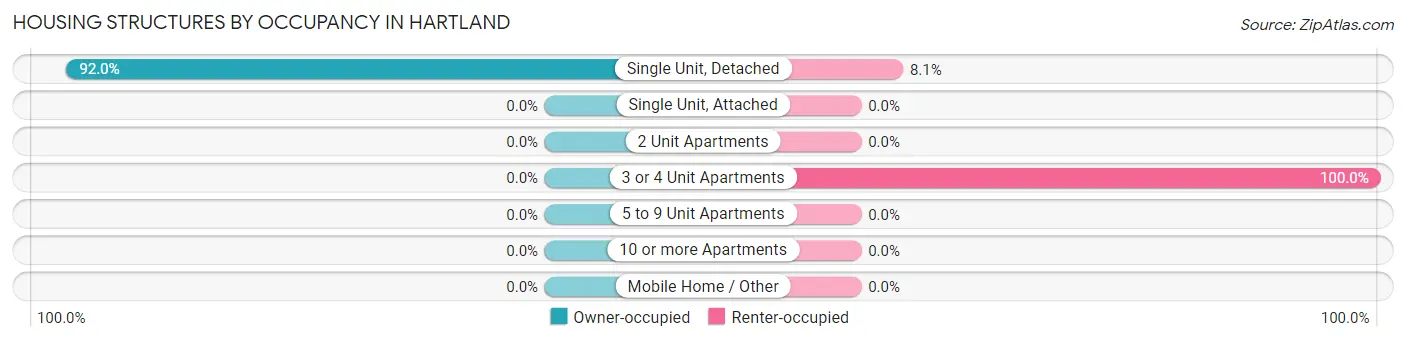
| Structure Type | Owner-occupied | Renter-occupied |
| Single Unit, Detached | 160 (91.9%) | 14 (8.1%) |
| Single Unit, Attached | 0 (0.0%) | 0 (0.0%) |
| 2 Unit Apartments | 0 (0.0%) | 0 (0.0%) |
| 3 or 4 Unit Apartments | 0 (0.0%) | 32 (100.0%) |
| 5 to 9 Unit Apartments | 0 (0.0%) | 0 (0.0%) |
| 10 or more Apartments | 0 (0.0%) | 0 (0.0%) |
| Mobile Home / Other | 0 (0.0%) | 0 (0.0%) |
| Total | 160 (77.7%) | 46 (22.3%) |
Housing Structures by Number of Rooms in Hartland
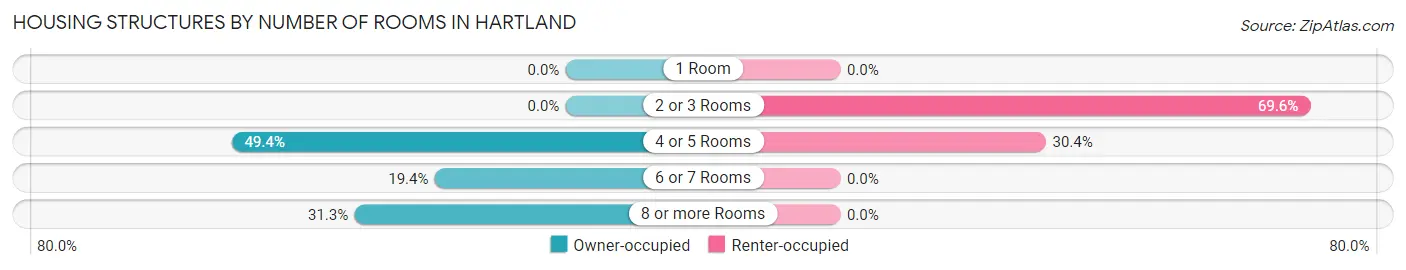
| Number of Rooms | Owner-occupied | Renter-occupied |
| 1 Room | 0 (0.0%) | 0 (0.0%) |
| 2 or 3 Rooms | 0 (0.0%) | 32 (69.6%) |
| 4 or 5 Rooms | 79 (49.4%) | 14 (30.4%) |
| 6 or 7 Rooms | 31 (19.4%) | 0 (0.0%) |
| 8 or more Rooms | 50 (31.2%) | 0 (0.0%) |
| Total | 160 (100.0%) | 46 (100.0%) |
Housing Structure by Heating Type in Hartland
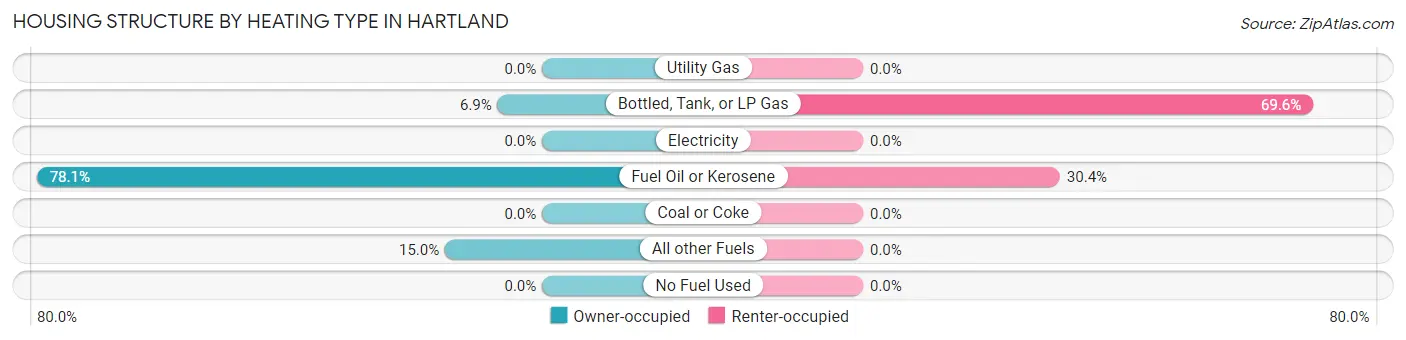
| Heating Type | Owner-occupied | Renter-occupied |
| Utility Gas | 0 (0.0%) | 0 (0.0%) |
| Bottled, Tank, or LP Gas | 11 (6.9%) | 32 (69.6%) |
| Electricity | 0 (0.0%) | 0 (0.0%) |
| Fuel Oil or Kerosene | 125 (78.1%) | 14 (30.4%) |
| Coal or Coke | 0 (0.0%) | 0 (0.0%) |
| All other Fuels | 24 (15.0%) | 0 (0.0%) |
| No Fuel Used | 0 (0.0%) | 0 (0.0%) |
| Total | 160 (100.0%) | 46 (100.0%) |
Household Vehicle Usage in Hartland
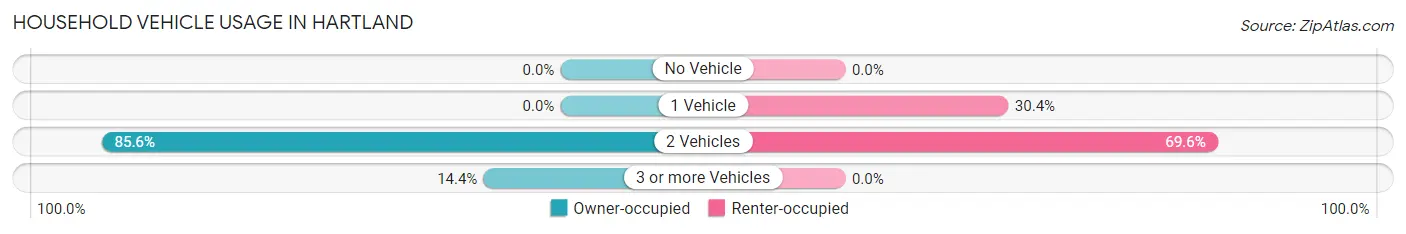
| Vehicles per Household | Owner-occupied | Renter-occupied |
| No Vehicle | 0 (0.0%) | 0 (0.0%) |
| 1 Vehicle | 0 (0.0%) | 14 (30.4%) |
| 2 Vehicles | 137 (85.6%) | 32 (69.6%) |
| 3 or more Vehicles | 23 (14.4%) | 0 (0.0%) |
| Total | 160 (100.0%) | 46 (100.0%) |
Real Estate & Mortgages in Hartland
Real Estate and Mortgage Overview in Hartland
| Characteristic | Without Mortgage | With Mortgage |
| Housing Units | 28 | 132 |
| Median Property Value | - | - |
| Median Household Income | $78,333 | $0 |
| Monthly Housing Costs | $638 | $0 |
| Real Estate Taxes | $5,441 | $0 |
Property Value by Mortgage Status in Hartland
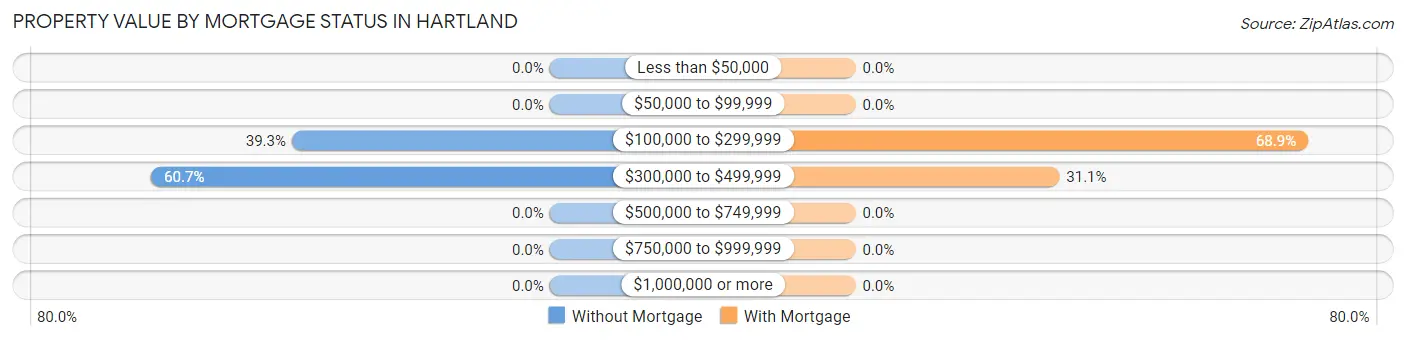
| Property Value | Without Mortgage | With Mortgage |
| Less than $50,000 | 0 (0.0%) | 0 (0.0%) |
| $50,000 to $99,999 | 0 (0.0%) | 0 (0.0%) |
| $100,000 to $299,999 | 11 (39.3%) | 91 (68.9%) |
| $300,000 to $499,999 | 17 (60.7%) | 41 (31.1%) |
| $500,000 to $749,999 | 0 (0.0%) | 0 (0.0%) |
| $750,000 to $999,999 | 0 (0.0%) | 0 (0.0%) |
| $1,000,000 or more | 0 (0.0%) | 0 (0.0%) |
| Total | 28 (100.0%) | 132 (100.0%) |
Household Income by Mortgage Status in Hartland
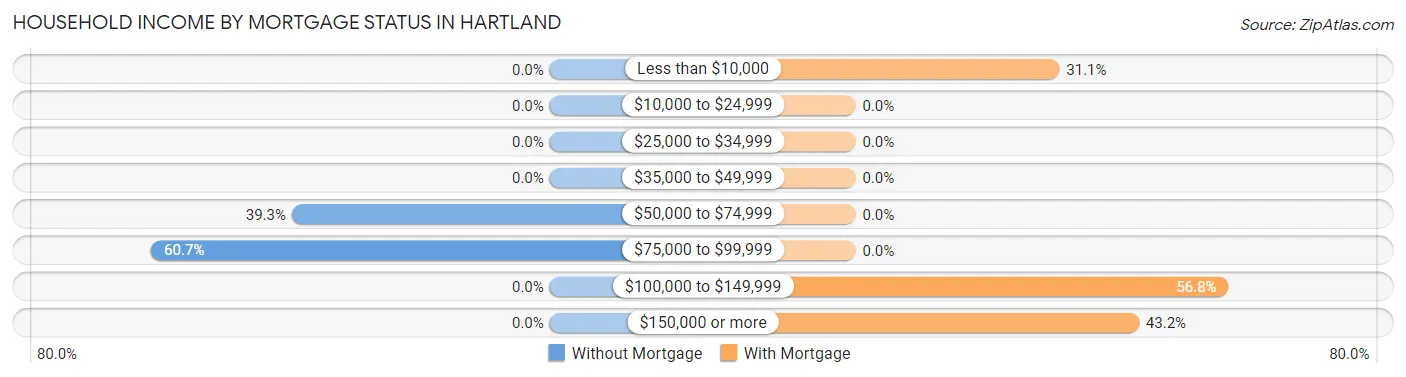
| Household Income | Without Mortgage | With Mortgage |
| Less than $10,000 | 0 (0.0%) | 41 (31.1%) |
| $10,000 to $24,999 | 0 (0.0%) | 0 (0.0%) |
| $25,000 to $34,999 | 0 (0.0%) | 0 (0.0%) |
| $35,000 to $49,999 | 0 (0.0%) | 0 (0.0%) |
| $50,000 to $74,999 | 11 (39.3%) | 0 (0.0%) |
| $75,000 to $99,999 | 17 (60.7%) | 0 (0.0%) |
| $100,000 to $149,999 | 0 (0.0%) | 75 (56.8%) |
| $150,000 or more | 0 (0.0%) | 57 (43.2%) |
| Total | 28 (100.0%) | 132 (100.0%) |
Property Value to Household Income Ratio in Hartland
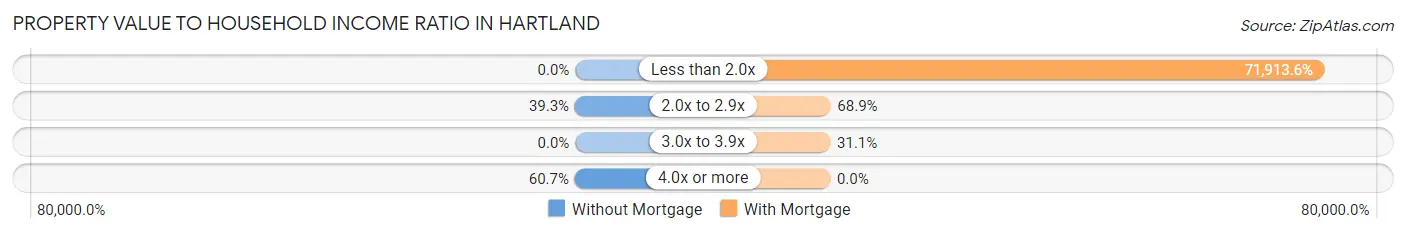
| Value-to-Income Ratio | Without Mortgage | With Mortgage |
| Less than 2.0x | 0 (0.0%) | 94,926 (71,913.6%) |
| 2.0x to 2.9x | 11 (39.3%) | 91 (68.9%) |
| 3.0x to 3.9x | 0 (0.0%) | 41 (31.1%) |
| 4.0x or more | 17 (60.7%) | 0 (0.0%) |
| Total | 28 (100.0%) | 132 (100.0%) |
Real Estate Taxes by Mortgage Status in Hartland
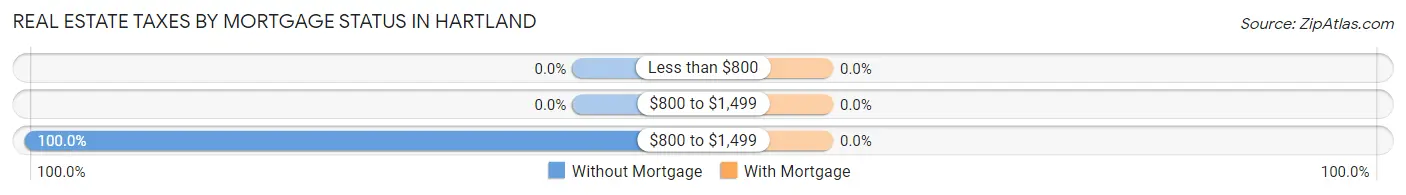
| Property Taxes | Without Mortgage | With Mortgage |
| Less than $800 | 0 (0.0%) | 0 (0.0%) |
| $800 to $1,499 | 0 (0.0%) | 0 (0.0%) |
| $800 to $1,499 | 28 (100.0%) | 0 (0.0%) |
| Total | 28 (100.0%) | 132 (100.0%) |
Health & Disability in Hartland
Health Insurance Coverage by Age in Hartland
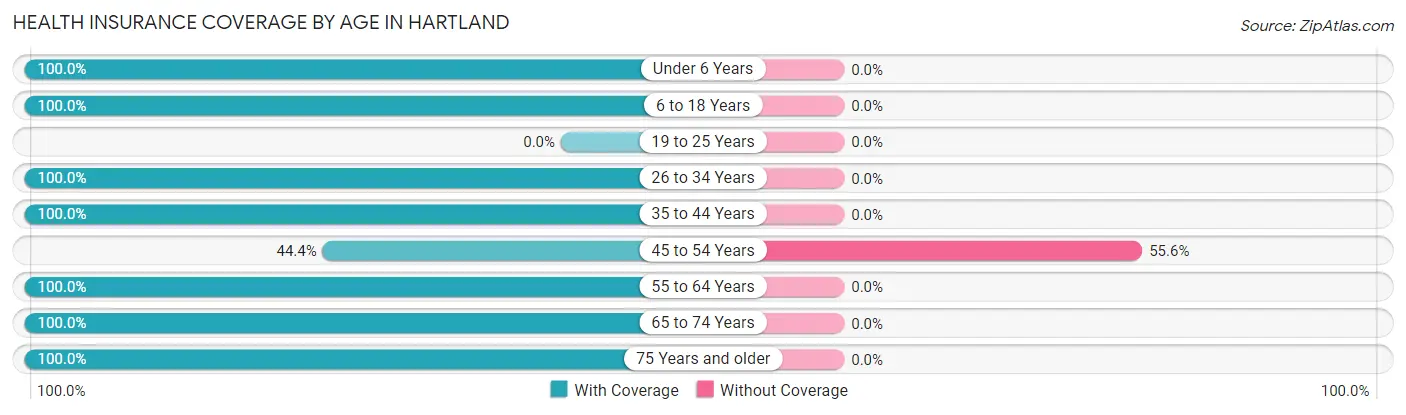
| Age Bracket | With Coverage | Without Coverage |
| Under 6 Years | 7 (100.0%) | 0 (0.0%) |
| 6 to 18 Years | 142 (100.0%) | 0 (0.0%) |
| 19 to 25 Years | 0 (0.0%) | 0 (0.0%) |
| 26 to 34 Years | 89 (100.0%) | 0 (0.0%) |
| 35 to 44 Years | 174 (100.0%) | 0 (0.0%) |
| 45 to 54 Years | 8 (44.4%) | 10 (55.6%) |
| 55 to 64 Years | 32 (100.0%) | 0 (0.0%) |
| 65 to 74 Years | 149 (100.0%) | 0 (0.0%) |
| 75 Years and older | 14 (100.0%) | 0 (0.0%) |
| Total | 615 (98.4%) | 10 (1.6%) |
Health Insurance Coverage by Citizenship Status in Hartland
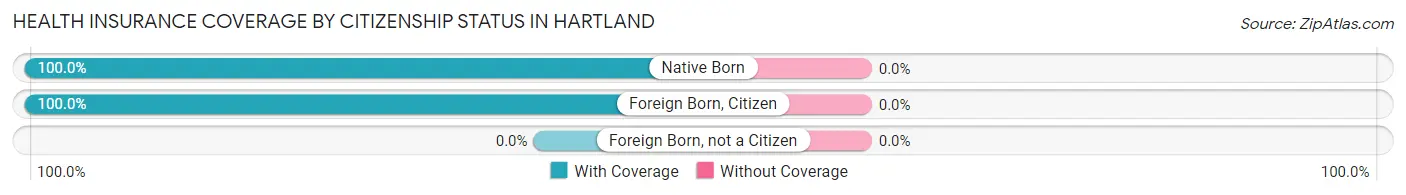
| Citizenship Status | With Coverage | Without Coverage |
| Native Born | 7 (100.0%) | 0 (0.0%) |
| Foreign Born, Citizen | 142 (100.0%) | 0 (0.0%) |
| Foreign Born, not a Citizen | 0 (0.0%) | 0 (0.0%) |
Health Insurance Coverage by Household Income in Hartland
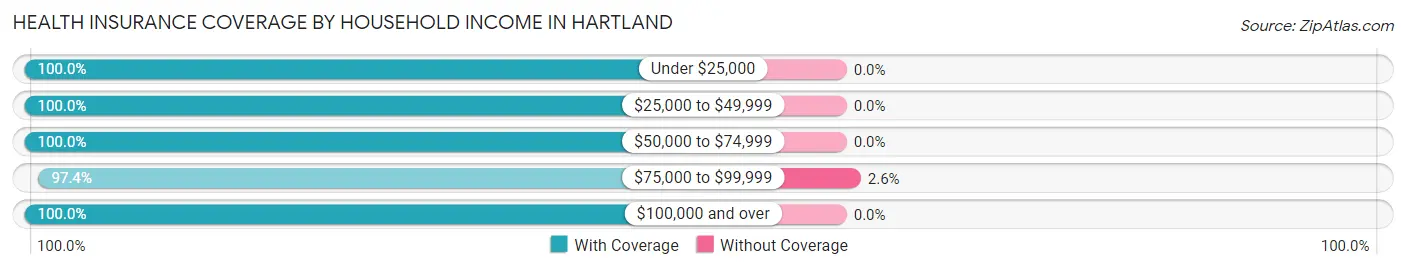
| Household Income | With Coverage | Without Coverage |
| Under $25,000 | 89 (100.0%) | 0 (0.0%) |
| $25,000 to $49,999 | 28 (100.0%) | 0 (0.0%) |
| $50,000 to $74,999 | 22 (100.0%) | 0 (0.0%) |
| $75,000 to $99,999 | 370 (97.4%) | 10 (2.6%) |
| $100,000 and over | 106 (100.0%) | 0 (0.0%) |
Public vs Private Health Insurance Coverage by Age in Hartland
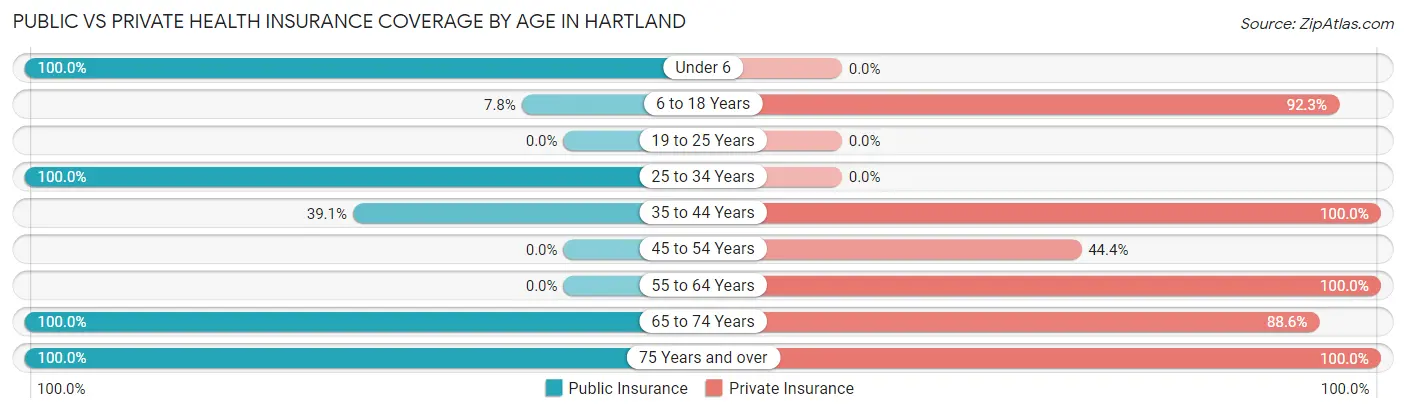
| Age Bracket | Public Insurance | Private Insurance |
| Under 6 | 7 (100.0%) | 0 (0.0%) |
| 6 to 18 Years | 11 (7.7%) | 131 (92.2%) |
| 19 to 25 Years | 0 (0.0%) | 0 (0.0%) |
| 25 to 34 Years | 89 (100.0%) | 0 (0.0%) |
| 35 to 44 Years | 68 (39.1%) | 174 (100.0%) |
| 45 to 54 Years | 0 (0.0%) | 8 (44.4%) |
| 55 to 64 Years | 0 (0.0%) | 32 (100.0%) |
| 65 to 74 Years | 149 (100.0%) | 132 (88.6%) |
| 75 Years and over | 14 (100.0%) | 14 (100.0%) |
| Total | 338 (54.1%) | 491 (78.6%) |
Disability Status by Sex by Age in Hartland
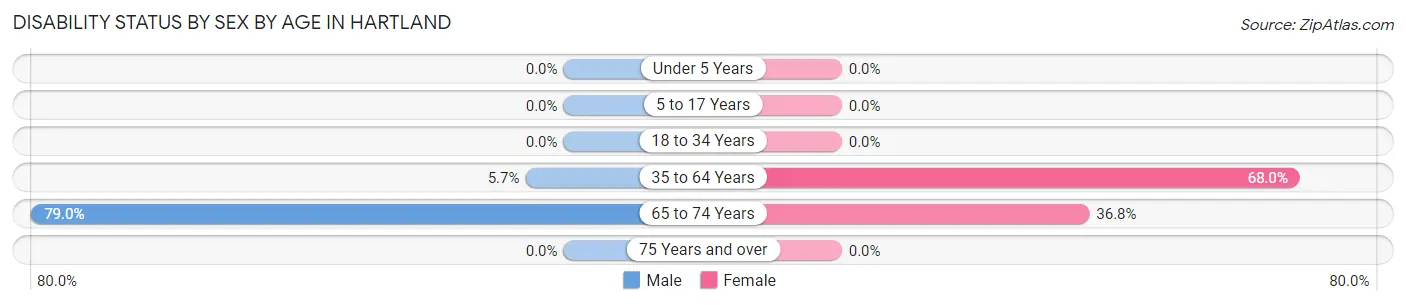
| Age Bracket | Male | Female |
| Under 5 Years | 0 (0.0%) | 0 (0.0%) |
| 5 to 17 Years | 0 (0.0%) | 0 (0.0%) |
| 18 to 34 Years | 0 (0.0%) | 0 (0.0%) |
| 35 to 64 Years | 7 (5.7%) | 68 (68.0%) |
| 65 to 74 Years | 64 (79.0%) | 25 (36.8%) |
| 75 Years and over | 0 (0.0%) | 0 (0.0%) |
Disability Class by Sex by Age in Hartland
Disability Class: Hearing Difficulty
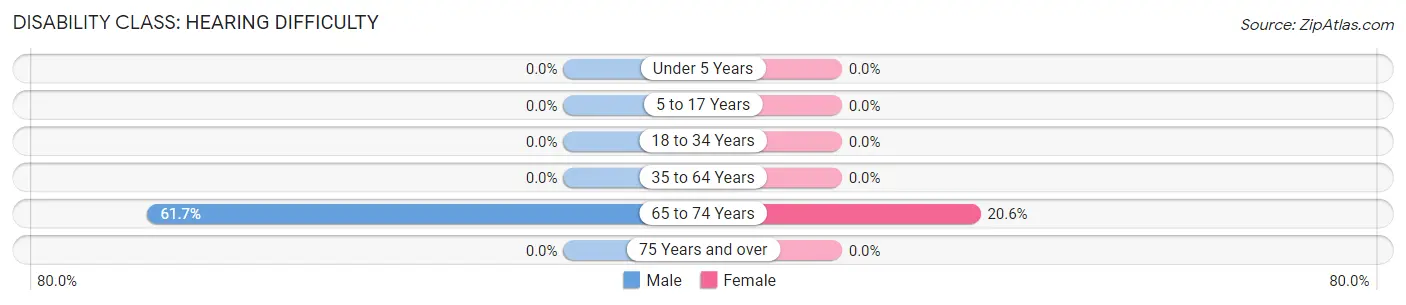
| Age Bracket | Male | Female |
| Under 5 Years | 0 (0.0%) | 0 (0.0%) |
| 5 to 17 Years | 0 (0.0%) | 0 (0.0%) |
| 18 to 34 Years | 0 (0.0%) | 0 (0.0%) |
| 35 to 64 Years | 0 (0.0%) | 0 (0.0%) |
| 65 to 74 Years | 50 (61.7%) | 14 (20.6%) |
| 75 Years and over | 0 (0.0%) | 0 (0.0%) |
Disability Class: Vision Difficulty
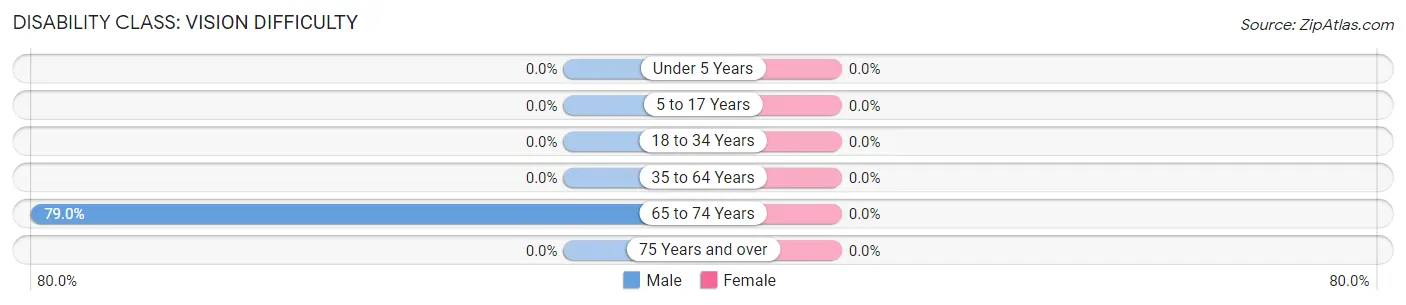
| Age Bracket | Male | Female |
| Under 5 Years | 0 (0.0%) | 0 (0.0%) |
| 5 to 17 Years | 0 (0.0%) | 0 (0.0%) |
| 18 to 34 Years | 0 (0.0%) | 0 (0.0%) |
| 35 to 64 Years | 0 (0.0%) | 0 (0.0%) |
| 65 to 74 Years | 64 (79.0%) | 0 (0.0%) |
| 75 Years and over | 0 (0.0%) | 0 (0.0%) |
Disability Class: Cognitive Difficulty
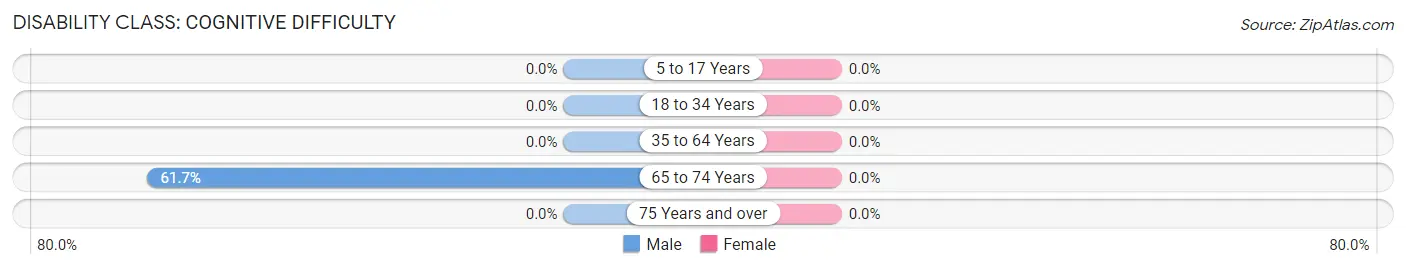
| Age Bracket | Male | Female |
| 5 to 17 Years | 0 (0.0%) | 0 (0.0%) |
| 18 to 34 Years | 0 (0.0%) | 0 (0.0%) |
| 35 to 64 Years | 0 (0.0%) | 0 (0.0%) |
| 65 to 74 Years | 50 (61.7%) | 0 (0.0%) |
| 75 Years and over | 0 (0.0%) | 0 (0.0%) |
Disability Class: Ambulatory Difficulty
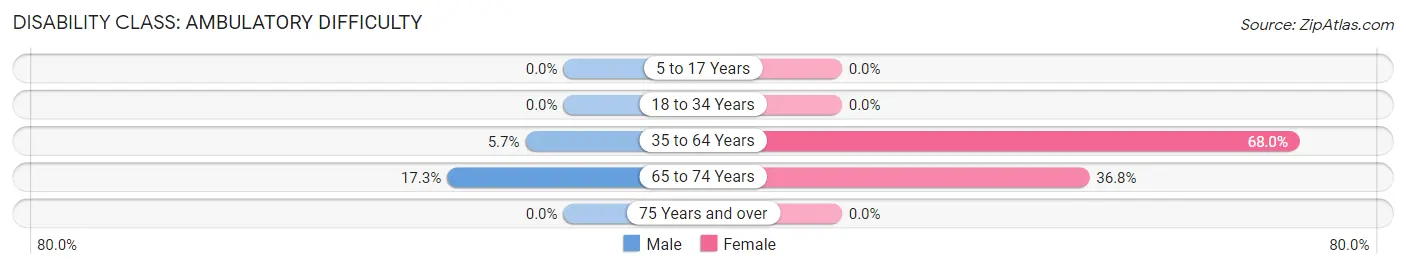
| Age Bracket | Male | Female |
| 5 to 17 Years | 0 (0.0%) | 0 (0.0%) |
| 18 to 34 Years | 0 (0.0%) | 0 (0.0%) |
| 35 to 64 Years | 7 (5.7%) | 68 (68.0%) |
| 65 to 74 Years | 14 (17.3%) | 25 (36.8%) |
| 75 Years and over | 0 (0.0%) | 0 (0.0%) |
Disability Class: Self-Care Difficulty
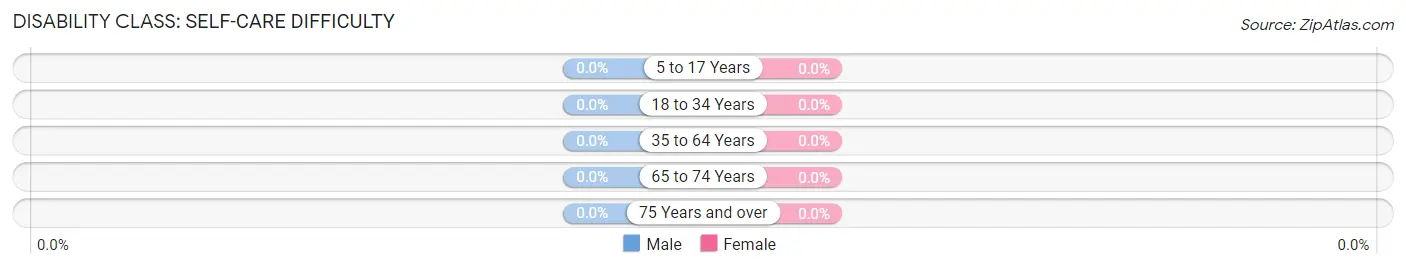
| Age Bracket | Male | Female |
| 5 to 17 Years | 0 (0.0%) | 0 (0.0%) |
| 18 to 34 Years | 0 (0.0%) | 0 (0.0%) |
| 35 to 64 Years | 0 (0.0%) | 0 (0.0%) |
| 65 to 74 Years | 0 (0.0%) | 0 (0.0%) |
| 75 Years and over | 0 (0.0%) | 0 (0.0%) |
Technology Access in Hartland
Computing Device Access in Hartland
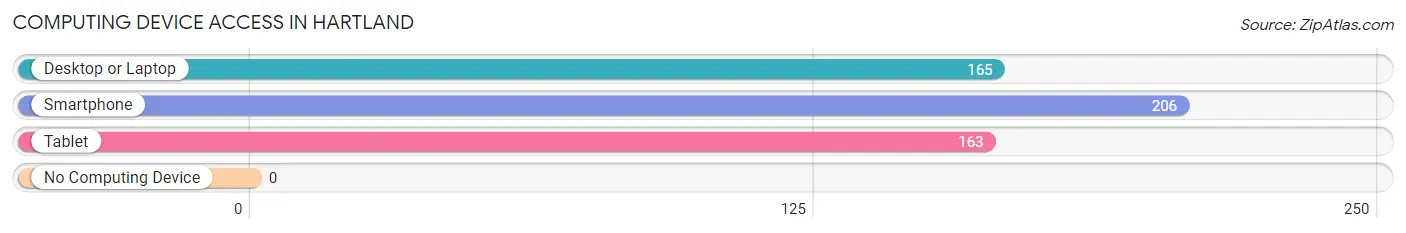
| Device Type | # Households | % Households |
| Desktop or Laptop | 165 | 80.1% |
| Smartphone | 206 | 100.0% |
| Tablet | 163 | 79.1% |
| No Computing Device | 0 | 0.0% |
| Total | 206 | 100.0% |
Internet Access in Hartland
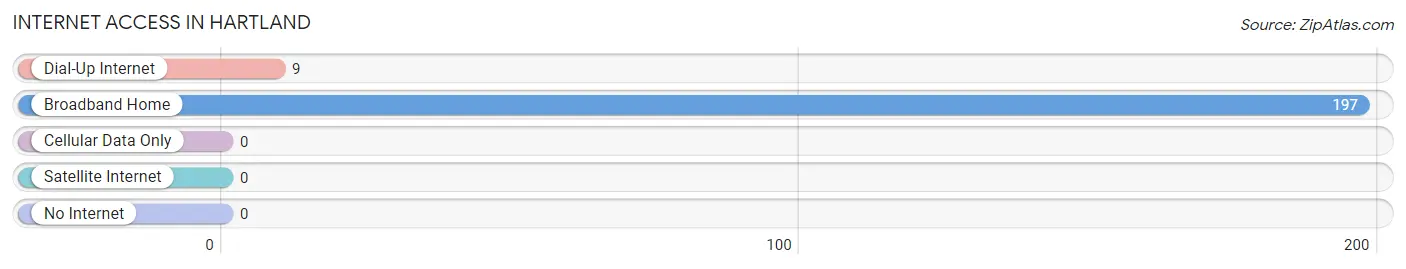
| Internet Type | # Households | % Households |
| Dial-Up Internet | 9 | 4.4% |
| Broadband Home | 197 | 95.6% |
| Cellular Data Only | 0 | 0.0% |
| Satellite Internet | 0 | 0.0% |
| No Internet | 0 | 0.0% |
| Total | 206 | 100.0% |
Hartland Summary
Hartland, Vermont is a small town located in Windsor County in the southeastern part of the state. It is situated on the banks of the White River, which flows through the town and is a major source of recreation and economic activity. The town has a population of approximately 1,400 people and covers an area of about 10 square miles.
Hartland was first settled in 1761 by a group of settlers from Connecticut. The town was named after Hartland, Connecticut, the hometown of the settlers. The town was incorporated in 1781 and has remained relatively unchanged since then.
Geographically, Hartland is located in the Connecticut River Valley, which is known for its rolling hills and lush forests. The town is surrounded by the Green Mountains to the east and the White Mountains to the west. The White River runs through the town and is a major source of recreation and economic activity.
The economy of Hartland is largely based on agriculture and tourism. The town is home to several farms, which produce a variety of crops, including corn, hay, and apples. The town also has several small businesses, including a general store, a hardware store, and a few restaurants. Tourism is also an important part of the local economy, as the town is home to several popular attractions, including the Quechee Gorge, the Quechee State Park, and the Quechee Hot Air Balloon Festival.
Demographically, Hartland is a predominantly white town, with a population that is 97.3% white. The median household income is $50,000, and the median age is 44. The town has a low unemployment rate of 3.2%, and the poverty rate is 8.3%.
Hartland is a small town with a rich history and a vibrant economy. It is a great place to live, work, and play, and it is a great place to raise a family. The town is home to a variety of attractions, and it is a great place to explore the outdoors. Hartland is a great place to call home.
Common Questions
What is Per Capita Income in Hartland?
Per Capita income in Hartland is $29,203.
What is the Median Family Income in Hartland?
Median Family Income in Hartland is $94,154.
What is the Median Household income in Hartland?
Median Household Income in Hartland is $93,566.
What is Inequality or Gini Index in Hartland?
Inequality or Gini Index in Hartland is 0.30.
What is the Total Population of Hartland?
Total Population of Hartland is 625.
What is the Total Male Population of Hartland?
Total Male Population of Hartland is 382.
What is the Total Female Population of Hartland?
Total Female Population of Hartland is 243.
What is the Ratio of Males per 100 Females in Hartland?
There are 157.20 Males per 100 Females in Hartland.
What is the Ratio of Females per 100 Males in Hartland?
There are 63.61 Females per 100 Males in Hartland.
What is the Median Population Age in Hartland?
Median Population Age in Hartland is 37.6 Years.
What is the Average Family Size in Hartland
Average Family Size in Hartland is 3.1 People.
What is the Average Household Size in Hartland
Average Household Size in Hartland is 3.0 People.
How Large is the Labor Force in Hartland?
There are 282 People in the Labor Forcein in Hartland.
What is the Percentage of People in the Labor Force in Hartland?
57.9% of People are in the Labor Force in Hartland.
What is the Unemployment Rate in Hartland?
Unemployment Rate in Hartland is 6.4%.