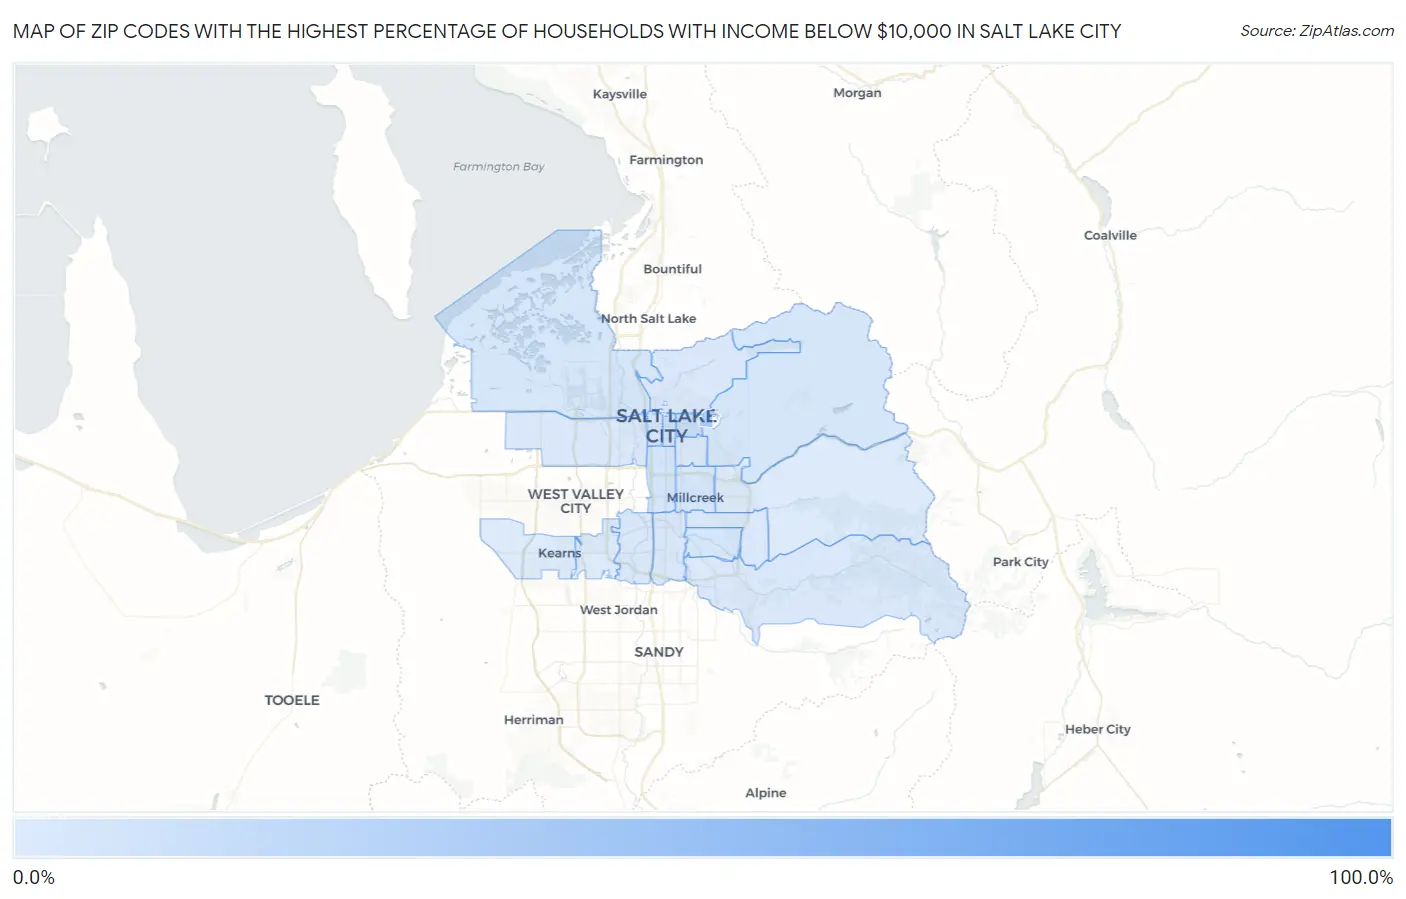
Zip Codes with the Highest Percentage of Households with Income Below $10,000 in Salt Lake City, UT
RELATED REPORTS & OPTIONS
Household Income | $0-10k
Salt Lake City
Compare Zip Codes
Map of Zip Codes with the Highest Percentage of Households with Income Below $10,000 in Salt Lake City
1.6%
100.0%
Zip Codes with the Highest Percentage of Households with Income Below $10,000 in Salt Lake City, UT
| Zip Code | Households with Income < $10k | vs State | vs National | |
| 1. | 84150 | 100.0% | 3.1%(+96.9)#1 | 4.9%(+95.1)#33 |
| 2. | 84112 | 25.6% | 3.1%(+22.5)#5 | 4.9%(+20.7)#458 |
| 3. | 84102 | 10.8% | 3.1%(+7.70)#16 | 4.9%(+5.90)#3,064 |
| 4. | 84111 | 7.4% | 3.1%(+4.30)#33 | 4.9%(+2.50)#6,378 |
| 5. | 84115 | 5.9% | 3.1%(+2.80)#51 | 4.9%(+1.00)#9,228 |
| 6. | 84116 | 5.2% | 3.1%(+2.10)#61 | 4.9%(+0.300)#11,051 |
| 7. | 84108 | 4.6% | 3.1%(+1.50)#69 | 4.9%(-0.300)#13,051 |
| 8. | 84106 | 4.4% | 3.1%(+1.30)#71 | 4.9%(-0.500)#13,694 |
| 9. | 84117 | 4.3% | 3.1%(+1.20)#74 | 4.9%(-0.600)#14,101 |
| 10. | 84101 | 4.3% | 3.1%(+1.20)#76 | 4.9%(-0.600)#14,211 |
| 11. | 84107 | 4.0% | 3.1%(+0.900)#82 | 4.9%(-0.900)#15,231 |
| 12. | 84123 | 3.5% | 3.1%(+0.400)#94 | 4.9%(-1.40)#17,215 |
| 13. | 84121 | 3.0% | 3.1%(-0.100)#109 | 4.9%(-1.90)#19,322 |
| 14. | 84104 | 3.0% | 3.1%(-0.100)#110 | 4.9%(-1.90)#19,386 |
| 15. | 84103 | 2.3% | 3.1%(-0.800)#137 | 4.9%(-2.60)#22,471 |
| 16. | 84124 | 2.3% | 3.1%(-0.800)#138 | 4.9%(-2.60)#22,473 |
| 17. | 84105 | 2.3% | 3.1%(-0.800)#139 | 4.9%(-2.60)#22,474 |
| 18. | 84129 | 2.1% | 3.1%(-1.000)#149 | 4.9%(-2.80)#23,226 |
| 19. | 84109 | 1.7% | 3.1%(-1.40)#172 | 4.9%(-3.20)#24,721 |
| 20. | 84118 | 1.6% | 3.1%(-1.50)#179 | 4.9%(-3.30)#25,071 |
1
Common Questions
What are the Top 10 Zip Codes with the Highest Percentage of Households with Income Below $10,000 in Salt Lake City, UT?
Top 10 Zip Codes with the Highest Percentage of Households with Income Below $10,000 in Salt Lake City, UT are:
What zip code has the Highest Percentage of Households with Income Below $10,000 in Salt Lake City, UT?
84150 has the Highest Percentage of Households with Income Below $10,000 in Salt Lake City, UT with 100.0%.
What is the Percentage of Households with Income Below $10,000 in Salt Lake City, UT?
Percentage of Households with Income Below $10,000 in Salt Lake City is 4.8%.
What is the Percentage of Households with Income Below $10,000 in Utah?
Percentage of Households with Income Below $10,000 in Utah is 3.1%.
What is the Percentage of Households with Income Below $10,000 in the United States?
Percentage of Households with Income Below $10,000 in the United States is 4.9%.