Zip Codes with the Highest Percentage of Population Employed in Architecture & Engineering in Salt Lake City, UT
RELATED REPORTS & OPTIONS
Architecture & Engineering
Salt Lake City
Compare Zip Codes
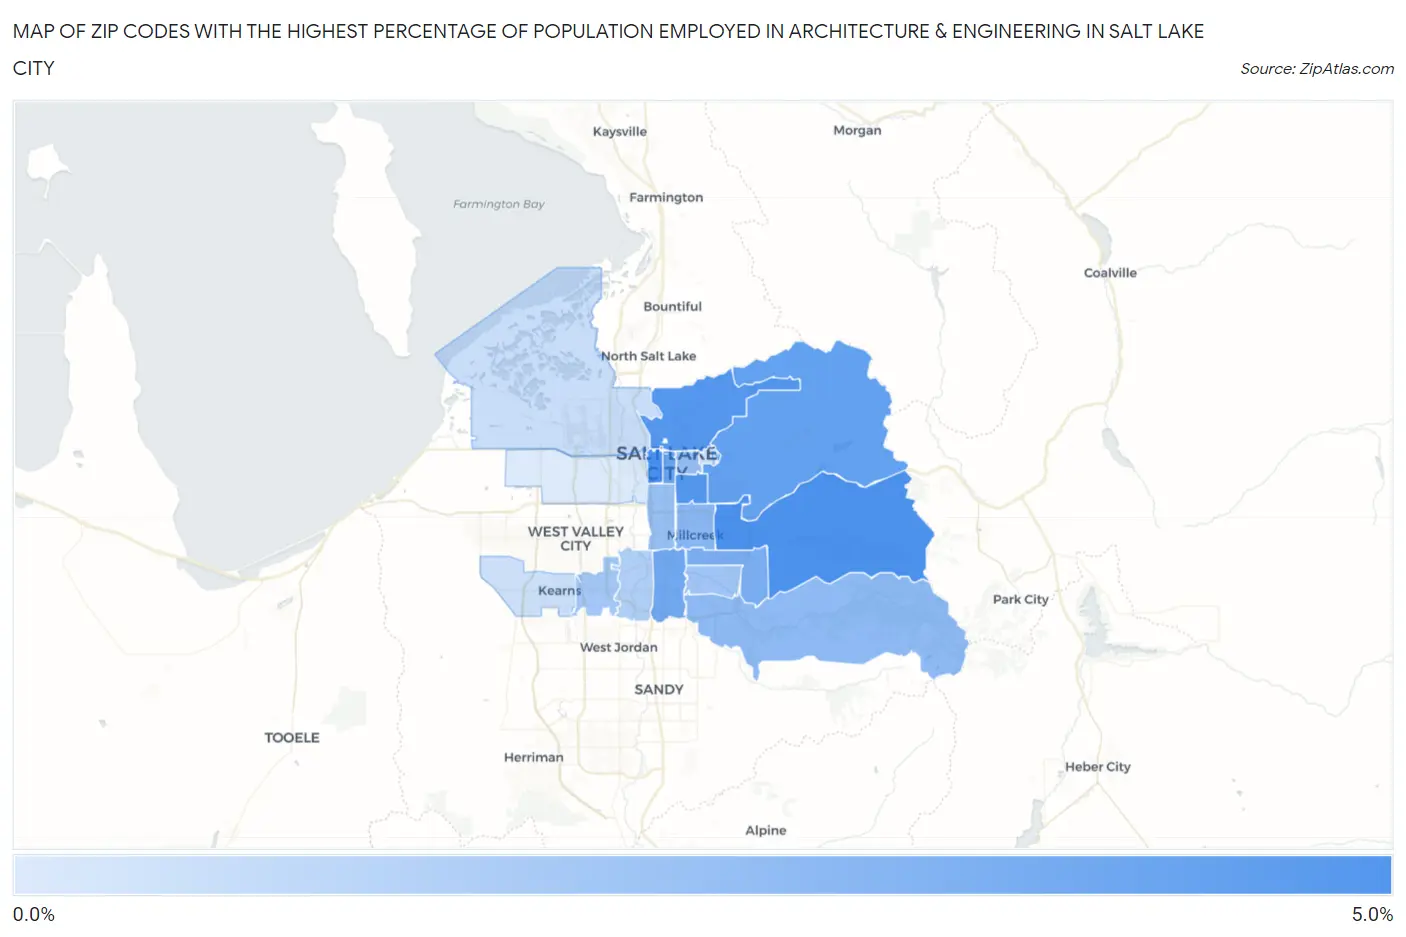
Map of Zip Codes with the Highest Percentage of Population Employed in Architecture & Engineering in Salt Lake City
0.37%
4.2%
Zip Codes with the Highest Percentage of Population Employed in Architecture & Engineering in Salt Lake City, UT
| Zip Code | % Employed | vs State | vs National | |
| 1. | 84101 | 4.2% | 2.2%(+1.99)#19 | 2.1%(+2.00)#2,557 |
| 2. | 84109 | 4.0% | 2.2%(+1.87)#21 | 2.1%(+1.87)#2,732 |
| 3. | 84105 | 3.8% | 2.2%(+1.66)#28 | 2.1%(+1.67)#3,061 |
| 4. | 84103 | 3.8% | 2.2%(+1.65)#29 | 2.1%(+1.66)#3,067 |
| 5. | 84108 | 3.5% | 2.2%(+1.31)#38 | 2.1%(+1.32)#3,820 |
| 6. | 84111 | 3.3% | 2.2%(+1.11)#44 | 2.1%(+1.12)#4,267 |
| 7. | 84107 | 3.1% | 2.2%(+0.932)#53 | 2.1%(+0.940)#4,768 |
| 8. | 84124 | 2.8% | 2.2%(+0.673)#57 | 2.1%(+0.682)#5,657 |
| 9. | 84106 | 2.5% | 2.2%(+0.304)#75 | 2.1%(+0.313)#7,168 |
| 10. | 84121 | 2.4% | 2.2%(+0.196)#84 | 2.1%(+0.205)#7,701 |
| 11. | 84102 | 2.1% | 2.2%(-0.025)#95 | 2.1%(-0.016)#8,846 |
| 12. | 84115 | 2.1% | 2.2%(-0.070)#98 | 2.1%(-0.061)#9,119 |
| 13. | 84117 | 1.9% | 2.2%(-0.270)#110 | 2.1%(-0.261)#10,320 |
| 14. | 84129 | 1.8% | 2.2%(-0.339)#112 | 2.1%(-0.330)#10,718 |
| 15. | 84123 | 1.5% | 2.2%(-0.683)#138 | 2.1%(-0.674)#13,057 |
| 16. | 84116 | 0.89% | 2.2%(-1.27)#165 | 2.1%(-1.26)#17,444 |
| 17. | 84118 | 0.77% | 2.2%(-1.38)#169 | 2.1%(-1.38)#18,332 |
| 18. | 84112 | 0.71% | 2.2%(-1.45)#174 | 2.1%(-1.44)#18,831 |
| 19. | 84104 | 0.37% | 2.2%(-1.79)#183 | 2.1%(-1.78)#21,188 |
1
Common Questions
What are the Top 10 Zip Codes with the Highest Percentage of Population Employed in Architecture & Engineering in Salt Lake City, UT?
Top 10 Zip Codes with the Highest Percentage of Population Employed in Architecture & Engineering in Salt Lake City, UT are:
What zip code has the Highest Percentage of Population Employed in Architecture & Engineering in Salt Lake City, UT?
84101 has the Highest Percentage of Population Employed in Architecture & Engineering in Salt Lake City, UT with 4.2%.
What is the Percentage of Population Employed in Architecture & Engineering in Salt Lake City, UT?
Percentage of Population Employed in Architecture & Engineering in Salt Lake City is 2.6%.
What is the Percentage of Population Employed in Architecture & Engineering in Utah?
Percentage of Population Employed in Architecture & Engineering in Utah is 2.2%.
What is the Percentage of Population Employed in Architecture & Engineering in the United States?
Percentage of Population Employed in Architecture & Engineering in the United States is 2.1%.