Zip Codes with the Lowest Percentage of Owner-Occupied Units in Salt Lake City, UT

RELATED REPORTS & OPTIONS

Lowest Owner-Occupied
Population
Families and Households
Female Fertility
Female Fertility (Unmarried)
Race (Community Size)
Race (Percentage)
Ancestry (Community Size)
AfghanAfricanAlbanianAmericanApacheArabArapahoArgentineanArmenianAssyrian / Chaldean / SyriacAustralianAustrianBangladeshiBasqueBelgianBhutaneseBlackfeetBolivianBrazilianBritishBulgarianBurmeseCajunCambodianCanadianCelticCentral AmericanCentral American IndianCherokeeCheyenneChileanChippewaChoctawColombianComancheCosta RicanCreeCroatianCubanCzechCzechoslovakianDanishDominicanDutchEastern EuropeanEcuadorianEgyptianEnglishEstonianEthiopianEuropeanFijianFilipinoFinnishFrenchFrench American IndianFrench CanadianGermanGhanaianGreekGuamanian / ChamorroGuatemalanHaitianHonduranHopiHungarianIcelanderIndian (Asian)IndonesianIranianIraqiIrishIroquoisIsraeliItalianJamaicanJapaneseJordanianKenyanKoreanLaotianLatvianLebaneseLiberianLithuanianLuxembourgerMacedonianMalaysianMalteseMexicanMexican American IndianMongolianMoroccanNative HawaiianNavajoNew ZealanderNicaraguanNigerianNorthern EuropeanNorwegianPaiutePakistaniPalestinianPanamanianPeruvianPolishPortuguesePotawatomiPuebloPuerto RicanRomanianRussianSalvadoranSamoanScandinavianScotch-IrishScottishSerbianShoshoneSiouxSlavicSlovakSloveneSomaliSouth AfricanSouth AmericanSouth American IndianSpaniardSpanishSpanish AmericanSpanish American IndianSri LankanSubsaharan AfricanSudaneseSwedishSwissSyrianThaiTlingit-HaidaTonganTrinidadian and TobagonianTurkishUgandanUkrainianUruguayanUteVenezuelanVietnameseWelshWest IndianYaquiYugoslavianZimbabwean
Ancestry (Percentage)
AfghanAfricanAlbanianAmericanApacheArabArapahoArgentineanArmenianAssyrian / Chaldean / SyriacAustralianAustrianBangladeshiBasqueBelgianBhutaneseBlackfeetBolivianBrazilianBritishBulgarianBurmeseCajunCambodianCanadianCelticCentral AmericanCentral American IndianCherokeeCheyenneChileanChippewaChoctawColombianComancheCosta RicanCreeCroatianCubanCzechCzechoslovakianDanishDominicanDutchEastern EuropeanEcuadorianEgyptianEnglishEstonianEthiopianEuropeanFijianFilipinoFinnishFrenchFrench American IndianFrench CanadianGermanGhanaianGreekGuamanian / ChamorroGuatemalanHaitianHonduranHopiHungarianIcelanderIndian (Asian)IndonesianIranianIraqiIrishIroquoisIsraeliItalianJamaicanJapaneseJordanianKenyanKoreanLaotianLatvianLebaneseLiberianLithuanianLuxembourgerMacedonianMalaysianMalteseMexicanMexican American IndianMongolianMoroccanNative HawaiianNavajoNew ZealanderNicaraguanNigerianNorthern EuropeanNorwegianPaiutePakistaniPalestinianPanamanianPeruvianPolishPortuguesePotawatomiPuebloPuerto RicanRomanianRussianSalvadoranSamoanScandinavianScotch-IrishScottishSerbianShoshoneSiouxSlavicSlovakSloveneSomaliSouth AfricanSouth AmericanSouth American IndianSpaniardSpanishSpanish AmericanSpanish American IndianSri LankanSubsaharan AfricanSudaneseSwedishSwissSyrianThaiTlingit-HaidaTonganTrinidadian and TobagonianTurkishUgandanUkrainianUruguayanUteVenezuelanVietnameseWelshWest IndianYaquiYugoslavianZimbabwean
Immigrant Origin (Total)
AfghanistanAfricaArgentinaArmeniaAsiaAustraliaAustriaBangladeshBelarusBelgiumBoliviaBosnia and HerzegovinaBrazilBulgariaBurma / MyanmarCambodiaCanadaCaribbeanCentral AmericaChileChinaColombiaCongoCosta RicaCroatiaCubaCzechoslovakiaDenmarkDominican RepublicEastern AfricaEastern AsiaEastern EuropeEcuadorEgyptEl SalvadorEnglandEthiopiaEuropeFijiFranceGermanyGhanaGreeceGuatemalaHaitiHondurasHong KongHungaryIndiaIndonesiaIranIraqIrelandIsraelItalyJamaicaJapanJordanKazakhstanKenyaKoreaKuwaitLaosLatin AmericaLebanonLiberiaMalaysiaMexicoMicronesiaMiddle AfricaMoldovaMoroccoNepalNetherlandsNicaraguaNigeriaNorthern AfricaNorthern EuropeNorwayOceaniaPakistanPeruPhilippinesPolandPortugalRomaniaRussiaSaudi ArabiaScotlandSerbiaSierra LeoneSingaporeSomaliaSouth AfricaSouth AmericaSouth Central AsiaSouth Eastern AsiaSouthern EuropeSpainSri LankaSudanSwedenSwitzerlandSyriaTaiwanThailandTurkeyUgandaUkraineUruguayVenezuelaVietnamWestern AfricaWestern AsiaWestern EuropeZaireZimbabwe
Immigrant Origin (Percentage)
AfghanistanAfricaArgentinaArmeniaAsiaAustraliaAustriaBangladeshBelarusBelgiumBoliviaBosnia and HerzegovinaBrazilBulgariaBurma / MyanmarCambodiaCanadaCaribbeanCentral AmericaChileChinaColombiaCongoCosta RicaCroatiaCubaCzechoslovakiaDenmarkDominican RepublicEastern AfricaEastern AsiaEastern EuropeEcuadorEgyptEl SalvadorEnglandEthiopiaEuropeFijiFranceGermanyGhanaGreeceGuatemalaHaitiHondurasHong KongHungaryIndiaIndonesiaIranIraqIrelandIsraelItalyJamaicaJapanJordanKazakhstanKenyaKoreaKuwaitLaosLatin AmericaLebanonLiberiaMalaysiaMexicoMicronesiaMiddle AfricaMoldovaMoroccoNepalNetherlandsNicaraguaNigeriaNorthern AfricaNorthern EuropeNorwayOceaniaPakistanPeruPhilippinesPolandPortugalRomaniaRussiaSaudi ArabiaScotlandSerbiaSierra LeoneSingaporeSomaliaSouth AfricaSouth AmericaSouth Central AsiaSouth Eastern AsiaSouthern EuropeSpainSri LankaSudanSwedenSwitzerlandSyriaTaiwanThailandTurkeyUgandaUkraineUruguayVenezuelaVietnamWestern AfricaWestern AsiaWestern EuropeZaireZimbabwe
Income
Income (Families)
Income (Households)
Poverty
Poverty (Families)
Unemployment
Employment Occupations
Employment Industries
Employer Class
Commute Time
Commute Means
School Enrollment
Education by Degree Field
Occupancy
Finances
Physical Characteristics
Salt Lake City
Compare Zip Codes
Comparison Subject

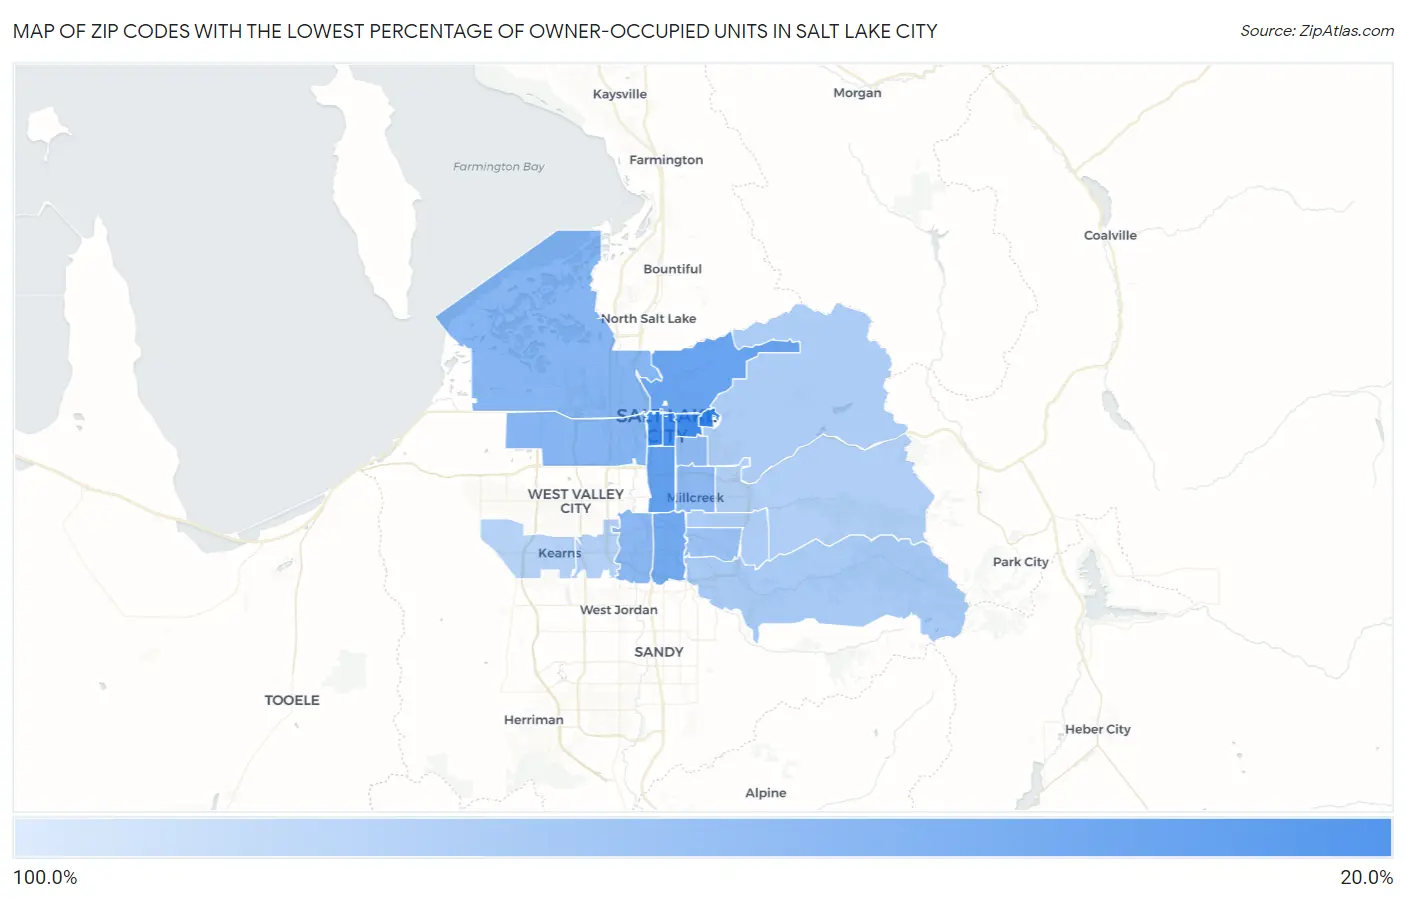
Map of Zip Codes with the Lowest Percentage of Owner-Occupied Units in Salt Lake City

100.0%
0.0%
Zip Codes with the Lowest Percentage of Owner-Occupied Units in Salt Lake City Map

Zip Codes with the Lowest Percentage of Owner-Occupied Units in Salt Lake City, UT

Zip Code % Owner-Occupied vs State vs National
1.8410122.5%70.7%(-48.2)#564.8%(-42.3)#462
2.8410223.7%70.7%(-47.0)#664.8%(-41.1)#492
3.8411124.0%70.7%(-46.7)#764.8%(-40.8)#505
4.8411538.9%70.7%(-31.8)#1064.8%(-25.9)#1,410
5.8410343.0%70.7%(-27.8)#1264.8%(-21.8)#1,802
6.8410746.3%70.7%(-24.4)#1964.8%(-18.5)#2,212
7.8410455.7%70.7%(-15.0)#2764.8%(-9.12)#3,949
8.8411655.9%70.7%(-14.9)#2864.8%(-8.96)#3,977
9.8412357.9%70.7%(-12.8)#3264.8%(-6.93)#4,508
10.8410659.4%70.7%(-11.3)#3864.8%(-5.38)#4,938
11.8410560.3%70.7%(-10.4)#4064.8%(-4.47)#5,213
12.8411766.7%70.7%(-4.03)#5464.8%(+1.88)#7,875
13.8412175.0%70.7%(+4.30)#8864.8%(+10.2)#13,380
14.8412477.3%70.7%(+6.57)#11564.8%(+12.5)#15,400
15.8410877.5%70.7%(+6.83)#11764.8%(+12.7)#15,640
16.8410979.4%70.7%(+8.68)#13264.8%(+14.6)#17,353
17.8412980.9%70.7%(+10.2)#14364.8%(+16.1)#18,830
18.8411882.0%70.7%(+11.3)#15164.8%(+17.2)#19,902
19.84150100.0%70.7%(+29.3)#28564.8%(+35.2)#32,491

Common Questions

What are the Top 10 Zip Codes with the Lowest Percentage of Owner-Occupied Units in Salt Lake City, UT?
Top 10 Zip Codes with the Lowest Percentage of Owner-Occupied Units in Salt Lake City, UT are:
#1
0.0%
#2
22.5%
#3
23.7%
#4
24.0%
#5
38.9%
#6
43.0%
#7
46.3%
#8
55.7%
#9
55.9%
#10
57.9%
What zip code has the Lowest Percentage of Owner-Occupied Units in Salt Lake City, UT?
84101 has the Lowest Percentage of Owner-Occupied Units in Salt Lake City, UT with 22.5%.
What is the Percentage of Owner-Occupied Units in Salt Lake City, UT?
Percentage of Owner-Occupied Units in Salt Lake City is 47.0%.
What is the Percentage of Owner-Occupied Units in Utah?
Percentage of Owner-Occupied Units in Utah is 70.7%.
What is the Percentage of Owner-Occupied Units in the United States?
Percentage of Owner-Occupied Units in the United States is 64.8%.