Zip Codes with the Highest Percentage of Population with a Degree in Psychology in Gilmer, TX
RELATED REPORTS & OPTIONS
Psychology
Gilmer
Compare Zip Codes
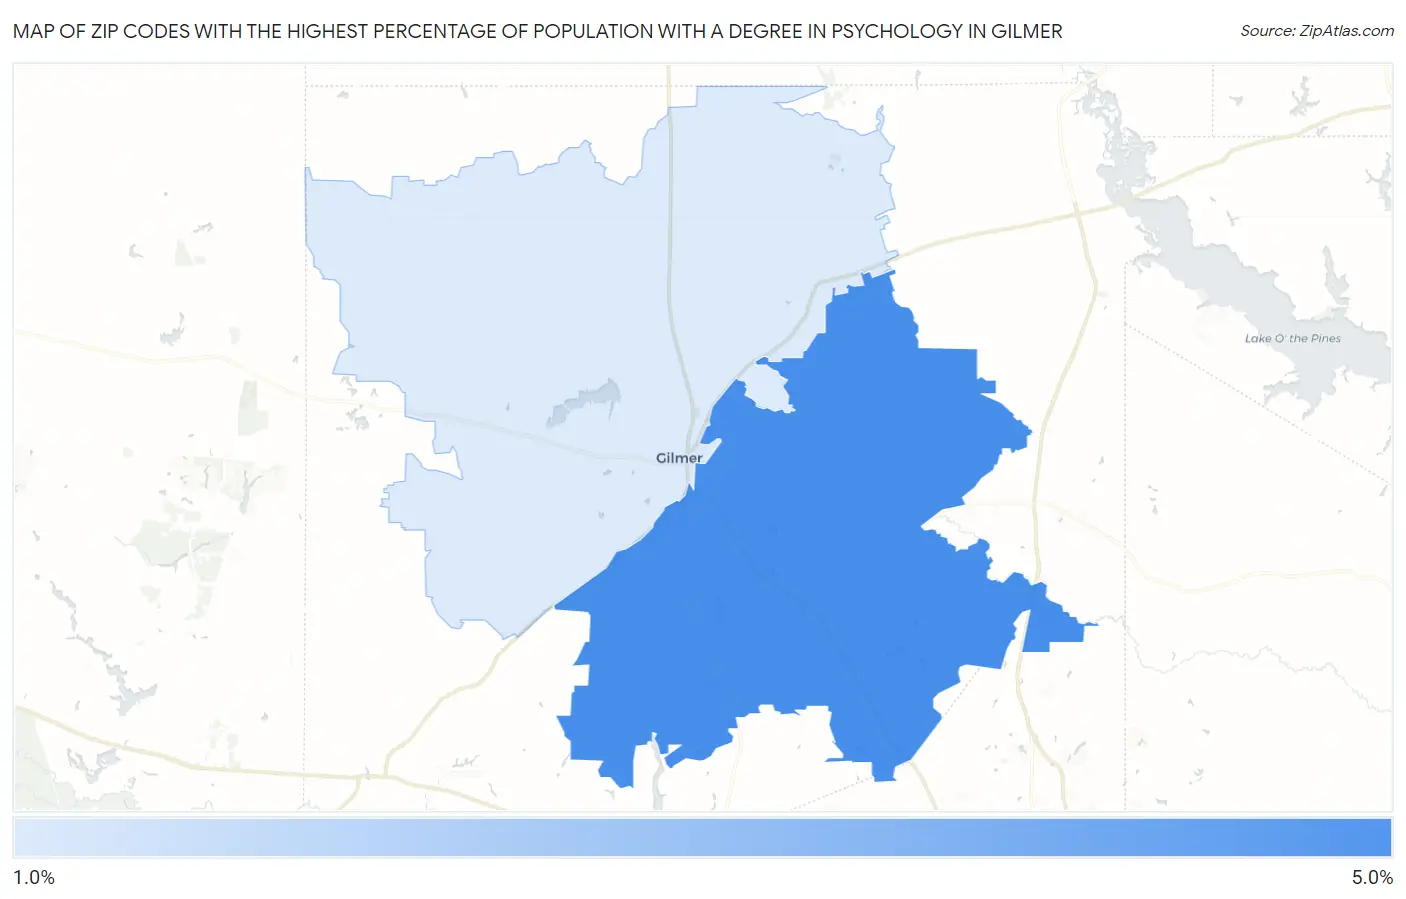
Map of Zip Codes with the Highest Percentage of Population with a Degree in Psychology in Gilmer
1.5%
4.4%
Zip Codes with the Highest Percentage of Population with a Degree in Psychology in Gilmer, TX
| Zip Code | % Graduates | vs State | vs National | |
| 1. | 75645 | 4.4% | 4.3%(+0.084)#603 | 5.1%(-0.669)#13,553 |
| 2. | 75644 | 1.5% | 4.3%(-2.82)#1,218 | 5.1%(-3.57)#21,850 |
1
Common Questions
What are the Top Zip Codes with the Highest Percentage of Population with a Degree in Psychology in Gilmer, TX?
Top Zip Codes with the Highest Percentage of Population with a Degree in Psychology in Gilmer, TX are:
What zip code has the Highest Percentage of Population with a Degree in Psychology in Gilmer, TX?
75645 has the Highest Percentage of Population with a Degree in Psychology in Gilmer, TX with 4.4%.
What is the Percentage of Population with a Degree in Psychology in Gilmer, TX?
Percentage of Population with a Degree in Psychology in Gilmer is 3.0%.
What is the Percentage of Population with a Degree in Psychology in Texas?
Percentage of Population with a Degree in Psychology in Texas is 4.3%.
What is the Percentage of Population with a Degree in Psychology in the United States?
Percentage of Population with a Degree in Psychology in the United States is 5.1%.