Zip Codes with the Highest Percentage of Population Employed in Agriculture, Fishing & Hunting in Houston, TX
RELATED REPORTS & OPTIONS
Agriculture, Fishing & Hunting
Houston
Compare Zip Codes
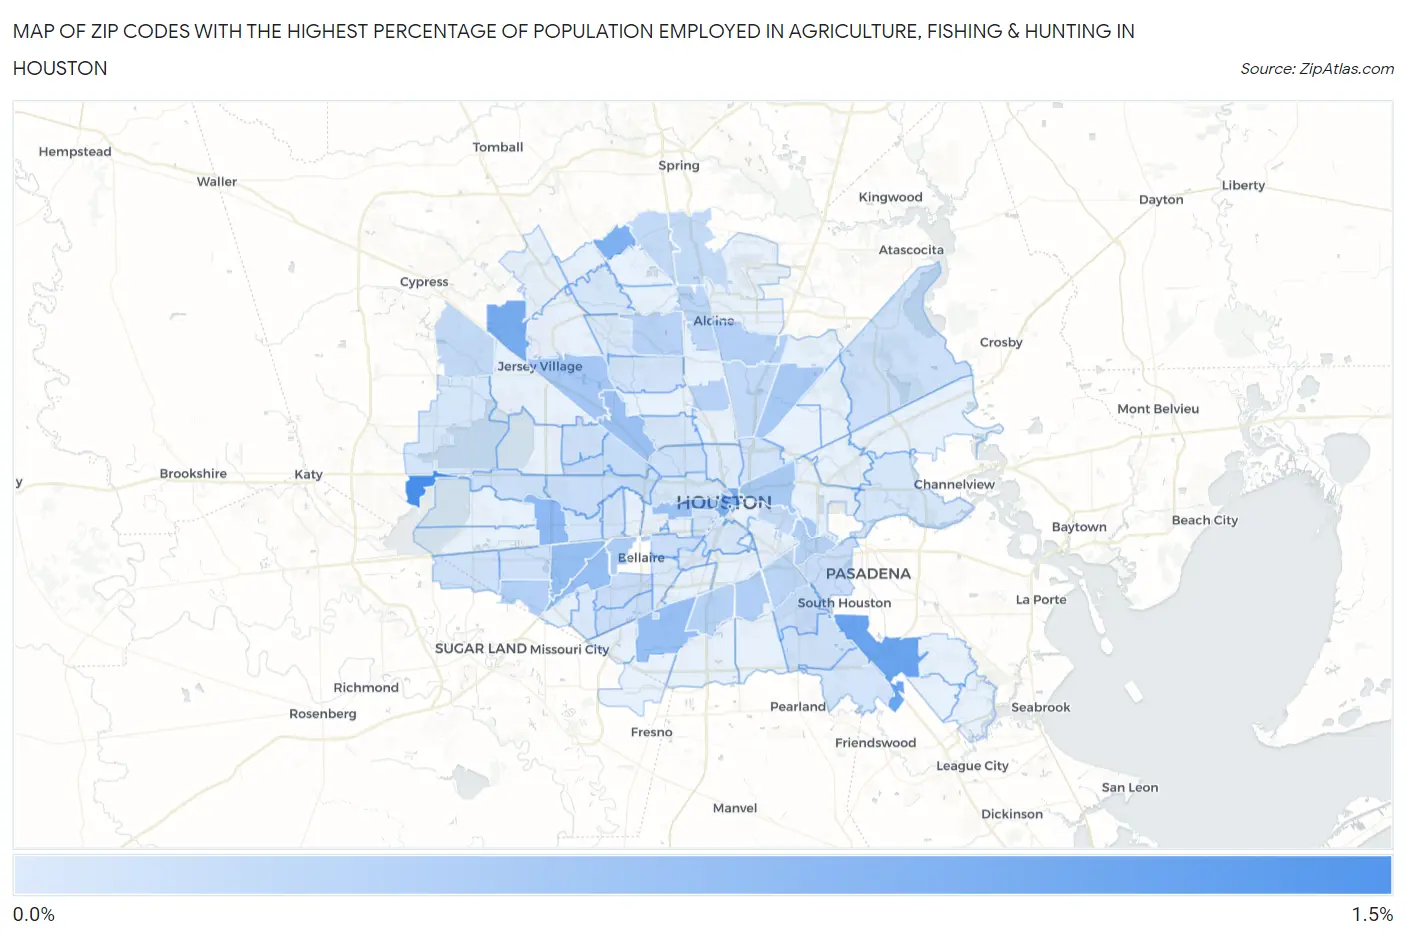
Map of Zip Codes with the Highest Percentage of Population Employed in Agriculture, Fishing & Hunting in Houston
0.0%
1.5%
Zip Codes with the Highest Percentage of Population Employed in Agriculture, Fishing & Hunting in Houston, TX
| Zip Code | % Employed | vs State | vs National | |
| 1. | 77094 | 1.4% | 0.75%(+0.652)#778 | 1.2%(+0.205)#14,627 |
| 2. | 77034 | 1.1% | 0.75%(+0.330)#834 | 1.2%(-0.118)#15,878 |
| 3. | 77065 | 0.94% | 0.75%(+0.191)#866 | 1.2%(-0.256)#16,483 |
| 4. | 77068 | 0.89% | 0.75%(+0.140)#880 | 1.2%(-0.307)#16,751 |
| 5. | 77002 | 0.87% | 0.75%(+0.118)#890 | 1.2%(-0.329)#16,872 |
| 6. | 77042 | 0.73% | 0.75%(-0.020)#940 | 1.2%(-0.468)#17,665 |
| 7. | 77074 | 0.67% | 0.75%(-0.081)#958 | 1.2%(-0.529)#18,024 |
| 8. | 77036 | 0.66% | 0.75%(-0.087)#960 | 1.2%(-0.535)#18,055 |
| 9. | 77045 | 0.65% | 0.75%(-0.104)#967 | 1.2%(-0.551)#18,151 |
| 10. | 77019 | 0.61% | 0.75%(-0.139)#984 | 1.2%(-0.587)#18,400 |
| 11. | 77092 | 0.61% | 0.75%(-0.144)#988 | 1.2%(-0.592)#18,436 |
| 12. | 77040 | 0.52% | 0.75%(-0.233)#1,034 | 1.2%(-0.681)#19,120 |
| 13. | 77020 | 0.50% | 0.75%(-0.250)#1,043 | 1.2%(-0.698)#19,271 |
| 14. | 77016 | 0.49% | 0.75%(-0.260)#1,050 | 1.2%(-0.708)#19,359 |
| 15. | 77081 | 0.46% | 0.75%(-0.290)#1,060 | 1.2%(-0.738)#19,611 |
| 16. | 77033 | 0.41% | 0.75%(-0.346)#1,088 | 1.2%(-0.794)#20,107 |
| 17. | 77039 | 0.40% | 0.75%(-0.354)#1,095 | 1.2%(-0.802)#20,178 |
| 18. | 77099 | 0.39% | 0.75%(-0.364)#1,102 | 1.2%(-0.812)#20,268 |
| 19. | 77012 | 0.38% | 0.75%(-0.375)#1,109 | 1.2%(-0.822)#20,366 |
| 20. | 77051 | 0.36% | 0.75%(-0.392)#1,122 | 1.2%(-0.839)#20,548 |
| 21. | 77038 | 0.36% | 0.75%(-0.394)#1,124 | 1.2%(-0.841)#20,571 |
| 22. | 77076 | 0.34% | 0.75%(-0.413)#1,132 | 1.2%(-0.861)#20,770 |
| 23. | 77087 | 0.31% | 0.75%(-0.447)#1,152 | 1.2%(-0.894)#21,117 |
| 24. | 77060 | 0.30% | 0.75%(-0.456)#1,158 | 1.2%(-0.904)#21,214 |
| 25. | 77093 | 0.26% | 0.75%(-0.497)#1,183 | 1.2%(-0.944)#21,711 |
| 26. | 77095 | 0.25% | 0.75%(-0.503)#1,187 | 1.2%(-0.951)#21,772 |
| 27. | 77090 | 0.25% | 0.75%(-0.503)#1,188 | 1.2%(-0.951)#21,773 |
| 28. | 77011 | 0.24% | 0.75%(-0.507)#1,196 | 1.2%(-0.955)#21,825 |
| 29. | 77073 | 0.23% | 0.75%(-0.519)#1,208 | 1.2%(-0.967)#21,966 |
| 30. | 77055 | 0.22% | 0.75%(-0.527)#1,213 | 1.2%(-0.975)#22,049 |
| 31. | 77024 | 0.20% | 0.75%(-0.547)#1,239 | 1.2%(-0.995)#22,304 |
| 32. | 77061 | 0.20% | 0.75%(-0.554)#1,246 | 1.2%(-1.00)#22,393 |
| 33. | 77005 | 0.19% | 0.75%(-0.559)#1,250 | 1.2%(-1.01)#22,450 |
| 34. | 77035 | 0.18% | 0.75%(-0.571)#1,257 | 1.2%(-1.02)#22,588 |
| 35. | 77017 | 0.17% | 0.75%(-0.582)#1,272 | 1.2%(-1.03)#22,721 |
| 36. | 77096 | 0.17% | 0.75%(-0.583)#1,274 | 1.2%(-1.03)#22,742 |
| 37. | 77079 | 0.16% | 0.75%(-0.587)#1,281 | 1.2%(-1.04)#22,810 |
| 38. | 77044 | 0.16% | 0.75%(-0.591)#1,285 | 1.2%(-1.04)#22,858 |
| 39. | 77080 | 0.15% | 0.75%(-0.605)#1,302 | 1.2%(-1.05)#23,066 |
| 40. | 77075 | 0.14% | 0.75%(-0.607)#1,305 | 1.2%(-1.05)#23,090 |
| 41. | 77083 | 0.14% | 0.75%(-0.610)#1,308 | 1.2%(-1.06)#23,134 |
| 42. | 77008 | 0.13% | 0.75%(-0.617)#1,318 | 1.2%(-1.06)#23,227 |
| 43. | 77072 | 0.13% | 0.75%(-0.621)#1,322 | 1.2%(-1.07)#23,278 |
| 44. | 77057 | 0.12% | 0.75%(-0.633)#1,332 | 1.2%(-1.08)#23,429 |
| 45. | 77088 | 0.12% | 0.75%(-0.636)#1,335 | 1.2%(-1.08)#23,466 |
| 46. | 77026 | 0.11% | 0.75%(-0.642)#1,340 | 1.2%(-1.09)#23,546 |
| 47. | 77006 | 0.11% | 0.75%(-0.646)#1,344 | 1.2%(-1.09)#23,588 |
| 48. | 77063 | 0.085% | 0.75%(-0.666)#1,374 | 1.2%(-1.11)#23,888 |
| 49. | 77089 | 0.082% | 0.75%(-0.669)#1,378 | 1.2%(-1.12)#23,928 |
| 50. | 77007 | 0.075% | 0.75%(-0.676)#1,385 | 1.2%(-1.12)#24,022 |
| 51. | 77018 | 0.072% | 0.75%(-0.680)#1,394 | 1.2%(-1.13)#24,078 |
| 52. | 77084 | 0.071% | 0.75%(-0.681)#1,396 | 1.2%(-1.13)#24,090 |
| 53. | 77015 | 0.068% | 0.75%(-0.684)#1,407 | 1.2%(-1.13)#24,127 |
| 54. | 77004 | 0.063% | 0.75%(-0.688)#1,414 | 1.2%(-1.14)#24,193 |
| 55. | 77066 | 0.061% | 0.75%(-0.691)#1,417 | 1.2%(-1.14)#24,219 |
| 56. | 77030 | 0.060% | 0.75%(-0.692)#1,419 | 1.2%(-1.14)#24,225 |
| 57. | 77086 | 0.044% | 0.75%(-0.707)#1,436 | 1.2%(-1.16)#24,408 |
| 58. | 77071 | 0.024% | 0.75%(-0.728)#1,448 | 1.2%(-1.18)#24,559 |
| 59. | 77009 | 0.010% | 0.75%(-0.741)#1,452 | 1.2%(-1.19)#24,622 |
| 60. | 77025 | 0.0065% | 0.75%(-0.745)#1,454 | 1.2%(-1.19)#24,634 |
1
Common Questions
What are the Top 10 Zip Codes with the Highest Percentage of Population Employed in Agriculture, Fishing & Hunting in Houston, TX?
Top 10 Zip Codes with the Highest Percentage of Population Employed in Agriculture, Fishing & Hunting in Houston, TX are:
What zip code has the Highest Percentage of Population Employed in Agriculture, Fishing & Hunting in Houston, TX?
77094 has the Highest Percentage of Population Employed in Agriculture, Fishing & Hunting in Houston, TX with 1.4%.
What is the Percentage of Population Employed in Agriculture, Fishing & Hunting in Houston, TX?
Percentage of Population Employed in Agriculture, Fishing & Hunting in Houston is 0.22%.
What is the Percentage of Population Employed in Agriculture, Fishing & Hunting in Texas?
Percentage of Population Employed in Agriculture, Fishing & Hunting in Texas is 0.75%.
What is the Percentage of Population Employed in Agriculture, Fishing & Hunting in the United States?
Percentage of Population Employed in Agriculture, Fishing & Hunting in the United States is 1.2%.