Zip Codes with the Highest Percentage of Population Employed in Mining, Quarrying, & Extraction in Dallas, TX
RELATED REPORTS & OPTIONS
Mining, Quarrying, & Extraction
Dallas
Compare Zip Codes
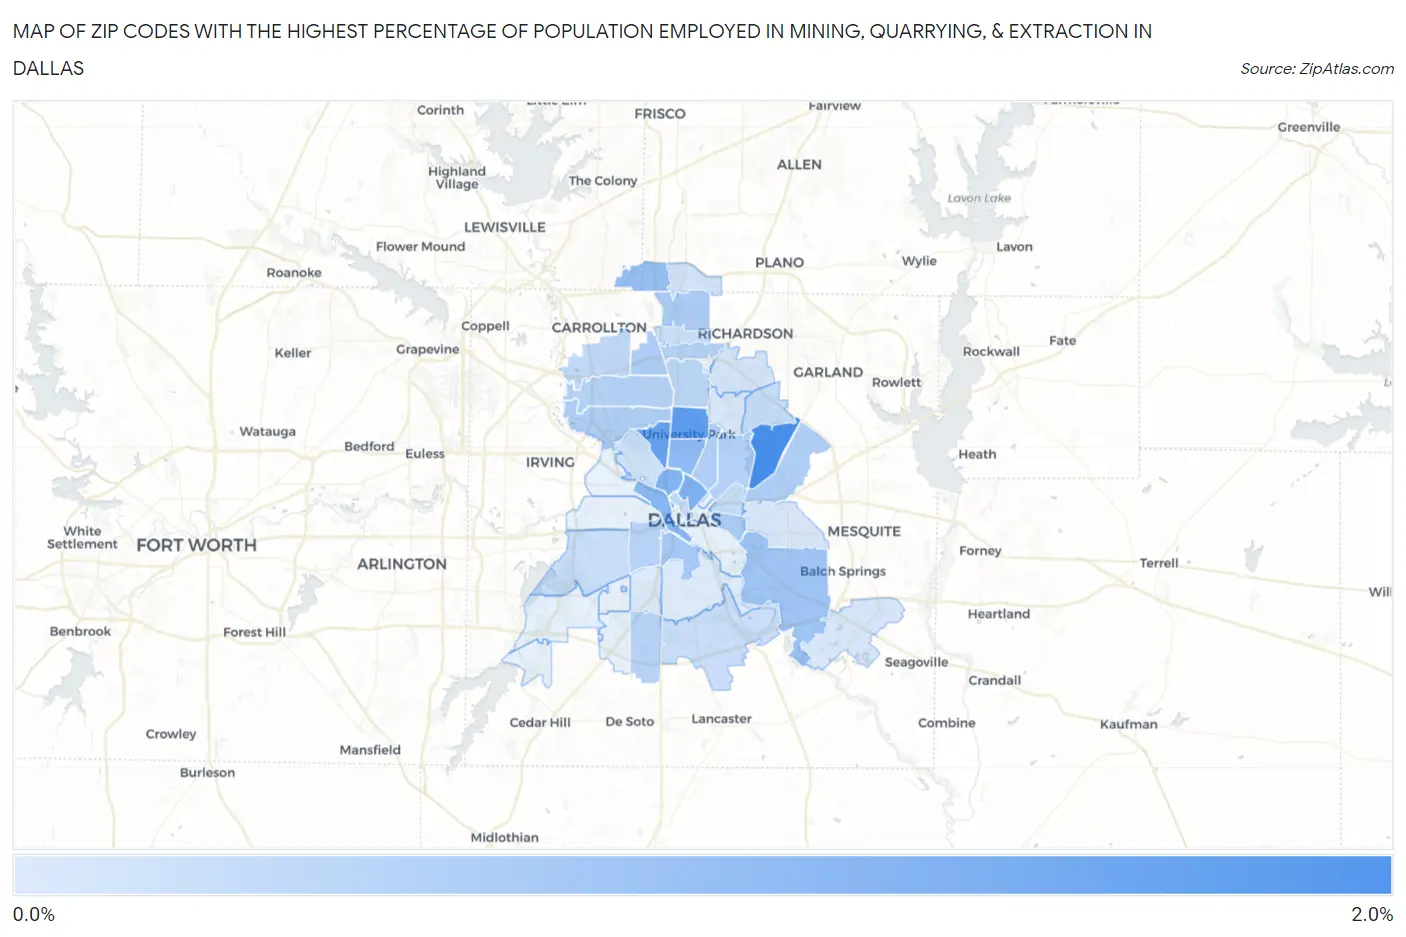
Map of Zip Codes with the Highest Percentage of Population Employed in Mining, Quarrying, & Extraction in Dallas
0.056%
1.9%
Zip Codes with the Highest Percentage of Population Employed in Mining, Quarrying, & Extraction in Dallas, TX
| Zip Code | % Employed | vs State | vs National | |
| 1. | 75218 | 1.9% | 1.9%(+0.022)#687 | 0.44%(+1.44)#3,803 |
| 2. | 75225 | 1.6% | 1.9%(-0.250)#752 | 0.44%(+1.16)#4,180 |
| 3. | 75209 | 1.5% | 1.9%(-0.350)#788 | 0.44%(+1.06)#4,359 |
| 4. | 75204 | 1.2% | 1.9%(-0.666)#864 | 0.44%(+0.748)#4,925 |
| 5. | 75219 | 1.2% | 1.9%(-0.695)#872 | 0.44%(+0.719)#4,996 |
| 6. | 75207 | 1.1% | 1.9%(-0.768)#900 | 0.44%(+0.646)#5,173 |
| 7. | 75205 | 1.0% | 1.9%(-0.838)#927 | 0.44%(+0.576)#5,331 |
| 8. | 75287 | 0.88% | 1.9%(-0.970)#988 | 0.44%(+0.443)#5,696 |
| 9. | 75217 | 0.77% | 1.9%(-1.09)#1,054 | 0.44%(+0.326)#6,105 |
| 10. | 75203 | 0.73% | 1.9%(-1.12)#1,072 | 0.44%(+0.295)#6,213 |
| 11. | 75210 | 0.67% | 1.9%(-1.19)#1,107 | 0.44%(+0.228)#6,466 |
| 12. | 75248 | 0.64% | 1.9%(-1.21)#1,129 | 0.44%(+0.204)#6,571 |
| 13. | 75244 | 0.61% | 1.9%(-1.24)#1,143 | 0.44%(+0.175)#6,699 |
| 14. | 75228 | 0.61% | 1.9%(-1.24)#1,144 | 0.44%(+0.174)#6,702 |
| 15. | 75220 | 0.60% | 1.9%(-1.25)#1,150 | 0.44%(+0.164)#6,746 |
| 16. | 75206 | 0.57% | 1.9%(-1.28)#1,163 | 0.44%(+0.133)#6,869 |
| 17. | 75214 | 0.57% | 1.9%(-1.29)#1,166 | 0.44%(+0.128)#6,889 |
| 18. | 75229 | 0.54% | 1.9%(-1.31)#1,185 | 0.44%(+0.102)#7,004 |
| 19. | 75240 | 0.52% | 1.9%(-1.33)#1,195 | 0.44%(+0.084)#7,079 |
| 20. | 75208 | 0.50% | 1.9%(-1.36)#1,212 | 0.44%(+0.057)#7,208 |
| 21. | 75232 | 0.50% | 1.9%(-1.36)#1,213 | 0.44%(+0.055)#7,216 |
| 22. | 75230 | 0.45% | 1.9%(-1.41)#1,242 | 0.44%(+0.008)#7,489 |
| 23. | 75234 | 0.40% | 1.9%(-1.46)#1,272 | 0.44%(-0.042)#7,796 |
| 24. | 75201 | 0.39% | 1.9%(-1.46)#1,279 | 0.44%(-0.051)#7,844 |
| 25. | 75238 | 0.34% | 1.9%(-1.51)#1,313 | 0.44%(-0.098)#8,186 |
| 26. | 75223 | 0.33% | 1.9%(-1.52)#1,317 | 0.44%(-0.106)#8,238 |
| 27. | 75211 | 0.31% | 1.9%(-1.54)#1,339 | 0.44%(-0.131)#8,443 |
| 28. | 75241 | 0.28% | 1.9%(-1.57)#1,356 | 0.44%(-0.160)#8,675 |
| 29. | 75254 | 0.24% | 1.9%(-1.61)#1,381 | 0.44%(-0.200)#9,065 |
| 30. | 75235 | 0.23% | 1.9%(-1.62)#1,389 | 0.44%(-0.211)#9,180 |
| 31. | 75252 | 0.21% | 1.9%(-1.65)#1,404 | 0.44%(-0.233)#9,441 |
| 32. | 75243 | 0.16% | 1.9%(-1.69)#1,433 | 0.44%(-0.279)#9,956 |
| 33. | 75227 | 0.12% | 1.9%(-1.73)#1,442 | 0.44%(-0.316)#10,449 |
| 34. | 75253 | 0.11% | 1.9%(-1.74)#1,448 | 0.44%(-0.327)#10,597 |
| 35. | 75231 | 0.11% | 1.9%(-1.75)#1,450 | 0.44%(-0.332)#10,693 |
| 36. | 75224 | 0.067% | 1.9%(-1.79)#1,465 | 0.44%(-0.373)#11,363 |
| 37. | 75216 | 0.056% | 1.9%(-1.80)#1,469 | 0.44%(-0.384)#11,574 |
1
Common Questions
What are the Top 10 Zip Codes with the Highest Percentage of Population Employed in Mining, Quarrying, & Extraction in Dallas, TX?
Top 10 Zip Codes with the Highest Percentage of Population Employed in Mining, Quarrying, & Extraction in Dallas, TX are:
What zip code has the Highest Percentage of Population Employed in Mining, Quarrying, & Extraction in Dallas, TX?
75218 has the Highest Percentage of Population Employed in Mining, Quarrying, & Extraction in Dallas, TX with 1.9%.
What is the Percentage of Population Employed in Mining, Quarrying, & Extraction in Dallas, TX?
Percentage of Population Employed in Mining, Quarrying, & Extraction in Dallas is 0.48%.
What is the Percentage of Population Employed in Mining, Quarrying, & Extraction in Texas?
Percentage of Population Employed in Mining, Quarrying, & Extraction in Texas is 1.9%.
What is the Percentage of Population Employed in Mining, Quarrying, & Extraction in the United States?
Percentage of Population Employed in Mining, Quarrying, & Extraction in the United States is 0.44%.