Zip Codes with the Highest Percentage of Population Employed in Firefighting & Prevention in Dallas, TX

RELATED REPORTS & OPTIONS

Firefighting & Prevention
Population
Families and Households
Female Fertility
Female Fertility (Unmarried)
Race (Community Size)
Race (Percentage)
Ancestry (Community Size)
AfghanAfricanAlaska NativeAlbanianAlsatianAmericanApacheArabArgentineanArmenianAssyrian / Chaldean / SyriacAustralianAustrianBahamianBangladeshiBarbadianBasqueBelgianBelizeanBhutaneseBlackfeetBolivianBrazilianBritishBritish West IndianBulgarianBurmeseCajunCambodianCanadianCape VerdeanCelticCentral AmericanCentral American IndianCherokeeChickasawChileanChippewaChoctawColombianComancheCosta RicanCreekCroatianCubanCypriotCzechCzechoslovakianDanishDominicanDutchDutch West IndianEastern EuropeanEcuadorianEgyptianEnglishEstonianEthiopianEuropeanFilipinoFinnishFrenchFrench CanadianGermanGhanaianGreekGuamanian / ChamorroGuatemalanGuyaneseHaitianHonduranHungarianIcelanderIndian (Asian)IndonesianIranianIraqiIrishIroquoisIsraeliItalianJamaicanJapaneseJordanianKenyanKoreanLaotianLatvianLebaneseLiberianLithuanianLuxembourgerMalaysianMalteseMexicanMexican American IndianMongolianMoroccanNative HawaiianNavajoNew ZealanderNicaraguanNigerianNorthern EuropeanNorwegianOkinawanOsagePakistaniPalestinianPanamanianParaguayanPennsylvania GermanPeruvianPolishPortuguesePotawatomiPuebloPuerto RicanRomanianRussianSalvadoranSamoanScandinavianScotch-IrishScottishSeminoleSenegaleseSerbianSierra LeoneanSiouxSlavicSlovakSloveneSomaliSouth AfricanSouth AmericanSouth American IndianSpaniardSpanishSpanish AmericanSpanish American IndianSri LankanSubsaharan AfricanSudaneseSwedishSwissSyrianThaiTohono O'OdhamTonganTrinidadian and TobagonianTurkishUgandanUkrainianUruguayanVenezuelanVietnameseWelshWest IndianYaquiYugoslavianZimbabwean
Ancestry (Percentage)
AfghanAfricanAlaska NativeAlbanianAlsatianAmericanApacheArabArgentineanArmenianAssyrian / Chaldean / SyriacAustralianAustrianBahamianBangladeshiBarbadianBasqueBelgianBelizeanBhutaneseBlackfeetBolivianBrazilianBritishBritish West IndianBulgarianBurmeseCajunCambodianCanadianCape VerdeanCelticCentral AmericanCentral American IndianCherokeeChickasawChileanChippewaChoctawColombianComancheCosta RicanCreekCroatianCubanCypriotCzechCzechoslovakianDanishDominicanDutchDutch West IndianEastern EuropeanEcuadorianEgyptianEnglishEstonianEthiopianEuropeanFilipinoFinnishFrenchFrench CanadianGermanGhanaianGreekGuamanian / ChamorroGuatemalanGuyaneseHaitianHonduranHungarianIcelanderIndian (Asian)IndonesianIranianIraqiIrishIroquoisIsraeliItalianJamaicanJapaneseJordanianKenyanKoreanLaotianLatvianLebaneseLiberianLithuanianLuxembourgerMalaysianMalteseMexicanMexican American IndianMongolianMoroccanNative HawaiianNavajoNew ZealanderNicaraguanNigerianNorthern EuropeanNorwegianOkinawanOsagePakistaniPalestinianPanamanianParaguayanPennsylvania GermanPeruvianPolishPortuguesePotawatomiPuebloPuerto RicanRomanianRussianSalvadoranSamoanScandinavianScotch-IrishScottishSeminoleSenegaleseSerbianSierra LeoneanSiouxSlavicSlovakSloveneSomaliSouth AfricanSouth AmericanSouth American IndianSpaniardSpanishSpanish AmericanSpanish American IndianSri LankanSubsaharan AfricanSudaneseSwedishSwissSyrianThaiTohono O'OdhamTonganTrinidadian and TobagonianTurkishUgandanUkrainianUruguayanVenezuelanVietnameseWelshWest IndianYaquiYugoslavianZimbabwean
Immigrant Origin (Total)
AfghanistanAfricaAlbaniaArgentinaArmeniaAsiaAustraliaAustriaBahamasBangladeshBelarusBelgiumBelizeBoliviaBosnia and HerzegovinaBrazilBulgariaBurma / MyanmarCambodiaCameroonCanadaCaribbeanCentral AmericaChileChinaColombiaCongoCosta RicaCroatiaCubaCzechoslovakiaDenmarkDominicaDominican RepublicEastern AfricaEastern AsiaEastern EuropeEcuadorEgyptEl SalvadorEnglandEritreaEthiopiaEuropeFijiFranceGermanyGhanaGreeceGuatemalaGuyanaHaitiHondurasHong KongHungaryIndiaIndonesiaIranIraqIrelandIsraelItalyJamaicaJapanJordanKazakhstanKenyaKoreaKuwaitLaosLatin AmericaLatviaLebanonLiberiaMalaysiaMexicoMiddle AfricaMoldovaMoroccoNepalNetherlandsNicaraguaNigeriaNorthern AfricaNorthern EuropeNorwayOceaniaPakistanPanamaPeruPhilippinesPolandPortugalRomaniaRussiaSaudi ArabiaScotlandSenegalSerbiaSierra LeoneSingaporeSomaliaSouth AfricaSouth AmericaSouth Central AsiaSouth Eastern AsiaSouthern EuropeSpainSri LankaSudanSwedenSwitzerlandSyriaTaiwanThailandTrinidad and TobagoTurkeyUgandaUkraineUruguayUzbekistanVenezuelaVietnamWest IndiesWestern AfricaWestern AsiaWestern EuropeYemenZaireZimbabwe
Immigrant Origin (Percentage)
AfghanistanAfricaAlbaniaArgentinaArmeniaAsiaAustraliaAustriaBahamasBangladeshBelarusBelgiumBelizeBoliviaBosnia and HerzegovinaBrazilBulgariaBurma / MyanmarCambodiaCameroonCanadaCaribbeanCentral AmericaChileChinaColombiaCongoCosta RicaCroatiaCubaCzechoslovakiaDenmarkDominicaDominican RepublicEastern AfricaEastern AsiaEastern EuropeEcuadorEgyptEl SalvadorEnglandEritreaEthiopiaEuropeFijiFranceGermanyGhanaGreeceGuatemalaGuyanaHaitiHondurasHong KongHungaryIndiaIndonesiaIranIraqIrelandIsraelItalyJamaicaJapanJordanKazakhstanKenyaKoreaKuwaitLaosLatin AmericaLatviaLebanonLiberiaMalaysiaMexicoMiddle AfricaMoldovaMoroccoNepalNetherlandsNicaraguaNigeriaNorthern AfricaNorthern EuropeNorwayOceaniaPakistanPanamaPeruPhilippinesPolandPortugalRomaniaRussiaSaudi ArabiaScotlandSenegalSerbiaSierra LeoneSingaporeSomaliaSouth AfricaSouth AmericaSouth Central AsiaSouth Eastern AsiaSouthern EuropeSpainSri LankaSudanSwedenSwitzerlandSyriaTaiwanThailandTrinidad and TobagoTurkeyUgandaUkraineUruguayUzbekistanVenezuelaVietnamWest IndiesWestern AfricaWestern AsiaWestern EuropeYemenZaireZimbabwe
Income
Income (Families)
Income (Households)
Poverty
Poverty (Families)
Unemployment
Employment Occupations
Employment Industries
Employer Class
Commute Time
Commute Means
School Enrollment
Education by Degree Field
Occupancy
Finances
Physical Characteristics
Dallas
Compare Zip Codes
Comparison Subject

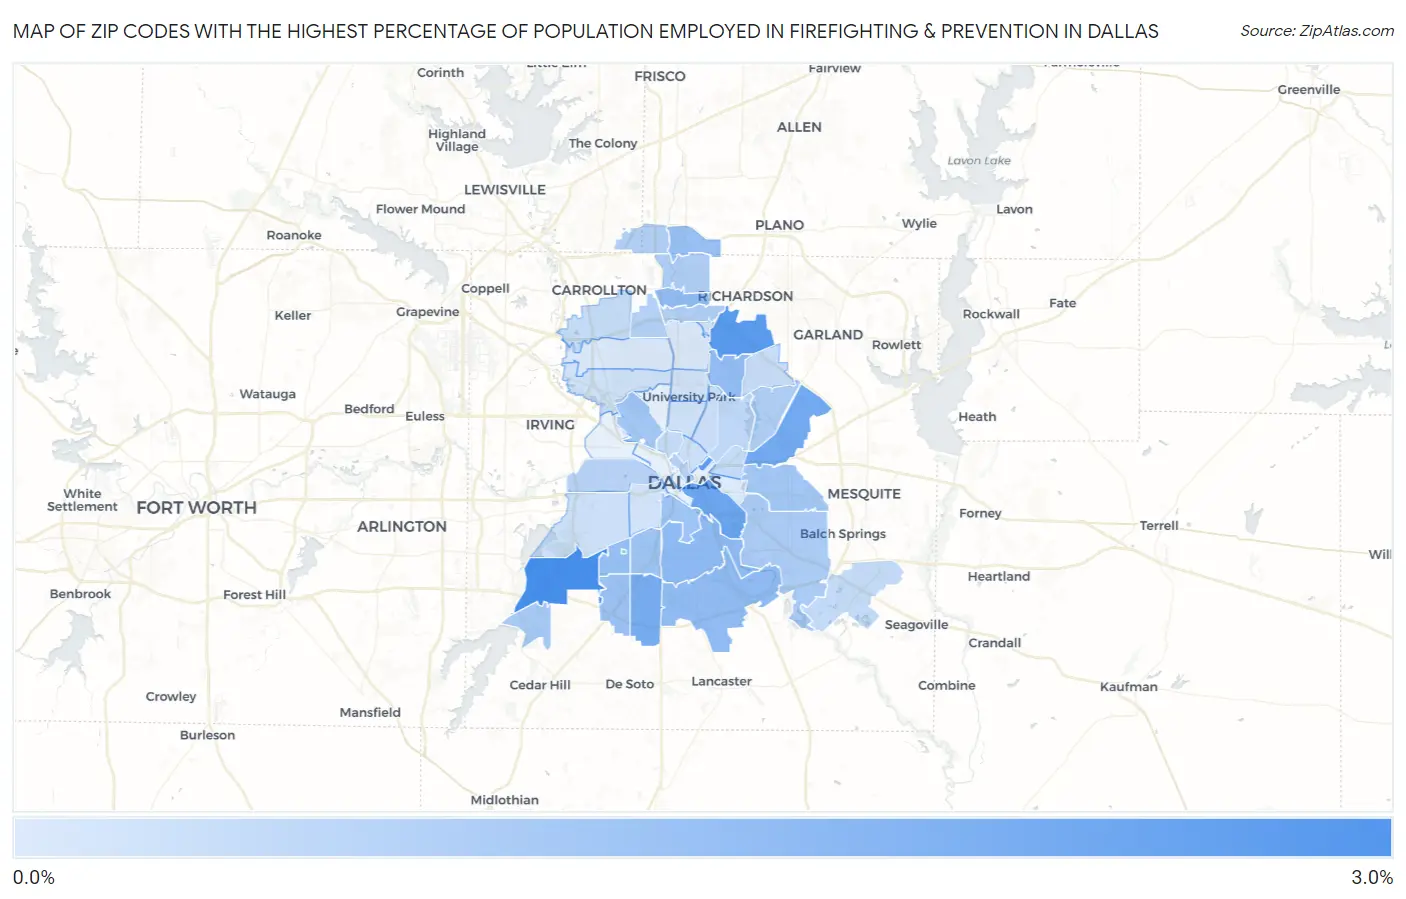
Map of Zip Codes with the Highest Percentage of Population Employed in Firefighting & Prevention in Dallas

0.0%
3.0%
Zip Codes with the Highest Percentage of Population Employed in Firefighting & Prevention in Dallas Map

Zip Codes with the Highest Percentage of Population Employed in Firefighting & Prevention in Dallas, TX

Zip Code % Employed vs State vs National
1.752362.8%1.1%(+1.67)#1571.2%(+1.61)#2,585
2.752432.5%1.1%(+1.38)#1941.2%(+1.32)#3,074
3.752462.4%1.1%(+1.32)#2051.2%(+1.26)#3,218
4.752152.1%1.1%(+1.00)#2611.2%(+0.944)#4,065
5.752282.0%1.1%(+0.888)#2801.2%(+0.831)#4,455
6.752321.9%1.1%(+0.787)#3071.2%(+0.730)#4,854
7.752161.5%1.1%(+0.369)#4461.2%(+0.312)#6,984
8.752541.5%1.1%(+0.361)#4501.2%(+0.303)#7,047
9.752411.5%1.1%(+0.344)#4551.2%(+0.286)#7,157
10.752311.4%1.1%(+0.312)#4661.2%(+0.254)#7,376
11.752331.4%1.1%(+0.285)#4781.2%(+0.228)#7,551
12.752521.4%1.1%(+0.223)#5101.2%(+0.165)#7,977
13.752371.3%1.1%(+0.153)#5481.2%(+0.095)#8,497
14.752241.2%1.1%(+0.099)#5741.2%(+0.042)#8,920
15.752031.2%1.1%(+0.096)#5751.2%(+0.039)#8,945
16.752271.2%1.1%(+0.038)#6121.2%(-0.020)#9,447
17.752351.1%1.1%(+0.001)#6391.2%(-0.057)#9,830
18.752491.1%1.1%(-0.072)#6771.2%(-0.129)#10,525
19.752170.99%1.1%(-0.143)#7191.2%(-0.200)#11,239
20.752480.96%1.1%(-0.167)#7411.2%(-0.225)#11,522
21.752180.93%1.1%(-0.203)#7631.2%(-0.260)#11,898
22.752400.89%1.1%(-0.234)#7821.2%(-0.292)#12,228
23.752010.87%1.1%(-0.261)#8061.2%(-0.319)#12,501
24.752440.86%1.1%(-0.265)#8101.2%(-0.322)#12,543
25.752870.86%1.1%(-0.273)#8161.2%(-0.330)#12,614
26.752120.79%1.1%(-0.336)#8531.2%(-0.394)#13,314
27.752140.67%1.1%(-0.456)#9301.2%(-0.514)#14,633
28.752190.60%1.1%(-0.530)#9811.2%(-0.587)#15,434
29.752530.56%1.1%(-0.569)#1,0061.2%(-0.627)#15,848
30.752230.55%1.1%(-0.576)#1,0131.2%(-0.633)#15,930
31.752340.52%1.1%(-0.606)#1,0391.2%(-0.663)#16,294
32.752380.51%1.1%(-0.618)#1,0501.2%(-0.676)#16,436
33.752060.45%1.1%(-0.681)#1,0891.2%(-0.739)#17,133
34.752040.43%1.1%(-0.697)#1,1001.2%(-0.754)#17,311
35.752110.43%1.1%(-0.699)#1,1021.2%(-0.756)#17,333
36.752050.39%1.1%(-0.737)#1,1241.2%(-0.794)#17,750
37.752510.39%1.1%(-0.737)#1,1251.2%(-0.794)#17,751
38.752200.39%1.1%(-0.738)#1,1261.2%(-0.796)#17,772
39.752080.35%1.1%(-0.775)#1,1431.2%(-0.833)#18,194
40.752250.32%1.1%(-0.812)#1,1631.2%(-0.869)#18,581
41.752300.19%1.1%(-0.936)#1,2311.2%(-0.994)#19,736
42.752290.16%1.1%(-0.969)#1,2481.2%(-1.03)#19,973
43.752100.13%1.1%(-0.995)#1,2591.2%(-1.05)#20,135

Common Questions

What are the Top 10 Zip Codes with the Highest Percentage of Population Employed in Firefighting & Prevention in Dallas, TX?
Top 10 Zip Codes with the Highest Percentage of Population Employed in Firefighting & Prevention in Dallas, TX are:
#1
2.8%
#2
2.5%
#3
2.4%
#4
2.1%
#5
2.0%
#6
1.9%
#7
1.5%
#8
1.5%
#9
1.5%
#10
1.4%
What zip code has the Highest Percentage of Population Employed in Firefighting & Prevention in Dallas, TX?
75236 has the Highest Percentage of Population Employed in Firefighting & Prevention in Dallas, TX with 2.8%.
What is the Percentage of Population Employed in Firefighting & Prevention in Dallas, TX?
Percentage of Population Employed in Firefighting & Prevention in Dallas is 1.0%.
What is the Percentage of Population Employed in Firefighting & Prevention in Texas?
Percentage of Population Employed in Firefighting & Prevention in Texas is 1.1%.
What is the Percentage of Population Employed in Firefighting & Prevention in the United States?
Percentage of Population Employed in Firefighting & Prevention in the United States is 1.2%.