Zip Codes with the Highest Percentage of Households Heated without Fuel in Corpus Christi, TX
RELATED REPORTS & OPTIONS
Fuel-less Heating
Corpus Christi
Compare Zip Codes
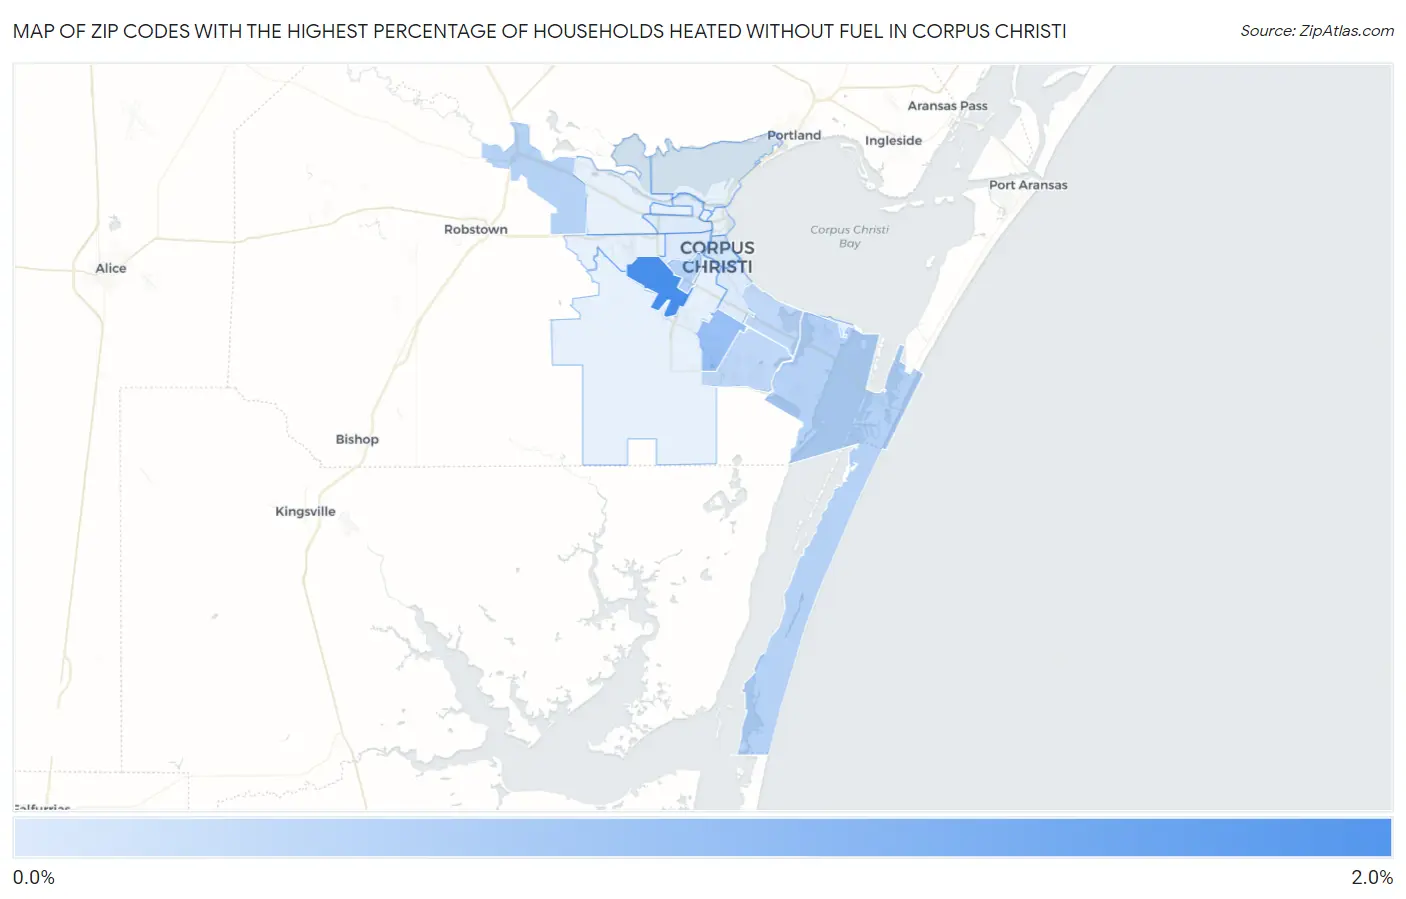
Map of Zip Codes with the Highest Percentage of Households Heated without Fuel in Corpus Christi
0.0%
2.0%
Zip Codes with the Highest Percentage of Households Heated without Fuel in Corpus Christi, TX
| Zip Code | Fuel-less Heating | vs State | vs National | |
| 1. | 78417 | 1.7% | 0.60%(+1.10)#113 | 1.2%(+0.500)#3,188 |
| 2. | 78413 | 0.90% | 0.60%(+0.300)#308 | 1.2%(-0.300)#6,006 |
| 3. | 78418 | 0.60% | 0.60%(=0.000)#472 | 1.2%(-0.600)#8,394 |
| 4. | 78410 | 0.60% | 0.60%(=0.000)#478 | 1.2%(-0.600)#8,429 |
| 5. | 78416 | 0.60% | 0.60%(=0.000)#498 | 1.2%(-0.600)#8,665 |
| 6. | 78414 | 0.50% | 0.60%(-0.100)#519 | 1.2%(-0.700)#9,210 |
| 7. | 78412 | 0.50% | 0.60%(-0.100)#535 | 1.2%(-0.700)#9,286 |
| 8. | 78404 | 0.30% | 0.60%(-0.300)#755 | 1.2%(-0.900)#12,279 |
| 9. | 78411 | 0.20% | 0.60%(-0.400)#840 | 1.2%(-1.000)#13,485 |
| 10. | 78405 | 0.20% | 0.60%(-0.400)#863 | 1.2%(-1.000)#13,738 |
| 11. | 78408 | 0.20% | 0.60%(-0.400)#874 | 1.2%(-1.000)#13,914 |
1
Common Questions
What are the Top 10 Zip Codes with the Highest Percentage of Households Heated without Fuel in Corpus Christi, TX?
Top 10 Zip Codes with the Highest Percentage of Households Heated without Fuel in Corpus Christi, TX are:
What zip code has the Highest Percentage of Households Heated without Fuel in Corpus Christi, TX?
78417 has the Highest Percentage of Households Heated without Fuel in Corpus Christi, TX with 1.7%.
What is the Percentage of Households Heated without Fuel in Corpus Christi, TX?
Percentage of Households Heated without Fuel in Corpus Christi is 0.40%.
What is the Percentage of Households Heated without Fuel in Texas?
Percentage of Households Heated without Fuel in Texas is 0.60%.
What is the Percentage of Households Heated without Fuel in the United States?
Percentage of Households Heated without Fuel in the United States is 1.2%.