Zip Codes with the Largest Italian Community in Corpus Christi, TX
RELATED REPORTS & OPTIONS
Italian
Corpus Christi
Compare Zip Codes
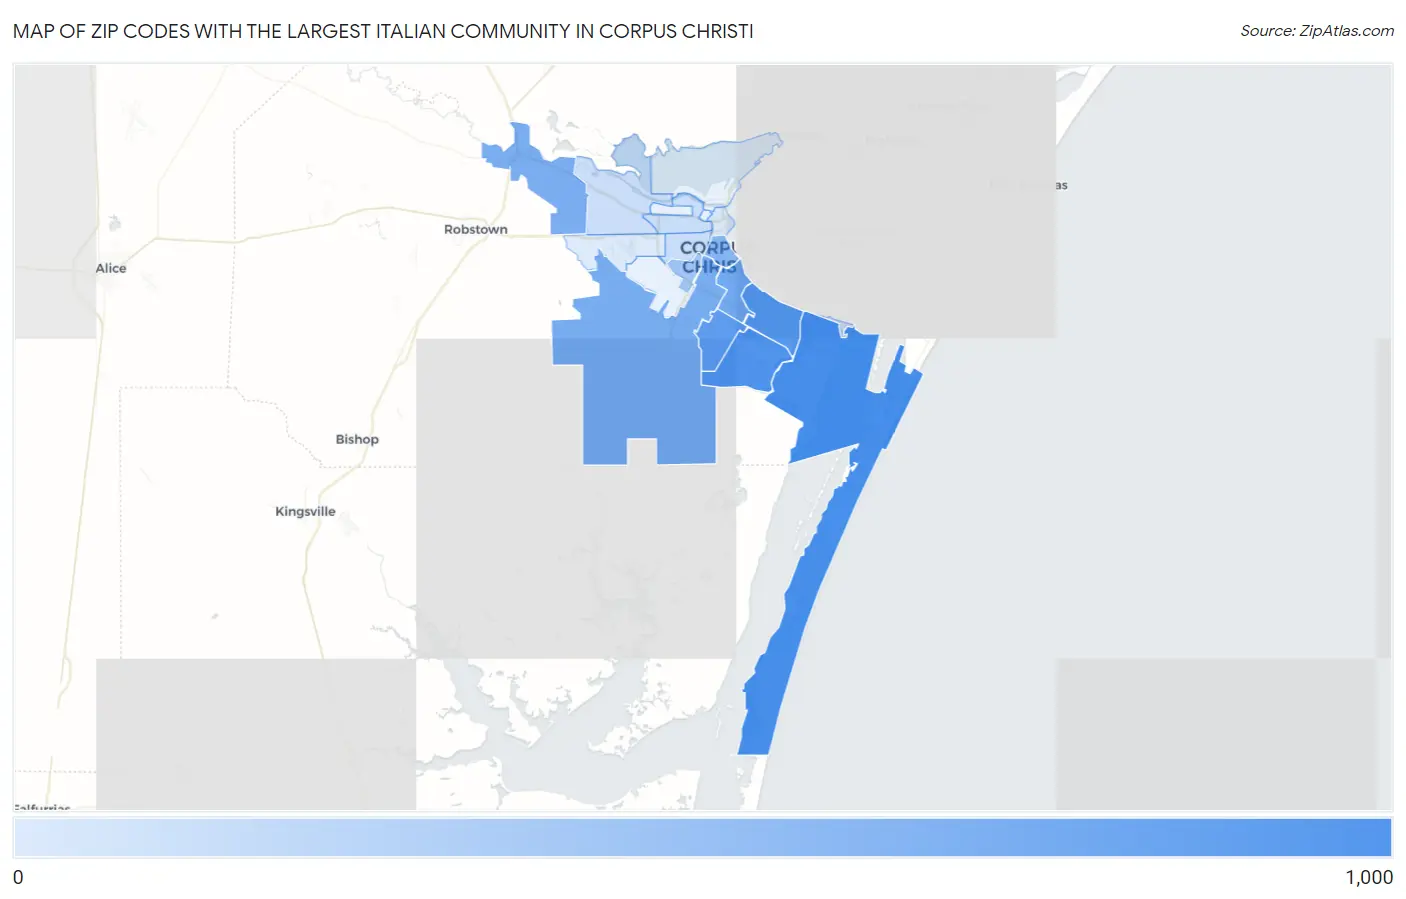
Map of Zip Codes with the Largest Italian Community in Corpus Christi
10
909
Zip Codes with the Largest Italian Community in Corpus Christi, TX
| Zip Code | Italian | vs State | vs National | |
| 1. | 78418 | 909 | 542,080(0.17%)#186 | 16,316,728(0.01%)#5,506 |
| 2. | 78414 | 721 | 542,080(0.13%)#255 | 16,316,728(0.00%)#6,515 |
| 3. | 78412 | 584 | 542,080(0.11%)#317 | 16,316,728(0.00%)#7,348 |
| 4. | 78413 | 469 | 542,080(0.09%)#372 | 16,316,728(0.00%)#8,227 |
| 5. | 78411 | 242 | 542,080(0.04%)#577 | 16,316,728(0.00%)#10,933 |
| 6. | 78415 | 215 | 542,080(0.04%)#613 | 16,316,728(0.00%)#11,434 |
| 7. | 78410 | 199 | 542,080(0.04%)#633 | 16,316,728(0.00%)#11,741 |
| 8. | 78404 | 131 | 542,080(0.02%)#750 | 16,316,728(0.00%)#13,478 |
| 9. | 78416 | 63 | 542,080(0.01%)#937 | 16,316,728(0.00%)#16,543 |
| 10. | 78405 | 19 | 542,080(0.00%)#1,195 | 16,316,728(0.00%)#21,337 |
| 11. | 78408 | 19 | 542,080(0.00%)#1,196 | 16,316,728(0.00%)#21,339 |
| 12. | 78409 | 18 | 542,080(0.00%)#1,207 | 16,316,728(0.00%)#21,544 |
| 13. | 78401 | 12 | 542,080(0.00%)#1,268 | 16,316,728(0.00%)#22,872 |
| 14. | 78419 | 12 | 542,080(0.00%)#1,280 | 16,316,728(0.00%)#23,048 |
| 15. | 78406 | 10 | 542,080(0.00%)#1,302 | 16,316,728(0.00%)#23,447 |
1
Common Questions
What are the Top 10 Zip Codes with the Largest Italian Community in Corpus Christi, TX?
Top 10 Zip Codes with the Largest Italian Community in Corpus Christi, TX are:
What zip code has the Largest Italian Community in Corpus Christi, TX?
78418 has the Largest Italian Community in Corpus Christi, TX with 909.
What is the Total Italian Population in Corpus Christi, TX?
Total Italian Population in Corpus Christi is 3,694.
What is the Total Italian Population in Texas?
Total Italian Population in Texas is 542,080.
What is the Total Italian Population in the United States?
Total Italian Population in the United States is 16,316,728.