Zip Codes with the Highest Percentage of Households with Income Above $100,000 in Paris, TX
RELATED REPORTS & OPTIONS
Household Income | $100k+
Paris
Compare Zip Codes
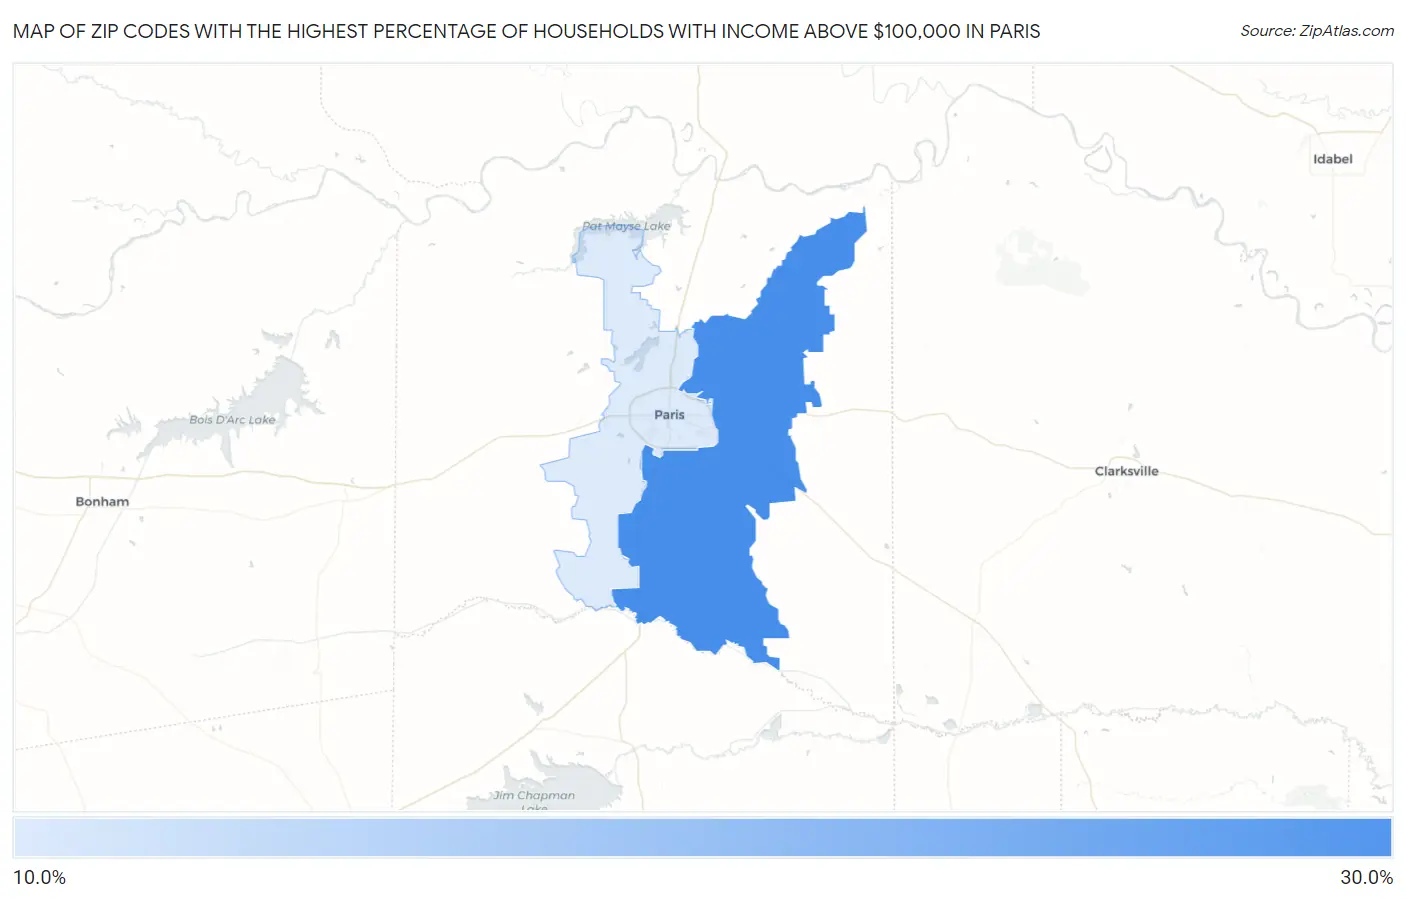
Map of Zip Codes with the Highest Percentage of Households with Income Above $100,000 in Paris
17.0%
29.9%
Zip Codes with the Highest Percentage of Households with Income Above $100,000 in Paris, TX
| Zip Code | Households with Income > $100k | vs State | vs National | |
| 1. | 75462 | 29.9% | 36.2%(-6.30)#870 | 37.3%(-7.40)#15,525 |
| 2. | 75460 | 17.0% | 36.2%(-19.2)#1,536 | 37.3%(-20.3)#26,221 |
1
Common Questions
What are the Top Zip Codes with the Highest Percentage of Households with Income Above $100,000 in Paris, TX?
Top Zip Codes with the Highest Percentage of Households with Income Above $100,000 in Paris, TX are:
What zip code has the Highest Percentage of Households with Income Above $100,000 in Paris, TX?
75462 has the Highest Percentage of Households with Income Above $100,000 in Paris, TX with 29.9%.
What is the Percentage of Households with Income Above $100,000 in Paris, TX?
Percentage of Households with Income Above $100,000 in Paris is 14.4%.
What is the Percentage of Households with Income Above $100,000 in Texas?
Percentage of Households with Income Above $100,000 in Texas is 36.2%.
What is the Percentage of Households with Income Above $100,000 in the United States?
Percentage of Households with Income Above $100,000 in the United States is 37.3%.