Welsh vs Alaskan Athabascan Receiving Food Stamps

COMPARE

Welsh
Race
Ancestry
AfghanAfricanAlaska NativeAlbanianAleutAlsatianAmericanApacheArabArapahoArgentineanArmenianAssyrian/Chaldean/SyriacAustralianAustrianBahamianBangladeshiBarbadianBasqueBelgianBelizeanBermudanBhutaneseBlackfeetBolivianBrazilianBritishBritish West IndianBulgarianBurmeseCajunCambodianCanadianCape VerdeanCarpatho RusynCelticCentral AmericanCentral American IndianCherokeeCheyenneChickasawChileanChineseChippewaChoctawColombianColvilleComancheCosta RicanCreeCreekCroatianCrowCubanCypriotCzechCzechoslovakianDanishDelawareDominicanDutchDutch West IndianEastern EuropeanEcuadorianEgyptianEnglishEstonianEthiopianEuropeanFijianFilipinoFinnishFrenchFrench American IndianFrench CanadianGermanGerman RussianGhanaianGreekGuamanian/ChamorroGuatemalanGuyaneseHaitianHmongHonduranHopiHoumaHungarianIcelanderIndian (Asian)IndonesianInupiatIranianIraqiIrishIroquoisIsraeliItalianJamaicanJapaneseJordanianKenyanKiowaKoreanLaotianLatvianLebaneseLiberianLithuanianLumbeeLuxembourgerMacedonianMalaysianMalteseMarshalleseMenomineeMexicanMexican American IndianMongolianMoroccanNative HawaiianNavajoNepaleseNew ZealanderNicaraguanNigerianNorthern EuropeanNorwegianOkinawanOsageOttawaPaiutePakistaniPalestinianPanamanianParaguayanPennsylvania GermanPeruvianPimaPolishPortuguesePotawatomiPuebloPuerto RicanPuget Sound SalishRomanianRussianSalvadoranSamoanScandinavianScotch-IrishScottishSeminoleSenegaleseSerbianShoshoneSierra LeoneanSiouxSlavicSlovakSloveneSomaliSouth AfricanSouth AmericanSouth American IndianSoviet UnionSpaniardSpanishSpanish AmericanSpanish American IndianSri LankanSubsaharan AfricanSudaneseSwedishSwissSyrianTaiwaneseThaiTlingit-HaidaTohono O'OdhamTonganTrinidadian and TobagonianTsimshianTurkishU.S. Virgin IslanderUgandanUkrainianUruguayanUteVenezuelanVietnameseWelshWest IndianYakamaYaquiYugoslavianYumanYup'ikZimbabwean
Immigration
NonimmigrantsImmigrantsAfghanistanAfricaAlbaniaArgentinaArmeniaAsiaAustraliaAustriaBahamasBangladeshBarbadosBelarusBelgiumBelizeBoliviaBosnia and HerzegovinaBrazilBulgariaBurma/MyanmarCabo VerdeCambodiaCameroonCanadaCaribbeanCentral AmericaChileChinaColombiaCongoCosta RicaCroatiaCubaCzechoslovakiaDenmarkDominicaDominican RepublicEastern AfricaEastern AsiaEastern EuropeEcuadorEgyptEl SalvadorEnglandEritreaEthiopiaEuropeFijiFranceGermanyGhanaGreeceGrenadaGuatemalaGuyanaHaitiHondurasHong KongHungaryIndiaIndonesiaIranIraqIrelandIsraelItalyJamaicaJapanJordanKazakhstanKenyaKoreaKuwaitLaosLatin AmericaLatviaLebanonLiberiaLithuaniaMalaysiaMexicoMicronesiaMiddle AfricaMoldovaMoroccoNepalNetherlandsNicaraguaNigeriaNorth AmericaNorth MacedoniaNorthern AfricaNorthern EuropeNorwayOceaniaPakistanPanamaPeruPhilippinesPolandPortugalRomaniaRussiaSaudi ArabiaScotlandSenegalSerbiaSierra LeoneSingaporeSomaliaSouth AfricaSouth AmericaSouth Central AsiaSouth Eastern AsiaSouthern EuropeSpainSri LankaSt. Vincent and the GrenadinesSudanSwedenSwitzerlandSyriaTaiwanThailandTrinidad and TobagoTurkeyUgandaUkraineUruguayUzbekistanVenezuelaVietnamWest IndiesWestern AfricaWestern AsiaWestern EuropeYemenZaireZimbabweAzores
Alaskan Athabascan
Race
Ancestry
AfghanAfricanAlaska NativeAlaskan AthabascanAlbanianAleutAlsatianAmericanApacheArabArapahoArgentineanArmenianAssyrian/Chaldean/SyriacAustralianAustrianBahamianBangladeshiBarbadianBasqueBelgianBelizeanBermudanBhutaneseBlackfeetBolivianBrazilianBritishBritish West IndianBulgarianBurmeseCajunCambodianCanadianCape VerdeanCarpatho RusynCelticCentral AmericanCentral American IndianCherokeeCheyenneChickasawChileanChineseChippewaChoctawColombianColvilleComancheCosta RicanCreeCreekCroatianCrowCubanCypriotCzechCzechoslovakianDanishDelawareDominicanDutchDutch West IndianEastern EuropeanEcuadorianEgyptianEnglishEstonianEthiopianEuropeanFijianFilipinoFinnishFrenchFrench American IndianFrench CanadianGermanGerman RussianGhanaianGreekGuamanian/ChamorroGuatemalanGuyaneseHaitianHmongHonduranHopiHoumaHungarianIcelanderIndian (Asian)IndonesianInupiatIranianIraqiIrishIroquoisIsraeliItalianJamaicanJapaneseJordanianKenyanKiowaKoreanLaotianLatvianLebaneseLiberianLithuanianLumbeeLuxembourgerMacedonianMalaysianMalteseMarshalleseMenomineeMexicanMexican American IndianMongolianMoroccanNative HawaiianNavajoNepaleseNew ZealanderNicaraguanNigerianNorthern EuropeanNorwegianOkinawanOsageOttawaPaiutePakistaniPalestinianPanamanianParaguayanPennsylvania GermanPeruvianPimaPolishPortuguesePotawatomiPuebloPuerto RicanPuget Sound SalishRomanianRussianSalvadoranSamoanScandinavianScotch-IrishScottishSeminoleSenegaleseSerbianShoshoneSierra LeoneanSiouxSlavicSlovakSloveneSomaliSouth AfricanSouth AmericanSouth American IndianSoviet UnionSpaniardSpanishSpanish AmericanSpanish American IndianSri LankanSubsaharan AfricanSudaneseSwedishSwissSyrianTaiwaneseThaiTlingit-HaidaTohono O'OdhamTonganTrinidadian and TobagonianTsimshianTurkishU.S. Virgin IslanderUgandanUkrainianUruguayanUteVenezuelanVietnameseWest IndianYakamaYaquiYugoslavianYumanYup'ikZimbabwean
Immigration
NonimmigrantsImmigrantsAfghanistanAfricaAlbaniaArgentinaArmeniaAsiaAustraliaAustriaBahamasBangladeshBarbadosBelarusBelgiumBelizeBoliviaBosnia and HerzegovinaBrazilBulgariaBurma/MyanmarCabo VerdeCambodiaCameroonCanadaCaribbeanCentral AmericaChileChinaColombiaCongoCosta RicaCroatiaCubaCzechoslovakiaDenmarkDominicaDominican RepublicEastern AfricaEastern AsiaEastern EuropeEcuadorEgyptEl SalvadorEnglandEritreaEthiopiaEuropeFijiFranceGermanyGhanaGreeceGrenadaGuatemalaGuyanaHaitiHondurasHong KongHungaryIndiaIndonesiaIranIraqIrelandIsraelItalyJamaicaJapanJordanKazakhstanKenyaKoreaKuwaitLaosLatin AmericaLatviaLebanonLiberiaLithuaniaMalaysiaMexicoMicronesiaMiddle AfricaMoldovaMoroccoNepalNetherlandsNicaraguaNigeriaNorth AmericaNorth MacedoniaNorthern AfricaNorthern EuropeNorwayOceaniaPakistanPanamaPeruPhilippinesPolandPortugalRomaniaRussiaSaudi ArabiaScotlandSenegalSerbiaSierra LeoneSingaporeSomaliaSouth AfricaSouth AmericaSouth Central AsiaSouth Eastern AsiaSouthern EuropeSpainSri LankaSt. Vincent and the GrenadinesSudanSwedenSwitzerlandSyriaTaiwanThailandTrinidad and TobagoTurkeyUgandaUkraineUruguayUzbekistanVenezuelaVietnamWest IndiesWestern AfricaWestern AsiaWestern EuropeYemenZaireZimbabweAzores
Receiving Food Stamps
Income
Poverty
Unemployment
Labor Participation
Family Structure
Vehicle Availability
Education Level
Disability

Receiving Food Stamps Comparison

Welsh

Alaskan Athabascans

Exceptional
Tragic
10.3%
RECEIVING FOOD STAMPS
97.3/ 100
METRIC RATING
96th/ 347
METRIC RANK
14.7%
RECEIVING FOOD STAMPS
0.1/ 100
METRIC RATING
273rd/ 347
METRIC RANK

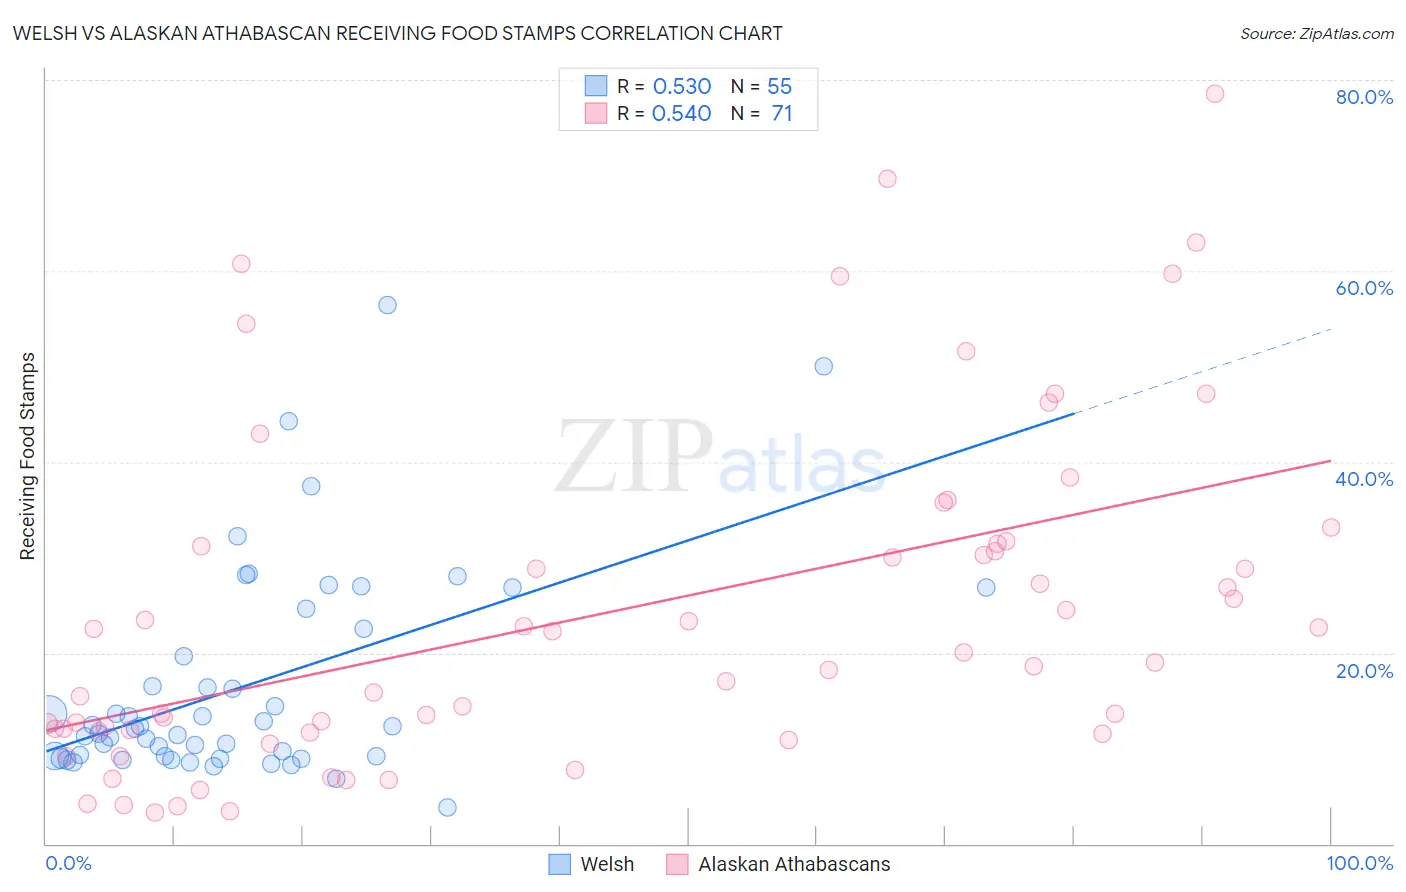
Welsh vs Alaskan Athabascan Receiving Food Stamps Correlation Chart

The statistical analysis conducted on geographies consisting of 526,059,303 people shows a substantial positive correlation between the proportion of Welsh and percentage of population receiving government assistance and/or food stamps in the United States with a correlation coefficient (R) of 0.530 and weighted average of 10.3%. Similarly, the statistical analysis conducted on geographies consisting of 45,801,504 people shows a substantial positive correlation between the proportion of Alaskan Athabascans and percentage of population receiving government assistance and/or food stamps in the United States with a correlation coefficient (R) of 0.540 and weighted average of 14.7%, a difference of 43.1%.
Welsh vs Alaskan Athabascan Receiving Food Stamps

Receiving Food Stamps Correlation Summary

MeasurementWelshAlaskan Athabascan
Minimum3.8%3.3%
Maximum56.4%78.5%
Range52.6%75.2%
Mean16.5%24.2%
Median12.1%19.0%
Interquartile 25% (IQ1)9.1%11.8%
Interquartile 75% (IQ3)22.5%31.4%
Interquartile Range (IQR)13.4%19.6%
Standard Deviation (Sample)11.2%17.7%
Standard Deviation (Population)11.1%17.5%

Similar Demographics by Receiving Food Stamps

Demographics Similar to Welsh by Receiving Food Stamps

In terms of receiving food stamps, the demographic groups most similar to Welsh are Basque (10.3%, a difference of 0.050%), Immigrants from Greece (10.3%, a difference of 0.080%), Czechoslovakian (10.3%, a difference of 0.26%), Immigrants from Egypt (10.3%, a difference of 0.31%), and Serbian (10.3%, a difference of 0.49%).
DemographicsRating | RankReceiving Food Stamps
Immigrants | France
98.3
/100
|
#89
Exceptional
10.1%
Finns
97.9
/100
|
#90
Exceptional
10.2%
Jordanians
97.9
/100
|
#91
Exceptional
10.2%
Irish
97.9
/100
|
#92
Exceptional
10.2%
Belgians
97.7
/100
|
#93
Exceptional
10.2%
Immigrants | Greece
97.4
/100
|
#94
Exceptional
10.3%
Basques
97.4
/100
|
#95
Exceptional
10.3%
Welsh
97.3
/100
|
#96
Exceptional
10.3%
Czechoslovakians
97.2
/100
|
#97
Exceptional
10.3%
Immigrants | Egypt
97.1
/100
|
#98
Exceptional
10.3%
Serbians
97.0
/100
|
#99
Exceptional
10.3%
Immigrants | Western Europe
96.9
/100
|
#100
Exceptional
10.3%
Palestinians
96.9
/100
|
#101
Exceptional
10.3%
Immigrants | Europe
96.8
/100
|
#102
Exceptional
10.3%
Immigrants | Latvia
96.8
/100
|
#103
Exceptional
10.3%

Demographics Similar to Alaskan Athabascans by Receiving Food Stamps

In terms of receiving food stamps, the demographic groups most similar to Alaskan Athabascans are Immigrants from Western Africa (14.7%, a difference of 0.020%), Chippewa (14.7%, a difference of 0.030%), Ute (14.7%, a difference of 0.10%), Immigrants from Guatemala (14.6%, a difference of 0.25%), and Mexican (14.6%, a difference of 0.35%).
DemographicsRating | RankReceiving Food Stamps
Cheyenne
0.2
/100
|
#266
Tragic
14.3%
Dutch West Indians
0.2
/100
|
#267
Tragic
14.3%
Guatemalans
0.1
/100
|
#268
Tragic
14.4%
Nepalese
0.1
/100
|
#269
Tragic
14.6%
Mexicans
0.1
/100
|
#270
Tragic
14.6%
Immigrants | Guatemala
0.1
/100
|
#271
Tragic
14.6%
Chippewa
0.1
/100
|
#272
Tragic
14.7%
Alaskan Athabascans
0.1
/100
|
#273
Tragic
14.7%
Immigrants | Western Africa
0.1
/100
|
#274
Tragic
14.7%
Ute
0.1
/100
|
#275
Tragic
14.7%
Liberians
0.1
/100
|
#276
Tragic
14.8%
Seminole
0.1
/100
|
#277
Tragic
14.8%
Belizeans
0.1
/100
|
#278
Tragic
14.8%
Kiowa
0.0
/100
|
#279
Tragic
14.9%
Ecuadorians
0.0
/100
|
#280
Tragic
14.9%