Immigrants from Burma/Myanmar vs New Zealander Female Poverty
COMPARE
Immigrants from Burma/Myanmar
New Zealander
Female Poverty
Female Poverty Comparison
Immigrants from Burma/Myanmar
New Zealanders
15.4%
FEMALE POVERTY
0.3/ 100
METRIC RATING
252nd/ 347
METRIC RANK
12.7%
FEMALE POVERTY
90.6/ 100
METRIC RATING
120th/ 347
METRIC RANK
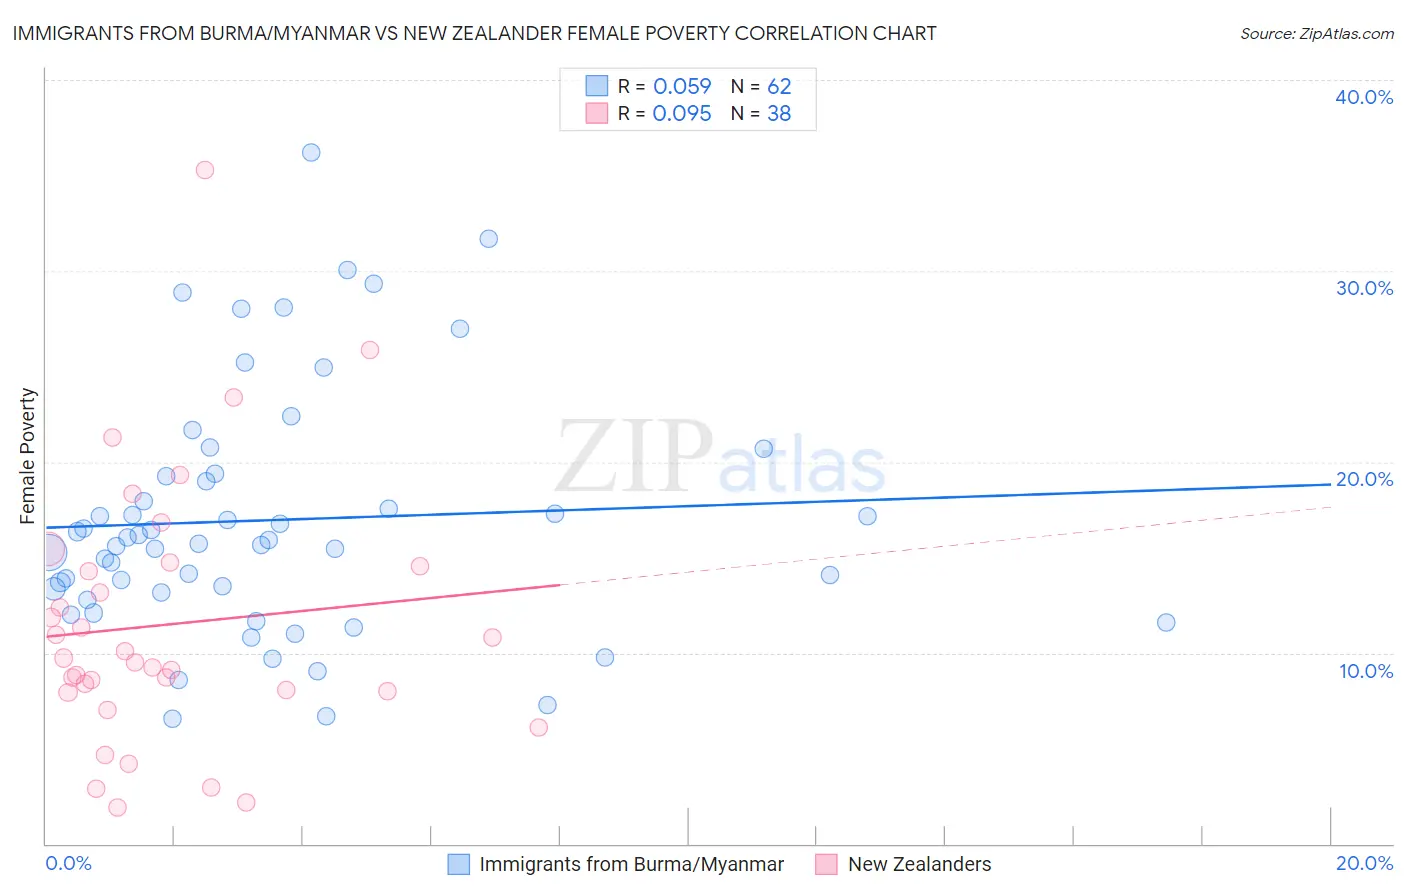
Immigrants from Burma/Myanmar vs New Zealander Female Poverty Correlation Chart
The statistical analysis conducted on geographies consisting of 172,266,194 people shows a slight positive correlation between the proportion of Immigrants from Burma/Myanmar and poverty level among females in the United States with a correlation coefficient (R) of 0.059 and weighted average of 15.4%. Similarly, the statistical analysis conducted on geographies consisting of 106,893,684 people shows a slight positive correlation between the proportion of New Zealanders and poverty level among females in the United States with a correlation coefficient (R) of 0.095 and weighted average of 12.7%, a difference of 20.9%.
Female Poverty Correlation Summary
| Measurement | Immigrants from Burma/Myanmar | New Zealander |
| Minimum | 6.5% | 1.9% |
| Maximum | 36.2% | 35.3% |
| Range | 29.7% | 33.4% |
| Mean | 17.0% | 11.5% |
| Median | 15.8% | 9.6% |
| Interquartile 25% (IQ1) | 13.2% | 8.0% |
| Interquartile 75% (IQ3) | 19.2% | 14.5% |
| Interquartile Range (IQR) | 6.1% | 6.5% |
| Standard Deviation (Sample) | 6.4% | 6.9% |
| Standard Deviation (Population) | 6.4% | 6.8% |
Similar Demographics by Female Poverty
Demographics Similar to Immigrants from Burma/Myanmar by Female Poverty
In terms of female poverty, the demographic groups most similar to Immigrants from Burma/Myanmar are Immigrants from Trinidad and Tobago (15.4%, a difference of 0.030%), Immigrants from Western Africa (15.3%, a difference of 0.19%), Salvadoran (15.3%, a difference of 0.23%), Liberian (15.4%, a difference of 0.26%), and Immigrants from Ghana (15.3%, a difference of 0.37%).
| Demographics | Rating | Rank | Female Poverty |
| Spanish American Indians | 0.3 /100 | #245 | Tragic 15.3% |
| Cubans | 0.3 /100 | #246 | Tragic 15.3% |
| Potawatomi | 0.3 /100 | #247 | Tragic 15.3% |
| Immigrants | Ghana | 0.3 /100 | #248 | Tragic 15.3% |
| Salvadorans | 0.3 /100 | #249 | Tragic 15.3% |
| Immigrants | Western Africa | 0.3 /100 | #250 | Tragic 15.3% |
| Immigrants | Trinidad and Tobago | 0.3 /100 | #251 | Tragic 15.4% |
| Immigrants | Burma/Myanmar | 0.3 /100 | #252 | Tragic 15.4% |
| Liberians | 0.2 /100 | #253 | Tragic 15.4% |
| Trinidadians and Tobagonians | 0.2 /100 | #254 | Tragic 15.4% |
| Ottawa | 0.2 /100 | #255 | Tragic 15.5% |
| Jamaicans | 0.2 /100 | #256 | Tragic 15.5% |
| Immigrants | Jamaica | 0.1 /100 | #257 | Tragic 15.6% |
| Shoshone | 0.1 /100 | #258 | Tragic 15.6% |
| Cape Verdeans | 0.1 /100 | #259 | Tragic 15.6% |
Demographics Similar to New Zealanders by Female Poverty
In terms of female poverty, the demographic groups most similar to New Zealanders are Albanian (12.7%, a difference of 0.060%), Sri Lankan (12.7%, a difference of 0.070%), Immigrants from Southern Europe (12.7%, a difference of 0.090%), Immigrants from Hungary (12.7%, a difference of 0.10%), and French Canadian (12.7%, a difference of 0.14%).
| Demographics | Rating | Rank | Female Poverty |
| Canadians | 92.0 /100 | #113 | Exceptional 12.7% |
| Welsh | 91.6 /100 | #114 | Exceptional 12.7% |
| Puget Sound Salish | 91.5 /100 | #115 | Exceptional 12.7% |
| Immigrants | Russia | 91.2 /100 | #116 | Exceptional 12.7% |
| Immigrants | Southern Europe | 90.9 /100 | #117 | Exceptional 12.7% |
| Sri Lankans | 90.9 /100 | #118 | Exceptional 12.7% |
| Albanians | 90.8 /100 | #119 | Exceptional 12.7% |
| New Zealanders | 90.6 /100 | #120 | Exceptional 12.7% |
| Immigrants | Hungary | 90.3 /100 | #121 | Exceptional 12.7% |
| French Canadians | 90.2 /100 | #122 | Exceptional 12.7% |
| Immigrants | South Eastern Asia | 89.9 /100 | #123 | Excellent 12.7% |
| Immigrants | Norway | 89.3 /100 | #124 | Excellent 12.8% |
| Argentineans | 89.1 /100 | #125 | Excellent 12.8% |
| Immigrants | Ukraine | 88.8 /100 | #126 | Excellent 12.8% |
| South Africans | 88.4 /100 | #127 | Excellent 12.8% |