Immigrants from Burma/Myanmar vs Comanche Female Poverty
COMPARE
Immigrants from Burma/Myanmar
Comanche
Female Poverty
Female Poverty Comparison
Immigrants from Burma/Myanmar
Comanche
15.4%
FEMALE POVERTY
0.3/ 100
METRIC RATING
252nd/ 347
METRIC RANK
16.2%
FEMALE POVERTY
0.0/ 100
METRIC RATING
285th/ 347
METRIC RANK
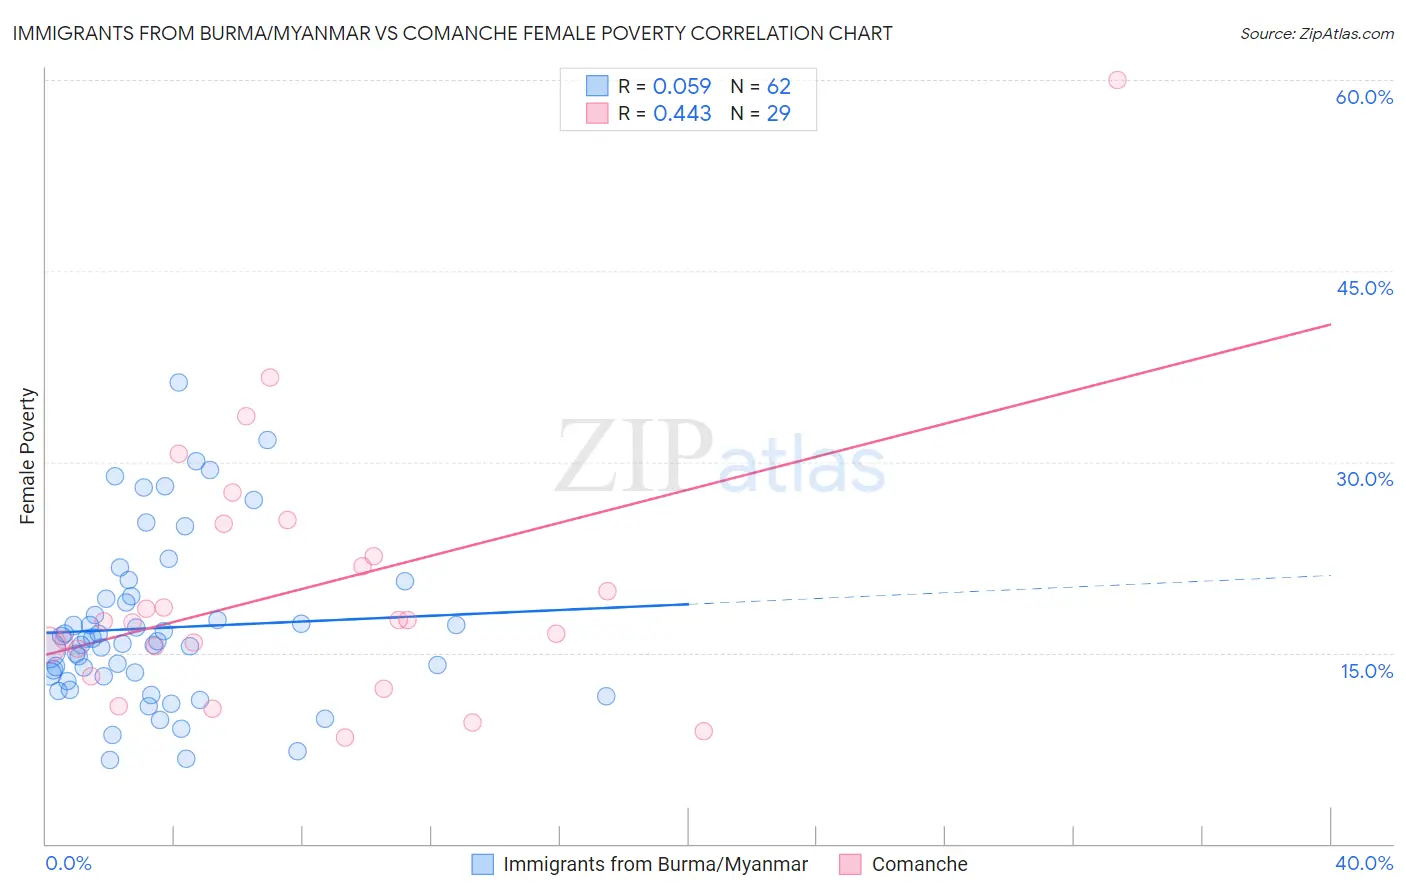
Immigrants from Burma/Myanmar vs Comanche Female Poverty Correlation Chart
The statistical analysis conducted on geographies consisting of 172,266,194 people shows a slight positive correlation between the proportion of Immigrants from Burma/Myanmar and poverty level among females in the United States with a correlation coefficient (R) of 0.059 and weighted average of 15.4%. Similarly, the statistical analysis conducted on geographies consisting of 109,749,855 people shows a moderate positive correlation between the proportion of Comanche and poverty level among females in the United States with a correlation coefficient (R) of 0.443 and weighted average of 16.2%, a difference of 5.3%.
Female Poverty Correlation Summary
| Measurement | Immigrants from Burma/Myanmar | Comanche |
| Minimum | 6.5% | 8.4% |
| Maximum | 36.2% | 60.0% |
| Range | 29.7% | 51.6% |
| Mean | 17.0% | 20.0% |
| Median | 15.8% | 17.4% |
| Interquartile 25% (IQ1) | 13.2% | 14.3% |
| Interquartile 75% (IQ3) | 19.2% | 23.9% |
| Interquartile Range (IQR) | 6.1% | 9.6% |
| Standard Deviation (Sample) | 6.4% | 10.5% |
| Standard Deviation (Population) | 6.4% | 10.3% |
Similar Demographics by Female Poverty
Demographics Similar to Immigrants from Burma/Myanmar by Female Poverty
In terms of female poverty, the demographic groups most similar to Immigrants from Burma/Myanmar are Immigrants from Trinidad and Tobago (15.4%, a difference of 0.030%), Immigrants from Western Africa (15.3%, a difference of 0.19%), Salvadoran (15.3%, a difference of 0.23%), Liberian (15.4%, a difference of 0.26%), and Immigrants from Ghana (15.3%, a difference of 0.37%).
| Demographics | Rating | Rank | Female Poverty |
| Spanish American Indians | 0.3 /100 | #245 | Tragic 15.3% |
| Cubans | 0.3 /100 | #246 | Tragic 15.3% |
| Potawatomi | 0.3 /100 | #247 | Tragic 15.3% |
| Immigrants | Ghana | 0.3 /100 | #248 | Tragic 15.3% |
| Salvadorans | 0.3 /100 | #249 | Tragic 15.3% |
| Immigrants | Western Africa | 0.3 /100 | #250 | Tragic 15.3% |
| Immigrants | Trinidad and Tobago | 0.3 /100 | #251 | Tragic 15.4% |
| Immigrants | Burma/Myanmar | 0.3 /100 | #252 | Tragic 15.4% |
| Liberians | 0.2 /100 | #253 | Tragic 15.4% |
| Trinidadians and Tobagonians | 0.2 /100 | #254 | Tragic 15.4% |
| Ottawa | 0.2 /100 | #255 | Tragic 15.5% |
| Jamaicans | 0.2 /100 | #256 | Tragic 15.5% |
| Immigrants | Jamaica | 0.1 /100 | #257 | Tragic 15.6% |
| Shoshone | 0.1 /100 | #258 | Tragic 15.6% |
| Cape Verdeans | 0.1 /100 | #259 | Tragic 15.6% |
Demographics Similar to Comanche by Female Poverty
In terms of female poverty, the demographic groups most similar to Comanche are Spanish American (16.2%, a difference of 0.080%), Immigrants from Cuba (16.1%, a difference of 0.13%), Immigrants from Haiti (16.1%, a difference of 0.21%), West Indian (16.1%, a difference of 0.36%), and Vietnamese (16.1%, a difference of 0.38%).
| Demographics | Rating | Rank | Female Poverty |
| Immigrants | West Indies | 0.0 /100 | #278 | Tragic 16.1% |
| Immigrants | Bahamas | 0.0 /100 | #279 | Tragic 16.1% |
| Vietnamese | 0.0 /100 | #280 | Tragic 16.1% |
| West Indians | 0.0 /100 | #281 | Tragic 16.1% |
| Immigrants | Haiti | 0.0 /100 | #282 | Tragic 16.1% |
| Immigrants | Cuba | 0.0 /100 | #283 | Tragic 16.1% |
| Spanish Americans | 0.0 /100 | #284 | Tragic 16.2% |
| Comanche | 0.0 /100 | #285 | Tragic 16.2% |
| Inupiat | 0.0 /100 | #286 | Tragic 16.2% |
| Immigrants | Belize | 0.0 /100 | #287 | Tragic 16.3% |
| Indonesians | 0.0 /100 | #288 | Tragic 16.4% |
| Blackfeet | 0.0 /100 | #289 | Tragic 16.4% |
| Immigrants | Bangladesh | 0.0 /100 | #290 | Tragic 16.4% |
| Yaqui | 0.0 /100 | #291 | Tragic 16.4% |
| Immigrants | Zaire | 0.0 /100 | #292 | Tragic 16.4% |