Immigrants from Burma/Myanmar vs Trinidadian and Tobagonian Female Poverty
COMPARE
Immigrants from Burma/Myanmar
Trinidadian and Tobagonian
Female Poverty
Female Poverty Comparison
Immigrants from Burma/Myanmar
Trinidadians and Tobagonians
15.4%
FEMALE POVERTY
0.3/ 100
METRIC RATING
252nd/ 347
METRIC RANK
15.4%
FEMALE POVERTY
0.2/ 100
METRIC RATING
254th/ 347
METRIC RANK
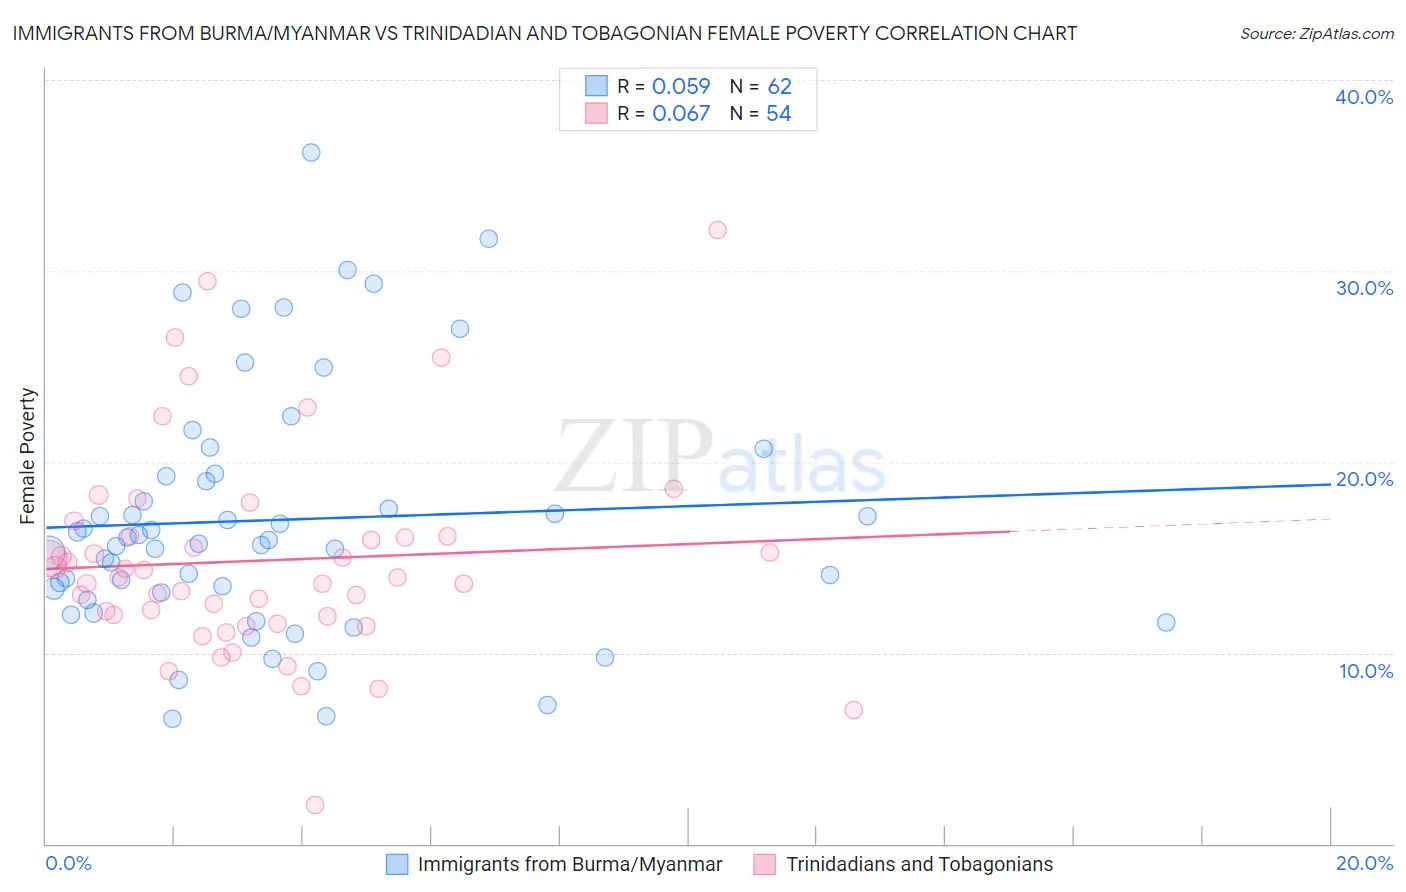
Immigrants from Burma/Myanmar vs Trinidadian and Tobagonian Female Poverty Correlation Chart
The statistical analysis conducted on geographies consisting of 172,266,194 people shows a slight positive correlation between the proportion of Immigrants from Burma/Myanmar and poverty level among females in the United States with a correlation coefficient (R) of 0.059 and weighted average of 15.4%. Similarly, the statistical analysis conducted on geographies consisting of 219,692,358 people shows a slight positive correlation between the proportion of Trinidadians and Tobagonians and poverty level among females in the United States with a correlation coefficient (R) of 0.067 and weighted average of 15.4%, a difference of 0.50%.
Female Poverty Correlation Summary
| Measurement | Immigrants from Burma/Myanmar | Trinidadian and Tobagonian |
| Minimum | 6.5% | 2.0% |
| Maximum | 36.2% | 32.1% |
| Range | 29.7% | 30.1% |
| Mean | 17.0% | 14.8% |
| Median | 15.8% | 13.9% |
| Interquartile 25% (IQ1) | 13.2% | 11.9% |
| Interquartile 75% (IQ3) | 19.2% | 16.1% |
| Interquartile Range (IQR) | 6.1% | 4.2% |
| Standard Deviation (Sample) | 6.4% | 5.5% |
| Standard Deviation (Population) | 6.4% | 5.4% |
Demographics Similar to Immigrants from Burma/Myanmar and Trinidadians and Tobagonians by Female Poverty
In terms of female poverty, the demographic groups most similar to Immigrants from Burma/Myanmar are Immigrants from Trinidad and Tobago (15.4%, a difference of 0.030%), Immigrants from Western Africa (15.3%, a difference of 0.19%), Salvadoran (15.3%, a difference of 0.23%), Liberian (15.4%, a difference of 0.26%), and Immigrants from Ghana (15.3%, a difference of 0.37%). Similarly, the demographic groups most similar to Trinidadians and Tobagonians are Liberian (15.4%, a difference of 0.24%), Ottawa (15.5%, a difference of 0.31%), Immigrants from Trinidad and Tobago (15.4%, a difference of 0.53%), Jamaican (15.5%, a difference of 0.61%), and Immigrants from Western Africa (15.3%, a difference of 0.69%).
| Demographics | Rating | Rank | Female Poverty |
| Nicaraguans | 0.3 /100 | #243 | Tragic 15.3% |
| Ecuadorians | 0.3 /100 | #244 | Tragic 15.3% |
| Spanish American Indians | 0.3 /100 | #245 | Tragic 15.3% |
| Cubans | 0.3 /100 | #246 | Tragic 15.3% |
| Potawatomi | 0.3 /100 | #247 | Tragic 15.3% |
| Immigrants | Ghana | 0.3 /100 | #248 | Tragic 15.3% |
| Salvadorans | 0.3 /100 | #249 | Tragic 15.3% |
| Immigrants | Western Africa | 0.3 /100 | #250 | Tragic 15.3% |
| Immigrants | Trinidad and Tobago | 0.3 /100 | #251 | Tragic 15.4% |
| Immigrants | Burma/Myanmar | 0.3 /100 | #252 | Tragic 15.4% |
| Liberians | 0.2 /100 | #253 | Tragic 15.4% |
| Trinidadians and Tobagonians | 0.2 /100 | #254 | Tragic 15.4% |
| Ottawa | 0.2 /100 | #255 | Tragic 15.5% |
| Jamaicans | 0.2 /100 | #256 | Tragic 15.5% |
| Immigrants | Jamaica | 0.1 /100 | #257 | Tragic 15.6% |
| Shoshone | 0.1 /100 | #258 | Tragic 15.6% |
| Cape Verdeans | 0.1 /100 | #259 | Tragic 15.6% |
| Immigrants | Guyana | 0.1 /100 | #260 | Tragic 15.6% |
| Guyanese | 0.1 /100 | #261 | Tragic 15.6% |
| Mexican American Indians | 0.1 /100 | #262 | Tragic 15.6% |
| Cherokee | 0.1 /100 | #263 | Tragic 15.6% |