Zip Codes with the Highest Percentage of Population Employed in Sales & Related in Scranton, PA
RELATED REPORTS & OPTIONS
Sales & Related
Scranton
Compare Zip Codes
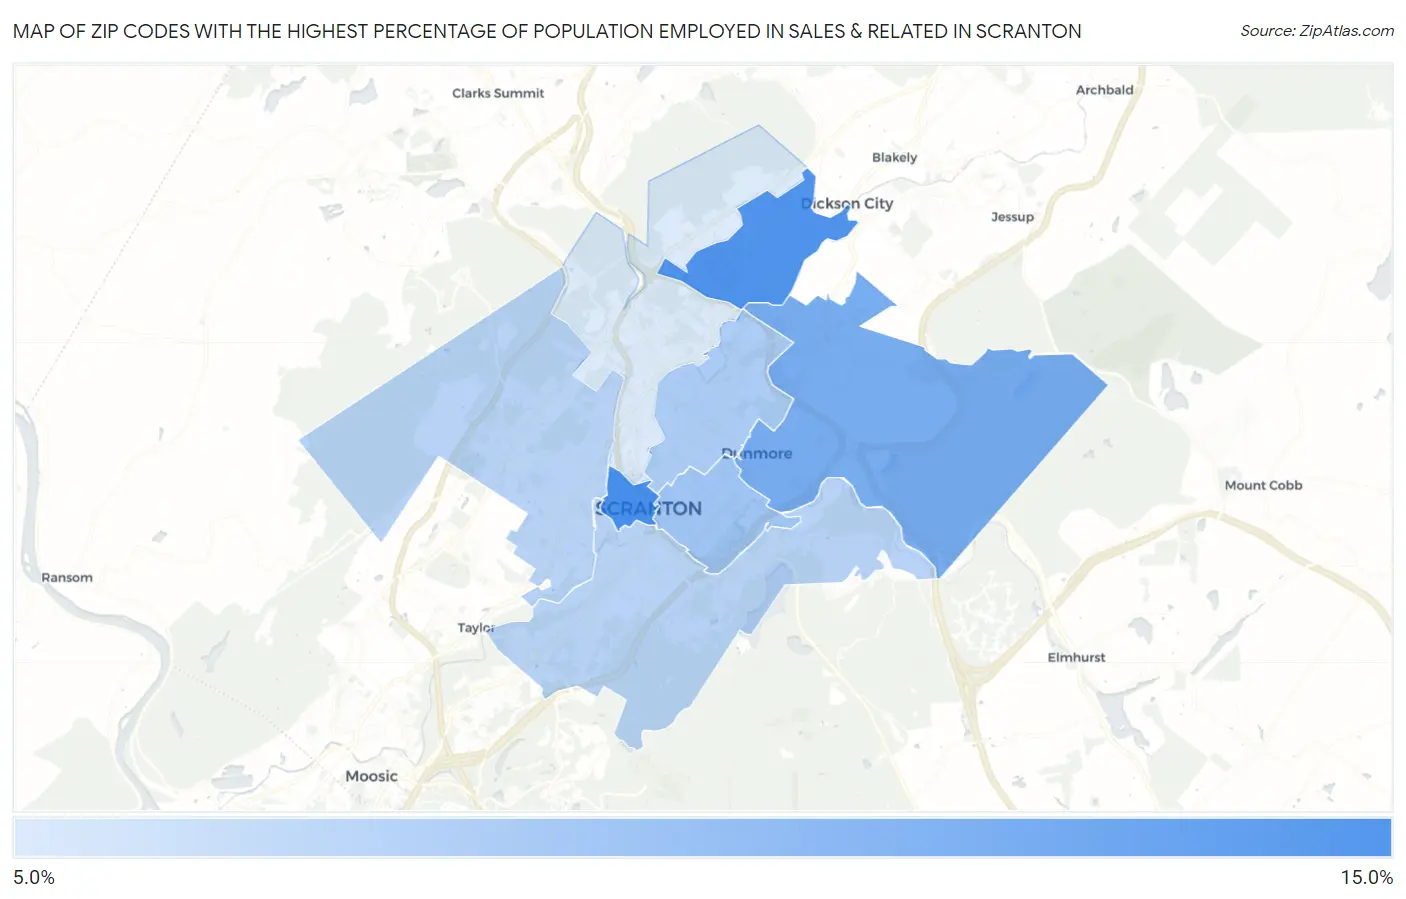
Map of Zip Codes with the Highest Percentage of Population Employed in Sales & Related in Scranton
8.5%
11.7%
Zip Codes with the Highest Percentage of Population Employed in Sales & Related in Scranton, PA
| Zip Code | % Employed | vs State | vs National | |
| 1. | 18503 | 11.7% | 9.1%(+2.56)#320 | 9.6%(+2.10)#6,603 |
| 2. | 18519 | 11.6% | 9.1%(+2.42)#333 | 9.6%(+1.97)#6,880 |
| 3. | 18512 | 10.7% | 9.1%(+1.53)#425 | 9.6%(+1.08)#9,064 |
| 4. | 18510 | 9.8% | 9.1%(+0.641)#571 | 9.6%(+0.187)#11,742 |
| 5. | 18509 | 9.5% | 9.1%(+0.360)#625 | 9.6%(-0.094)#12,741 |
| 6. | 18505 | 9.3% | 9.1%(+0.153)#666 | 9.6%(-0.301)#13,448 |
| 7. | 18504 | 9.3% | 9.1%(+0.119)#675 | 9.6%(-0.335)#13,555 |
| 8. | 18508 | 8.5% | 9.1%(-0.645)#828 | 9.6%(-1.10)#16,364 |
1
Common Questions
What are the Top 5 Zip Codes with the Highest Percentage of Population Employed in Sales & Related in Scranton, PA?
Top 5 Zip Codes with the Highest Percentage of Population Employed in Sales & Related in Scranton, PA are:
What zip code has the Highest Percentage of Population Employed in Sales & Related in Scranton, PA?
18503 has the Highest Percentage of Population Employed in Sales & Related in Scranton, PA with 11.7%.
What is the Percentage of Population Employed in Sales & Related in Scranton, PA?
Percentage of Population Employed in Sales & Related in Scranton is 9.1%.
What is the Percentage of Population Employed in Sales & Related in Pennsylvania?
Percentage of Population Employed in Sales & Related in Pennsylvania is 9.1%.
What is the Percentage of Population Employed in Sales & Related in the United States?
Percentage of Population Employed in Sales & Related in the United States is 9.6%.