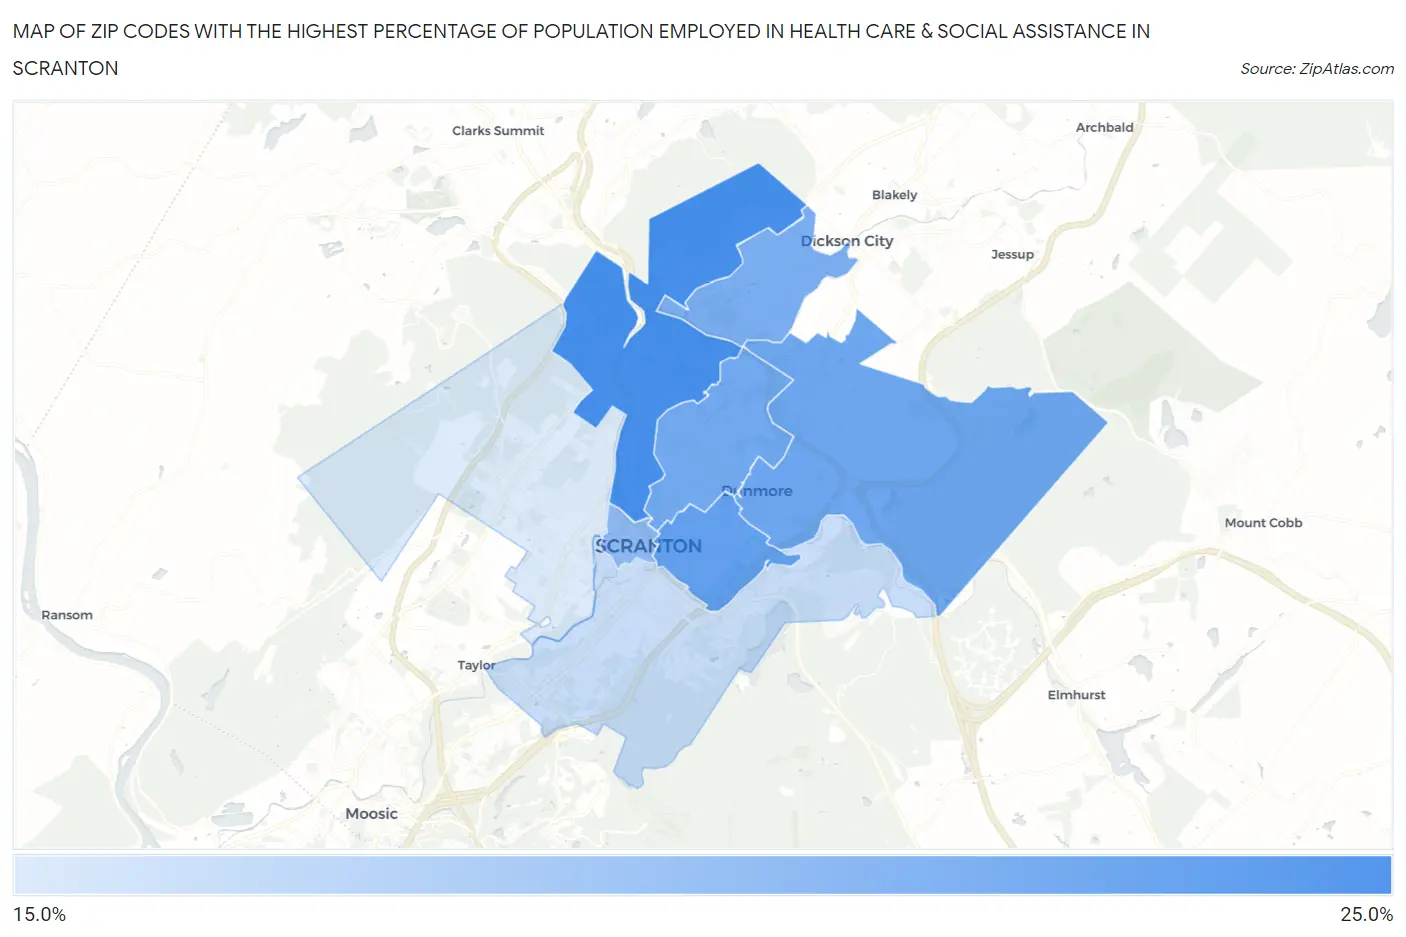
Zip Codes with the Highest Percentage of Population Employed in Health Care & Social Assistance in Scranton, PA
RELATED REPORTS & OPTIONS
Health Care & Social Assistance
Scranton
Compare Zip Codes
Map of Zip Codes with the Highest Percentage of Population Employed in Health Care & Social Assistance in Scranton
0.0%
25.0%
Zip Codes with the Highest Percentage of Population Employed in Health Care & Social Assistance in Scranton, PA
| Zip Code | % Employed | vs State | vs National | |
| 1. | 18508 | 22.3% | 16.8%(+5.51)#250 | 13.9%(+8.35)#2,653 |
| 2. | 18510 | 21.3% | 16.8%(+4.56)#297 | 13.9%(+7.40)#3,148 |
| 3. | 18512 | 20.9% | 16.8%(+4.15)#323 | 13.9%(+6.99)#3,428 |
| 4. | 18509 | 20.8% | 16.8%(+4.01)#331 | 13.9%(+6.85)#3,517 |
| 5. | 18519 | 20.5% | 16.8%(+3.76)#355 | 13.9%(+6.60)#3,695 |
| 6. | 18503 | 19.9% | 16.8%(+3.09)#401 | 13.9%(+5.93)#4,179 |
| 7. | 18505 | 17.8% | 16.8%(+1.04)#604 | 13.9%(+3.88)#6,440 |
| 8. | 18504 | 17.1% | 16.8%(+0.374)#685 | 13.9%(+3.21)#7,484 |
1
Common Questions
What are the Top 5 Zip Codes with the Highest Percentage of Population Employed in Health Care & Social Assistance in Scranton, PA?
Top 5 Zip Codes with the Highest Percentage of Population Employed in Health Care & Social Assistance in Scranton, PA are:
What zip code has the Highest Percentage of Population Employed in Health Care & Social Assistance in Scranton, PA?
18508 has the Highest Percentage of Population Employed in Health Care & Social Assistance in Scranton, PA with 22.3%.
What is the Percentage of Population Employed in Health Care & Social Assistance in Scranton, PA?
Percentage of Population Employed in Health Care & Social Assistance in Scranton is 19.1%.
What is the Percentage of Population Employed in Health Care & Social Assistance in Pennsylvania?
Percentage of Population Employed in Health Care & Social Assistance in Pennsylvania is 16.8%.
What is the Percentage of Population Employed in Health Care & Social Assistance in the United States?
Percentage of Population Employed in Health Care & Social Assistance in the United States is 13.9%.