Zip Codes with the Highest Percentage of Hispanic or Latino Population in Scranton, PA
RELATED REPORTS & OPTIONS
Hispanic or Latino
Scranton
Compare Zip Codes
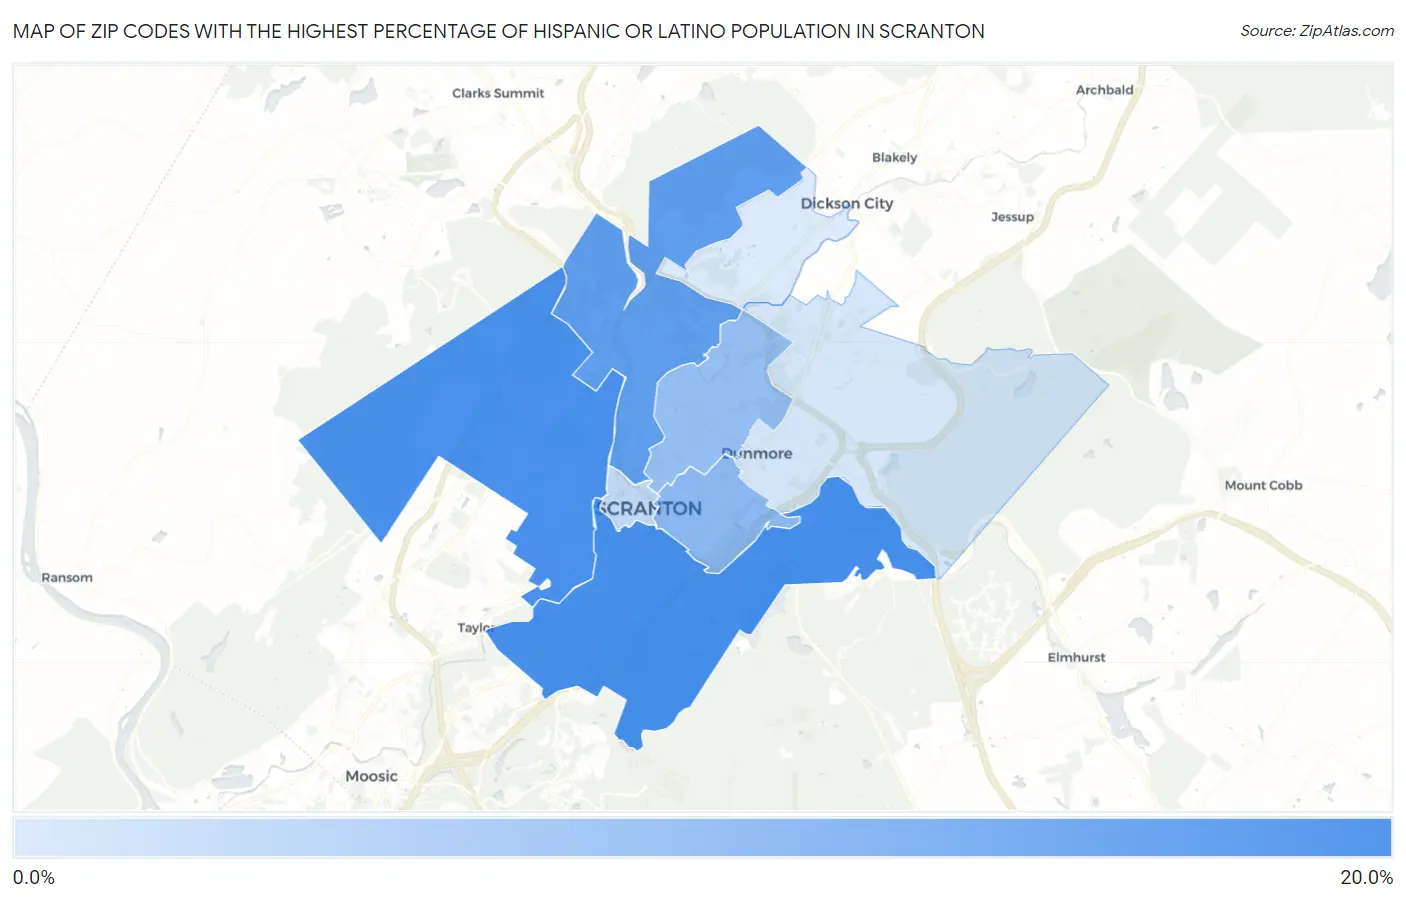
Map of Zip Codes with the Highest Percentage of Hispanic or Latino Population in Scranton
3.6%
18.9%
Zip Codes with the Highest Percentage of Hispanic or Latino Population in Scranton, PA
| Zip Code | Hispanic or Latino | vs State | vs National | |
| 1. | 18505 | 18.9% | 8.1%(+10.8)#78 | 18.7%(+0.257)#5,086 |
| 2. | 18504 | 18.8% | 8.1%(+10.7)#81 | 18.7%(+0.129)#5,117 |
| 3. | 18508 | 16.1% | 8.1%(+7.94)#95 | 18.7%(-2.58)#5,950 |
| 4. | 18510 | 11.6% | 8.1%(+3.47)#140 | 18.7%(-7.06)#7,968 |
| 5. | 18509 | 10.6% | 8.1%(+2.48)#157 | 18.7%(-8.05)#8,507 |
| 6. | 18503 | 6.1% | 8.1%(-1.98)#313 | 18.7%(-12.5)#12,623 |
| 7. | 18512 | 4.3% | 8.1%(-3.78)#440 | 18.7%(-14.3)#15,464 |
| 8. | 18519 | 3.6% | 8.1%(-4.55)#511 | 18.7%(-15.1)#16,990 |
1
Common Questions
What are the Top 5 Zip Codes with the Highest Percentage of Hispanic or Latino Population in Scranton, PA?
Top 5 Zip Codes with the Highest Percentage of Hispanic or Latino Population in Scranton, PA are:
What zip code has the Highest Percentage of Hispanic or Latino Population in Scranton, PA?
18505 has the Highest Percentage of Hispanic or Latino Population in Scranton, PA with 18.9%.
What is the Percentage of Hispanic or Latino Population in Scranton, PA?
Percentage of Hispanic or Latino Population in Scranton is 16.1%.
What is the Percentage of Hispanic or Latino Population in Pennsylvania?
Percentage of Hispanic or Latino Population in Pennsylvania is 8.1%.
What is the Percentage of Hispanic or Latino Population in the United States?
Percentage of Hispanic or Latino Population in the United States is 18.7%.