Zip Codes with the Highest Percentage of Population Employed in Accommodation & Food Services in Lancaster, PA
RELATED REPORTS & OPTIONS
Accommodation & Food Services
Lancaster
Compare Zip Codes
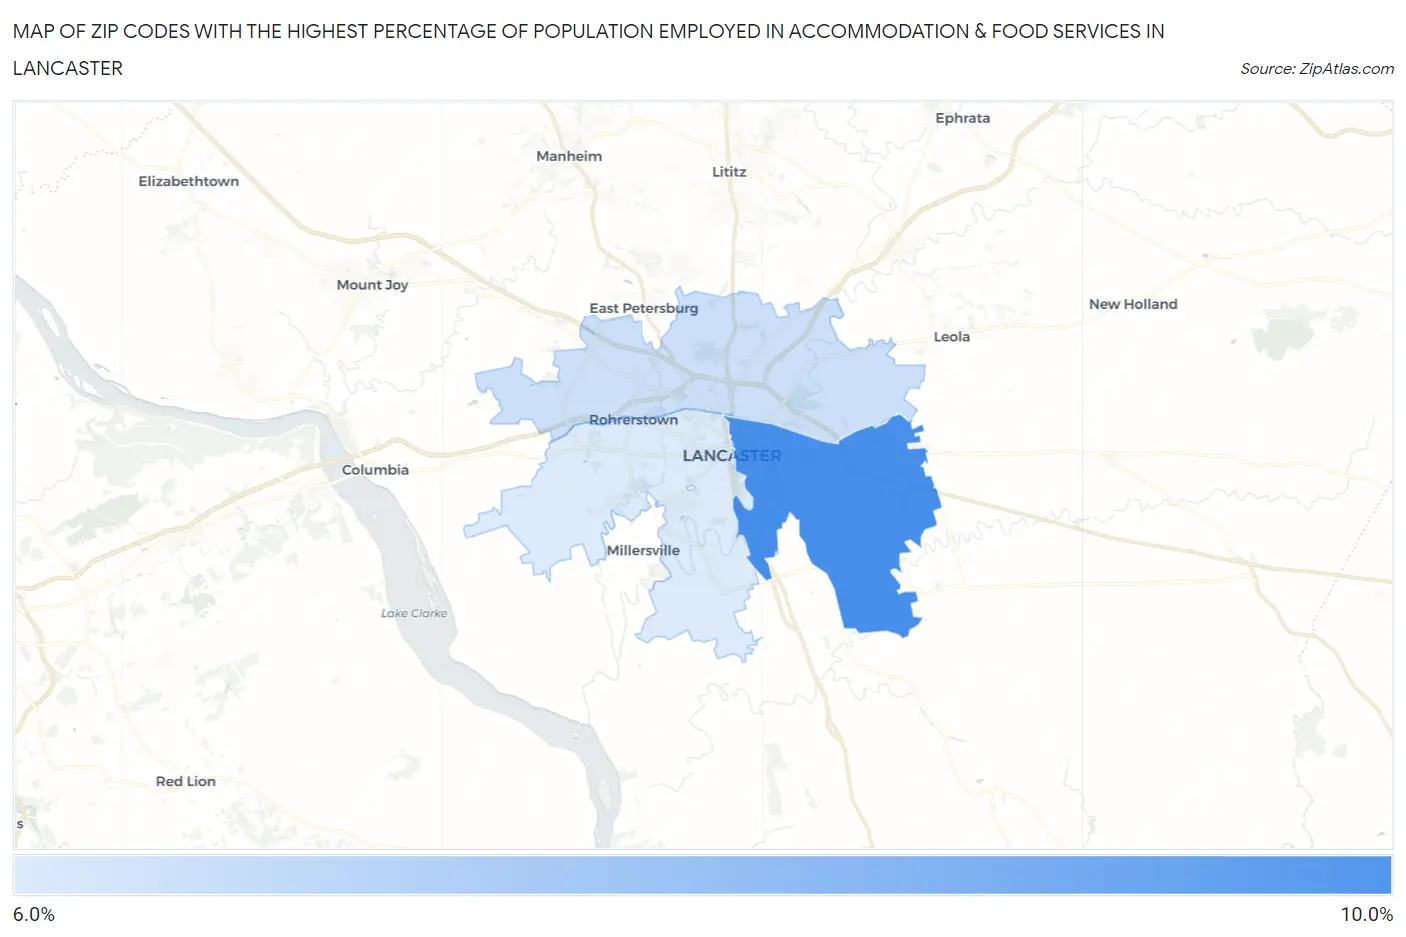
Map of Zip Codes with the Highest Percentage of Population Employed in Accommodation & Food Services in Lancaster
6.4%
8.1%
Zip Codes with the Highest Percentage of Population Employed in Accommodation & Food Services in Lancaster, PA
| Zip Code | % Employed | vs State | vs National | |
| 1. | 17602 | 8.1% | 5.9%(+2.21)#331 | 6.9%(+1.21)#7,633 |
| 2. | 17601 | 6.5% | 5.9%(+0.659)#544 | 6.9%(-0.332)#11,684 |
| 3. | 17603 | 6.4% | 5.9%(+0.476)#581 | 6.9%(-0.515)#12,276 |
1
Common Questions
What are the Top Zip Codes with the Highest Percentage of Population Employed in Accommodation & Food Services in Lancaster, PA?
Top Zip Codes with the Highest Percentage of Population Employed in Accommodation & Food Services in Lancaster, PA are:
What zip code has the Highest Percentage of Population Employed in Accommodation & Food Services in Lancaster, PA?
17602 has the Highest Percentage of Population Employed in Accommodation & Food Services in Lancaster, PA with 8.1%.
What is the Percentage of Population Employed in Accommodation & Food Services in Lancaster, PA?
Percentage of Population Employed in Accommodation & Food Services in Lancaster is 7.9%.
What is the Percentage of Population Employed in Accommodation & Food Services in Pennsylvania?
Percentage of Population Employed in Accommodation & Food Services in Pennsylvania is 5.9%.
What is the Percentage of Population Employed in Accommodation & Food Services in the United States?
Percentage of Population Employed in Accommodation & Food Services in the United States is 6.9%.