Zip Codes with the Highest Percentage of Population Employed in Installation, Maintenance & Repair in Medford, OR
RELATED REPORTS & OPTIONS
Installation, Maintenance & Repair
Medford
Compare Zip Codes
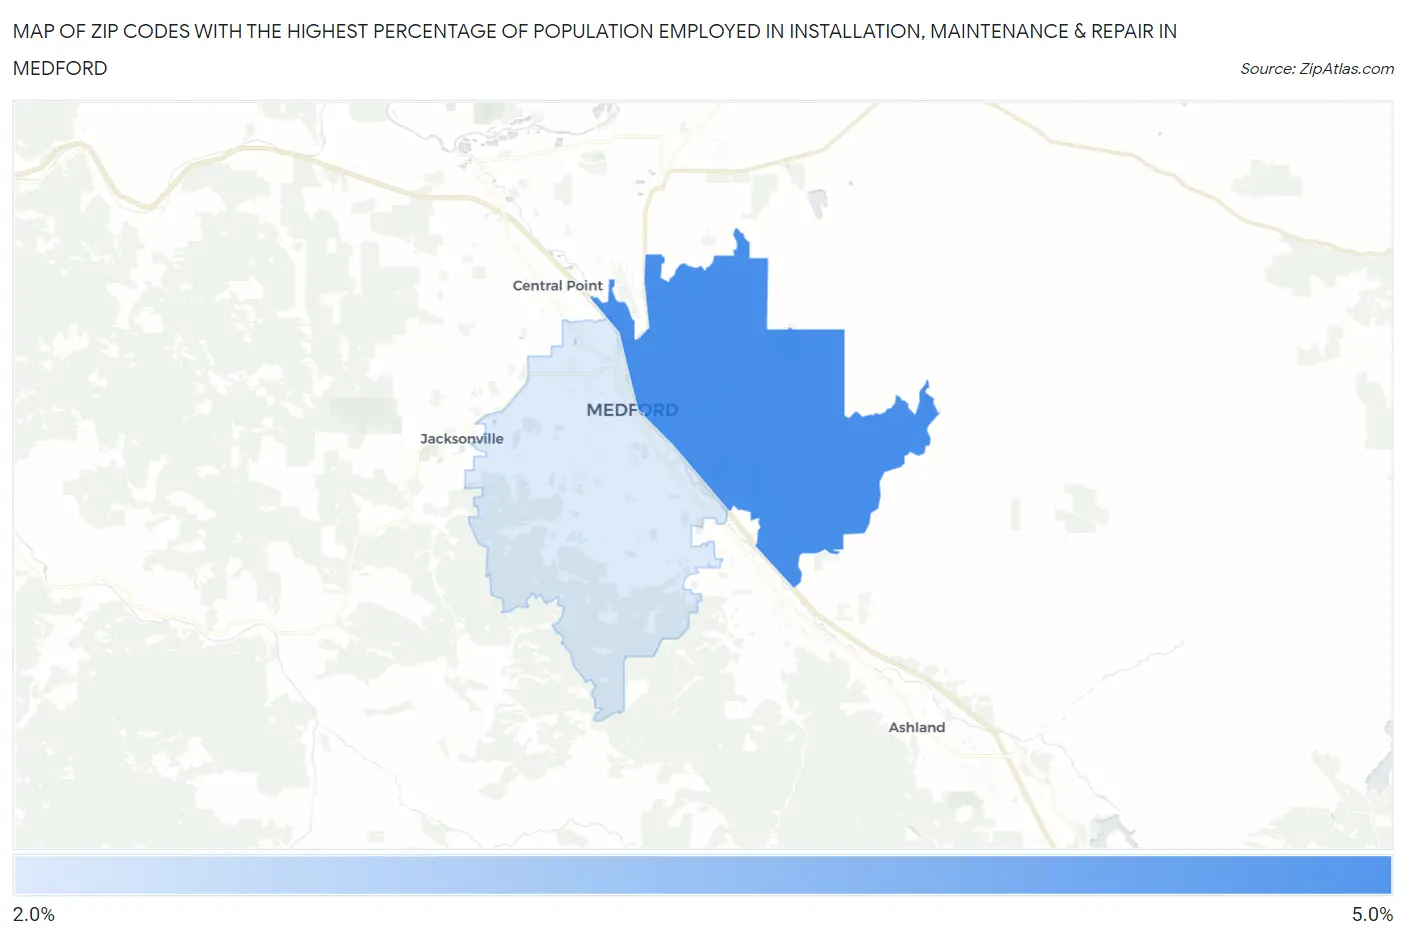
Map of Zip Codes with the Highest Percentage of Population Employed in Installation, Maintenance & Repair in Medford
0.0%
5.0%
Zip Codes with the Highest Percentage of Population Employed in Installation, Maintenance & Repair in Medford, OR
| Zip Code | % Employed | vs State | vs National | |
| 1. | 97504 | 4.3% | 2.7%(+1.54)#102 | 3.1%(+1.19)#11,320 |
| 2. | 97501 | 2.0% | 2.7%(-0.705)#236 | 3.1%(-1.06)#21,972 |
1
Common Questions
What are the Top Zip Codes with the Highest Percentage of Population Employed in Installation, Maintenance & Repair in Medford, OR?
Top Zip Codes with the Highest Percentage of Population Employed in Installation, Maintenance & Repair in Medford, OR are:
What zip code has the Highest Percentage of Population Employed in Installation, Maintenance & Repair in Medford, OR?
97504 has the Highest Percentage of Population Employed in Installation, Maintenance & Repair in Medford, OR with 4.3%.
What is the Percentage of Population Employed in Installation, Maintenance & Repair in Medford, OR?
Percentage of Population Employed in Installation, Maintenance & Repair in Medford is 3.2%.
What is the Percentage of Population Employed in Installation, Maintenance & Repair in Oregon?
Percentage of Population Employed in Installation, Maintenance & Repair in Oregon is 2.7%.
What is the Percentage of Population Employed in Installation, Maintenance & Repair in the United States?
Percentage of Population Employed in Installation, Maintenance & Repair in the United States is 3.1%.