Zip Codes with the Highest Percentage of Population with a Degree in Engineering in Medford, OR
RELATED REPORTS & OPTIONS
Engineering
Medford
Compare Zip Codes
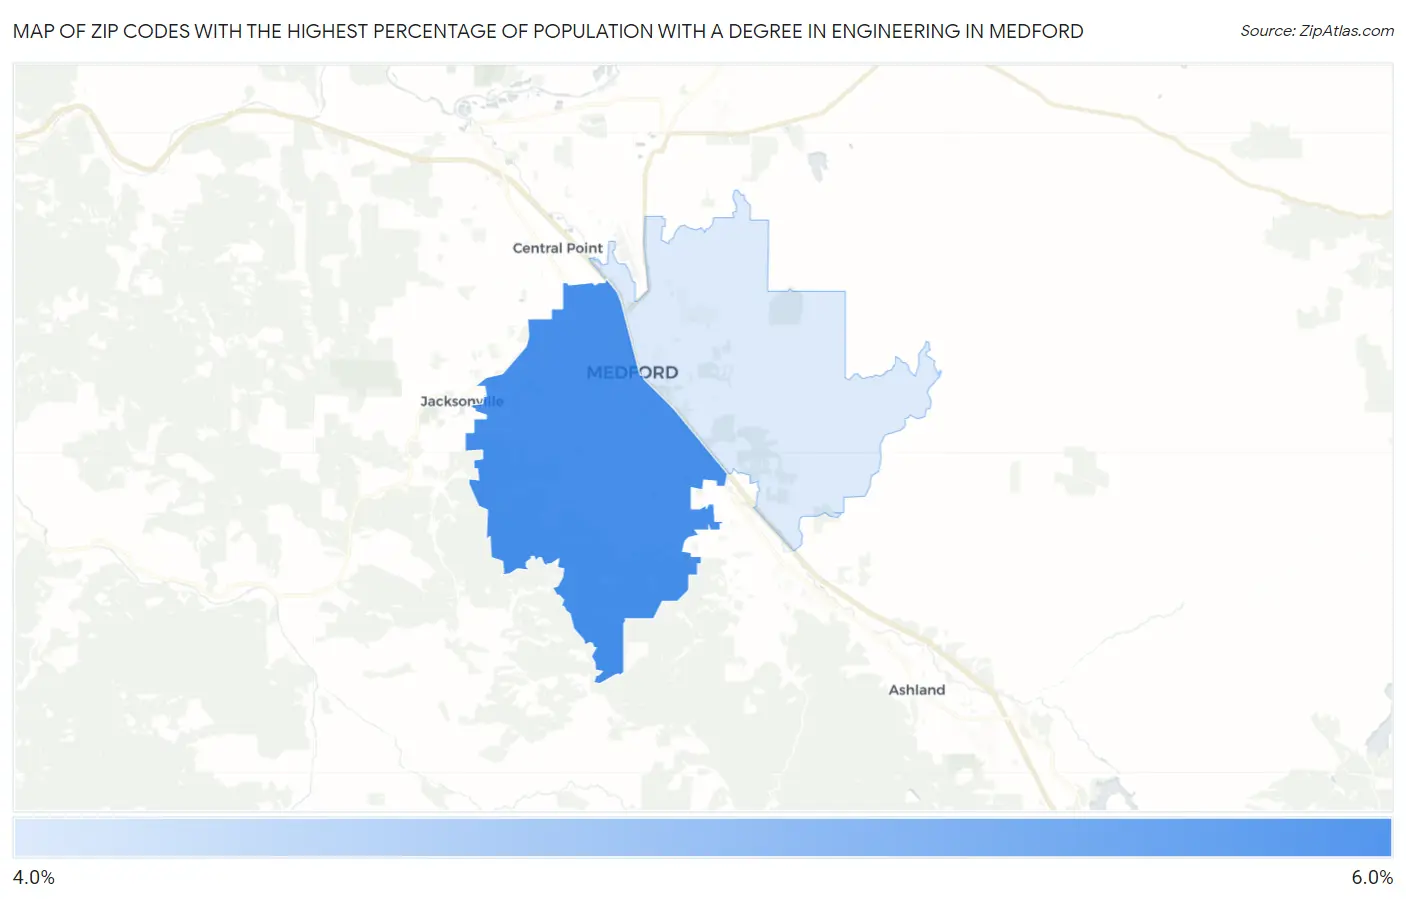
Map of Zip Codes with the Highest Percentage of Population with a Degree in Engineering in Medford
4.0%
6.0%
Zip Codes with the Highest Percentage of Population with a Degree in Engineering in Medford, OR
| Zip Code | % Graduates | vs State | vs National | |
| 1. | 97501 | 6.0% | 7.0%(-1.05)#137 | 7.6%(-1.67)#11,244 |
| 2. | 97504 | 4.0% | 7.0%(-3.01)#209 | 7.6%(-3.63)#16,314 |
1
Common Questions
What are the Top Zip Codes with the Highest Percentage of Population with a Degree in Engineering in Medford, OR?
Top Zip Codes with the Highest Percentage of Population with a Degree in Engineering in Medford, OR are:
What zip code has the Highest Percentage of Population with a Degree in Engineering in Medford, OR?
97501 has the Highest Percentage of Population with a Degree in Engineering in Medford, OR with 6.0%.
What is the Percentage of Population with a Degree in Engineering in Medford, OR?
Percentage of Population with a Degree in Engineering in Medford is 4.5%.
What is the Percentage of Population with a Degree in Engineering in Oregon?
Percentage of Population with a Degree in Engineering in Oregon is 7.0%.
What is the Percentage of Population with a Degree in Engineering in the United States?
Percentage of Population with a Degree in Engineering in the United States is 7.6%.