Zip Codes with the Highest Percentage of Private Company Employees in Stillwater, OK
RELATED REPORTS & OPTIONS
Private Company Employees
Stillwater
Compare Zip Codes
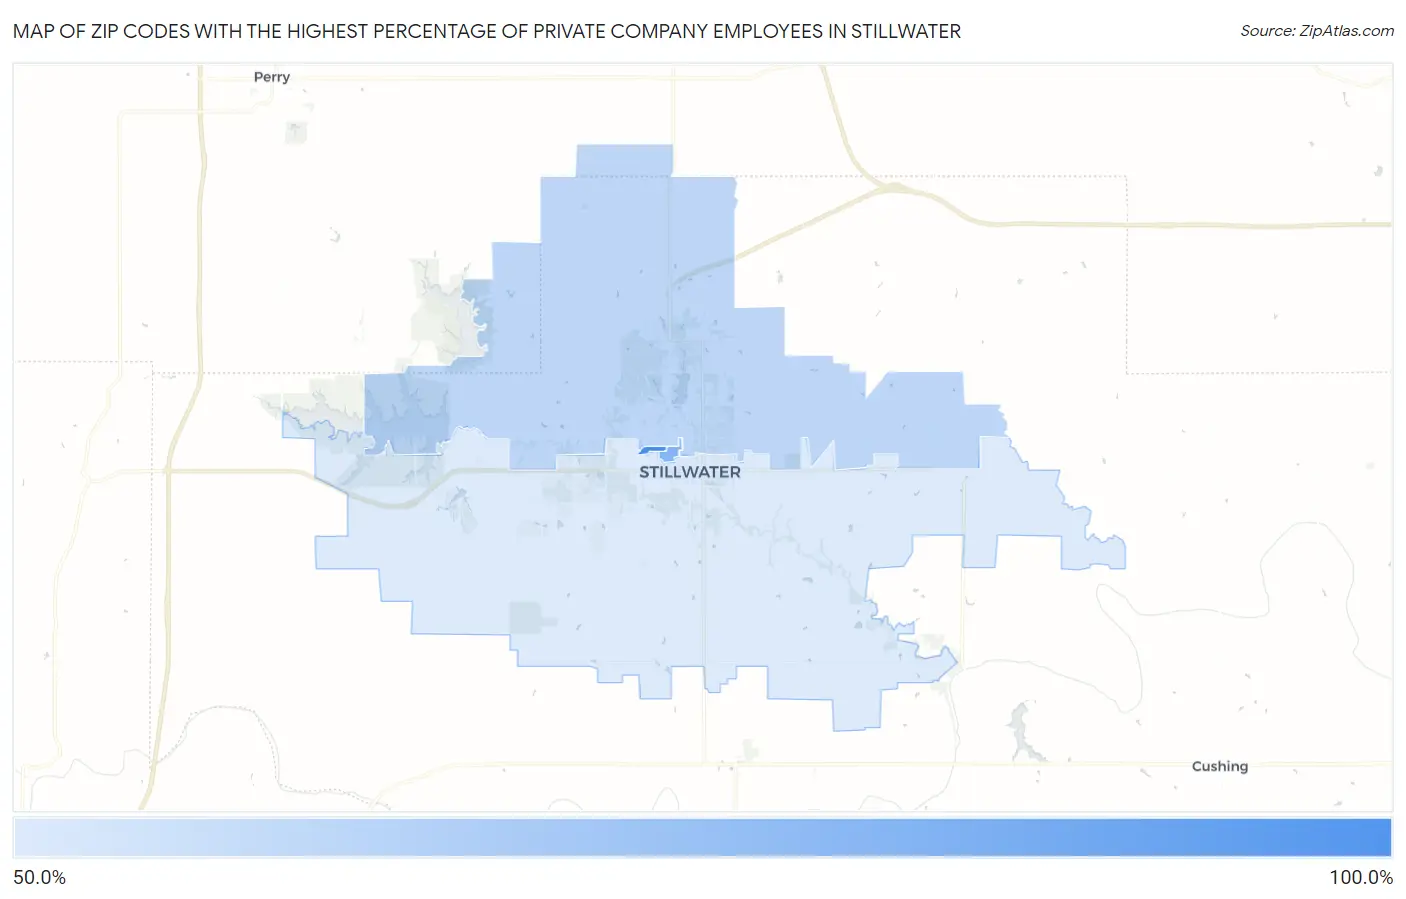
Map of Zip Codes with the Highest Percentage of Private Company Employees in Stillwater
52.8%
87.3%
Zip Codes with the Highest Percentage of Private Company Employees in Stillwater, OK
| Zip Code | % Private Company Employees | vs State | vs National | |
| 1. | 74078 | 87.3% | 64.5%(+22.8)#13 | 66.9%(+20.4)#1,094 |
| 2. | 74077 | 72.2% | 64.5%(+7.70)#96 | 66.9%(+5.30)#7,612 |
| 3. | 74075 | 59.8% | 64.5%(-4.66)#389 | 66.9%(-7.06)#22,578 |
| 4. | 74074 | 52.8% | 64.5%(-11.7)#527 | 66.9%(-14.1)#27,323 |
1
Common Questions
What are the Top 3 Zip Codes with the Highest Percentage of Private Company Employees in Stillwater, OK?
Top 3 Zip Codes with the Highest Percentage of Private Company Employees in Stillwater, OK are:
What zip code has the Highest Percentage of Private Company Employees in Stillwater, OK?
74078 has the Highest Percentage of Private Company Employees in Stillwater, OK with 87.3%.
What is the Percentage of Private Company Employees in Stillwater, OK?
Percentage of Private Company Employees in Stillwater is 54.8%.
What is the Percentage of Private Company Employees in Oklahoma?
Percentage of Private Company Employees in Oklahoma is 64.5%.
What is the Percentage of Private Company Employees in the United States?
Percentage of Private Company Employees in the United States is 66.9%.