Zip Codes with the Highest Percentage of Population with a Degree in Engineering in Cleveland, OH
RELATED REPORTS & OPTIONS
Engineering
Cleveland
Compare Zip Codes
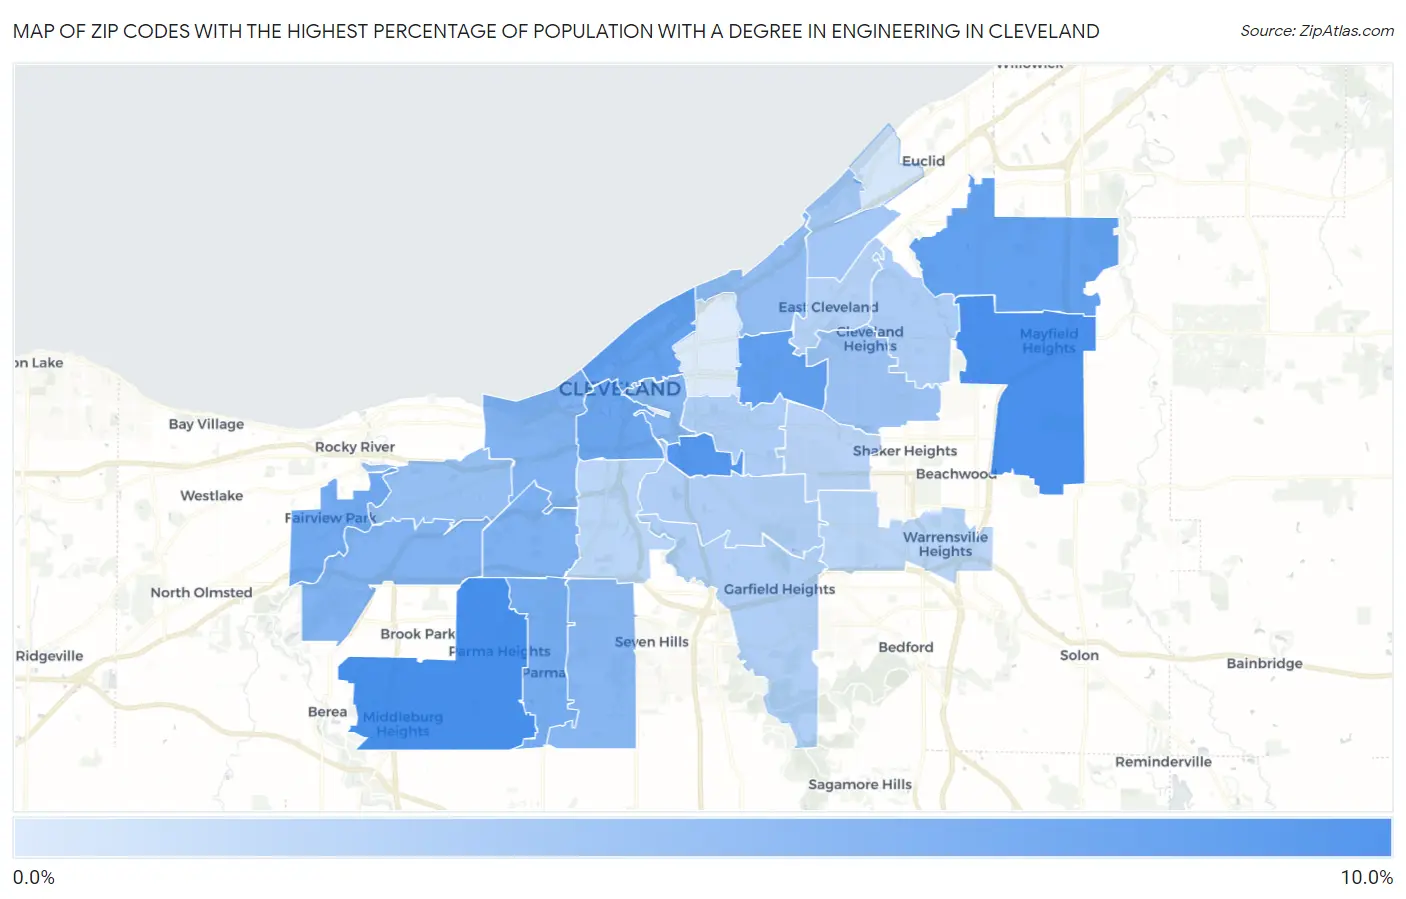
Map of Zip Codes with the Highest Percentage of Population with a Degree in Engineering in Cleveland
1.1%
9.4%
Zip Codes with the Highest Percentage of Population with a Degree in Engineering in Cleveland, OH
| Zip Code | % Graduates | vs State | vs National | |
| 1. | 44130 | 9.4% | 7.4%(+2.05)#224 | 7.6%(+1.78)#5,057 |
| 2. | 44124 | 9.3% | 7.4%(+1.95)#229 | 7.6%(+1.68)#5,173 |
| 3. | 44127 | 8.6% | 7.4%(+1.24)#275 | 7.6%(+0.968)#6,126 |
| 4. | 44106 | 8.0% | 7.4%(+0.598)#317 | 7.6%(+0.325)#7,142 |
| 5. | 44143 | 7.9% | 7.4%(+0.499)#327 | 7.6%(+0.226)#7,324 |
| 6. | 44114 | 7.7% | 7.4%(+0.281)#344 | 7.6%(+0.007)#7,728 |
| 7. | 44113 | 7.3% | 7.4%(-0.093)#371 | 7.6%(-0.366)#8,425 |
| 8. | 44126 | 6.9% | 7.4%(-0.486)#394 | 7.6%(-0.759)#9,237 |
| 9. | 44129 | 6.9% | 7.4%(-0.513)#395 | 7.6%(-0.787)#9,281 |
| 10. | 44144 | 6.3% | 7.4%(-1.04)#442 | 7.6%(-1.31)#10,363 |
| 11. | 44102 | 6.2% | 7.4%(-1.22)#464 | 7.6%(-1.50)#10,828 |
| 12. | 44135 | 6.1% | 7.4%(-1.26)#472 | 7.6%(-1.54)#10,929 |
| 13. | 44115 | 5.8% | 7.4%(-1.54)#496 | 7.6%(-1.81)#11,600 |
| 14. | 44134 | 5.7% | 7.4%(-1.64)#507 | 7.6%(-1.92)#11,867 |
| 15. | 44108 | 5.1% | 7.4%(-2.26)#565 | 7.6%(-2.53)#13,381 |
| 16. | 44111 | 4.9% | 7.4%(-2.43)#579 | 7.6%(-2.71)#13,857 |
| 17. | 44118 | 4.6% | 7.4%(-2.74)#614 | 7.6%(-3.01)#14,701 |
| 18. | 44110 | 4.2% | 7.4%(-3.19)#657 | 7.6%(-3.46)#15,837 |
| 19. | 44104 | 3.7% | 7.4%(-3.63)#696 | 7.6%(-3.90)#17,015 |
| 20. | 44121 | 3.7% | 7.4%(-3.65)#700 | 7.6%(-3.93)#17,093 |
| 21. | 44105 | 3.6% | 7.4%(-3.82)#718 | 7.6%(-4.10)#17,535 |
| 22. | 44125 | 3.4% | 7.4%(-3.95)#725 | 7.6%(-4.23)#17,840 |
| 23. | 44112 | 3.3% | 7.4%(-4.06)#738 | 7.6%(-4.33)#18,104 |
| 24. | 44120 | 3.1% | 7.4%(-4.31)#758 | 7.6%(-4.59)#18,748 |
| 25. | 44109 | 3.0% | 7.4%(-4.40)#765 | 7.6%(-4.67)#18,944 |
| 26. | 44128 | 3.0% | 7.4%(-4.40)#766 | 7.6%(-4.68)#18,965 |
| 27. | 44119 | 1.6% | 7.4%(-5.75)#835 | 7.6%(-6.02)#21,632 |
| 28. | 44103 | 1.1% | 7.4%(-6.27)#860 | 7.6%(-6.54)#22,449 |
1
Common Questions
What are the Top 10 Zip Codes with the Highest Percentage of Population with a Degree in Engineering in Cleveland, OH?
Top 10 Zip Codes with the Highest Percentage of Population with a Degree in Engineering in Cleveland, OH are:
What zip code has the Highest Percentage of Population with a Degree in Engineering in Cleveland, OH?
44130 has the Highest Percentage of Population with a Degree in Engineering in Cleveland, OH with 9.4%.
What is the Percentage of Population with a Degree in Engineering in Cleveland, OH?
Percentage of Population with a Degree in Engineering in Cleveland is 4.8%.
What is the Percentage of Population with a Degree in Engineering in Ohio?
Percentage of Population with a Degree in Engineering in Ohio is 7.4%.
What is the Percentage of Population with a Degree in Engineering in the United States?
Percentage of Population with a Degree in Engineering in the United States is 7.6%.