Zip Codes with the Highest Percentage of Population with a Degree in Social Sciences in Highland, MI
RELATED REPORTS & OPTIONS
Social Sciences
Highland
Compare Zip Codes
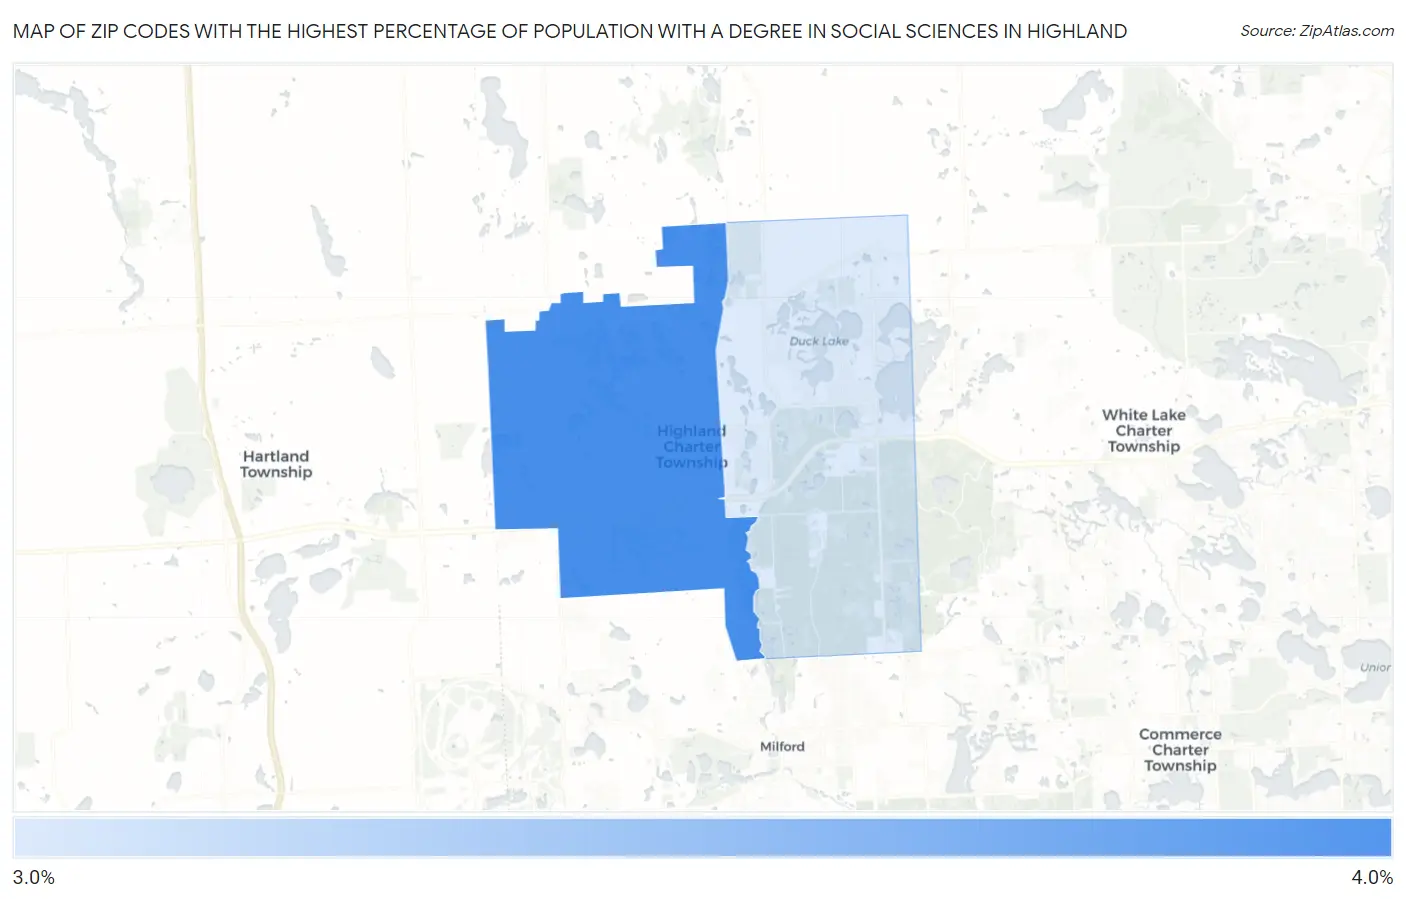
Map of Zip Codes with the Highest Percentage of Population with a Degree in Social Sciences in Highland
3.4%
4.0%
Zip Codes with the Highest Percentage of Population with a Degree in Social Sciences in Highland, MI
| Zip Code | % Graduates | vs State | vs National | |
| 1. | 48357 | 4.0% | 5.9%(-1.88)#537 | 8.1%(-4.09)#18,256 |
| 2. | 48356 | 3.4% | 5.9%(-2.43)#616 | 8.1%(-4.64)#19,504 |
1
Common Questions
What are the Top Zip Codes with the Highest Percentage of Population with a Degree in Social Sciences in Highland, MI?
Top Zip Codes with the Highest Percentage of Population with a Degree in Social Sciences in Highland, MI are:
What zip code has the Highest Percentage of Population with a Degree in Social Sciences in Highland, MI?
48357 has the Highest Percentage of Population with a Degree in Social Sciences in Highland, MI with 4.0%.
What is the Percentage of Population with a Degree in Social Sciences in Michigan?
Percentage of Population with a Degree in Social Sciences in Michigan is 5.9%.
What is the Percentage of Population with a Degree in Social Sciences in the United States?
Percentage of Population with a Degree in Social Sciences in the United States is 8.1%.