Zip Codes with the Highest Percentage of Population Employed in Accommodation & Food Services in Highland, MI
RELATED REPORTS & OPTIONS
Accommodation & Food Services
Highland
Compare Zip Codes
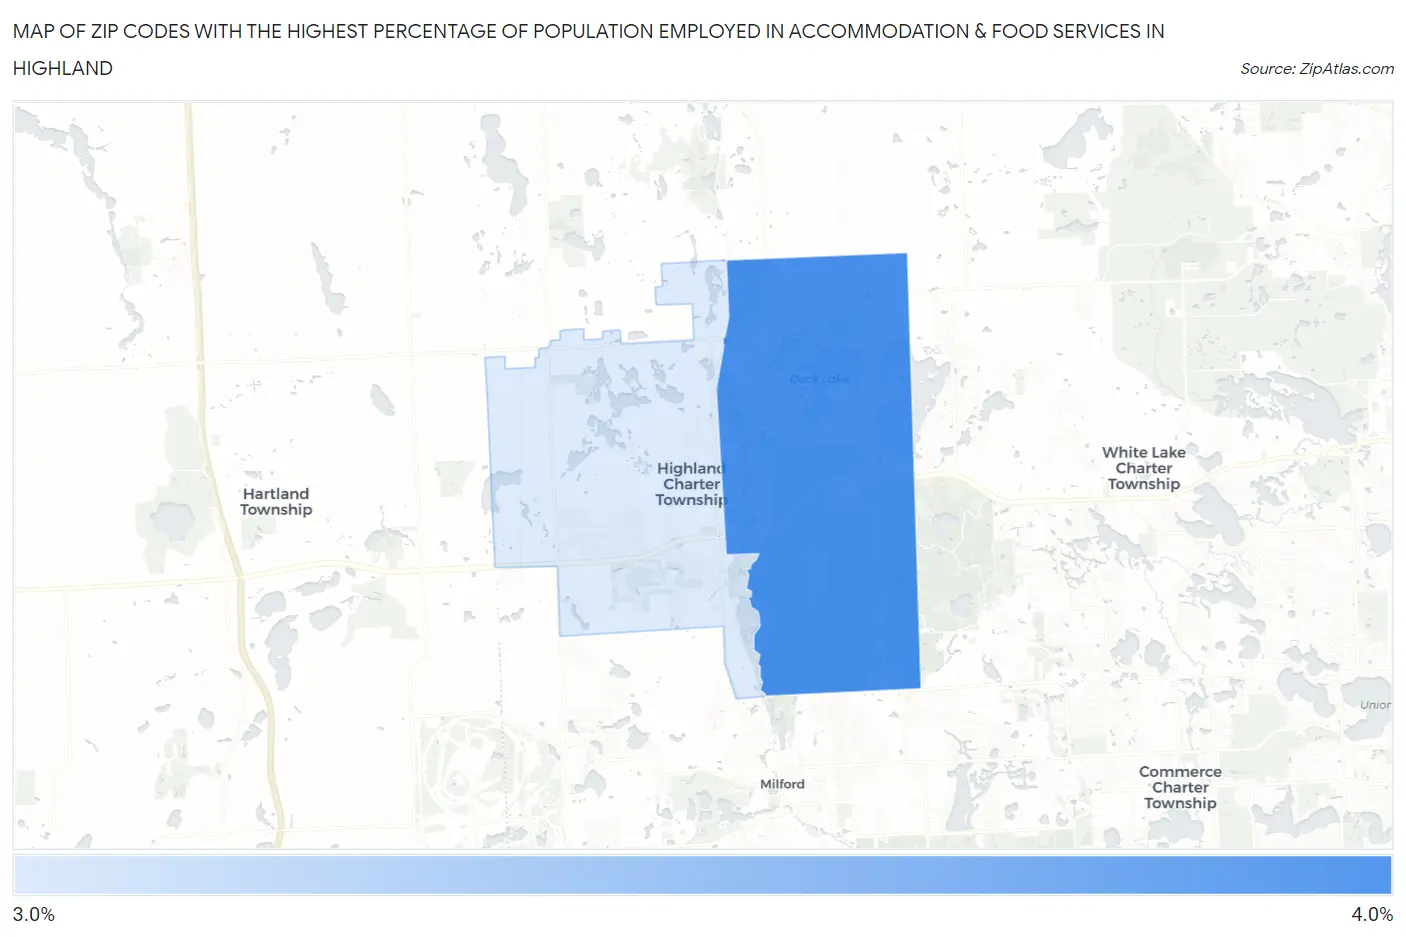
Map of Zip Codes with the Highest Percentage of Population Employed in Accommodation & Food Services in Highland
3.5%
3.7%
Zip Codes with the Highest Percentage of Population Employed in Accommodation & Food Services in Highland, MI
| Zip Code | % Employed | vs State | vs National | |
| 1. | 48356 | 3.7% | 7.1%(-3.40)#798 | 6.9%(-3.20)#21,192 |
| 2. | 48357 | 3.5% | 7.1%(-3.60)#816 | 6.9%(-3.39)#21,824 |
1
Common Questions
What are the Top Zip Codes with the Highest Percentage of Population Employed in Accommodation & Food Services in Highland, MI?
Top Zip Codes with the Highest Percentage of Population Employed in Accommodation & Food Services in Highland, MI are:
What zip code has the Highest Percentage of Population Employed in Accommodation & Food Services in Highland, MI?
48356 has the Highest Percentage of Population Employed in Accommodation & Food Services in Highland, MI with 3.7%.
What is the Percentage of Population Employed in Accommodation & Food Services in Michigan?
Percentage of Population Employed in Accommodation & Food Services in Michigan is 7.1%.
What is the Percentage of Population Employed in Accommodation & Food Services in the United States?
Percentage of Population Employed in Accommodation & Food Services in the United States is 6.9%.