Zip Codes with the Highest Percentage of Self-Employed / Not Incorporated in Highland, MI
RELATED REPORTS & OPTIONS
Self-Employed / Not Incorporated
Highland
Compare Zip Codes
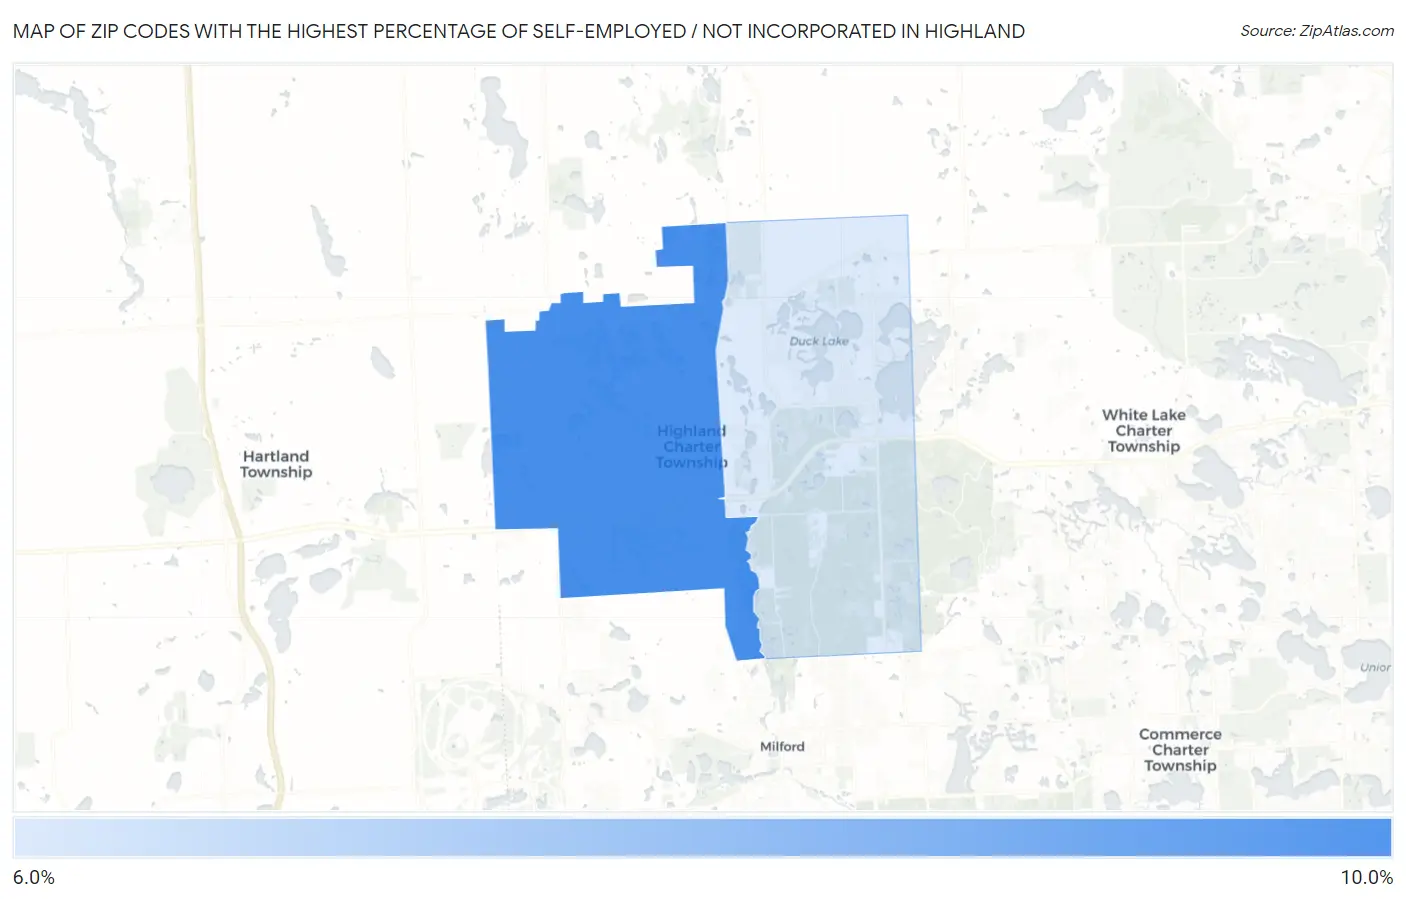
Map of Zip Codes with the Highest Percentage of Self-Employed / Not Incorporated in Highland
0.0%
10.0%
Zip Codes with the Highest Percentage of Self-Employed / Not Incorporated in Highland, MI
| Zip Code | % Self-Employed / Not Incorporated | vs State | vs National | |
| 1. | 48357 | 8.4% | 4.9%(+3.50)#185 | 5.8%(+2.62)#9,783 |
| 2. | 48356 | 6.6% | 4.9%(+1.69)#326 | 5.8%(+0.807)#14,063 |
1
Common Questions
What are the Top Zip Codes with the Highest Percentage of Self-Employed / Not Incorporated in Highland, MI?
Top Zip Codes with the Highest Percentage of Self-Employed / Not Incorporated in Highland, MI are:
What zip code has the Highest Percentage of Self-Employed / Not Incorporated in Highland, MI?
48357 has the Highest Percentage of Self-Employed / Not Incorporated in Highland, MI with 8.4%.
What is the Percentage of Self-Employed / Not Incorporated in Michigan?
Percentage of Self-Employed / Not Incorporated in Michigan is 4.9%.
What is the Percentage of Self-Employed / Not Incorporated in the United States?
Percentage of Self-Employed / Not Incorporated in the United States is 5.8%.