Zip Codes with the Highest Percentage of Population with a Degree in Liberal Arts and History in Highland, MI
RELATED REPORTS & OPTIONS
Liberal Arts and History
Highland
Compare Zip Codes
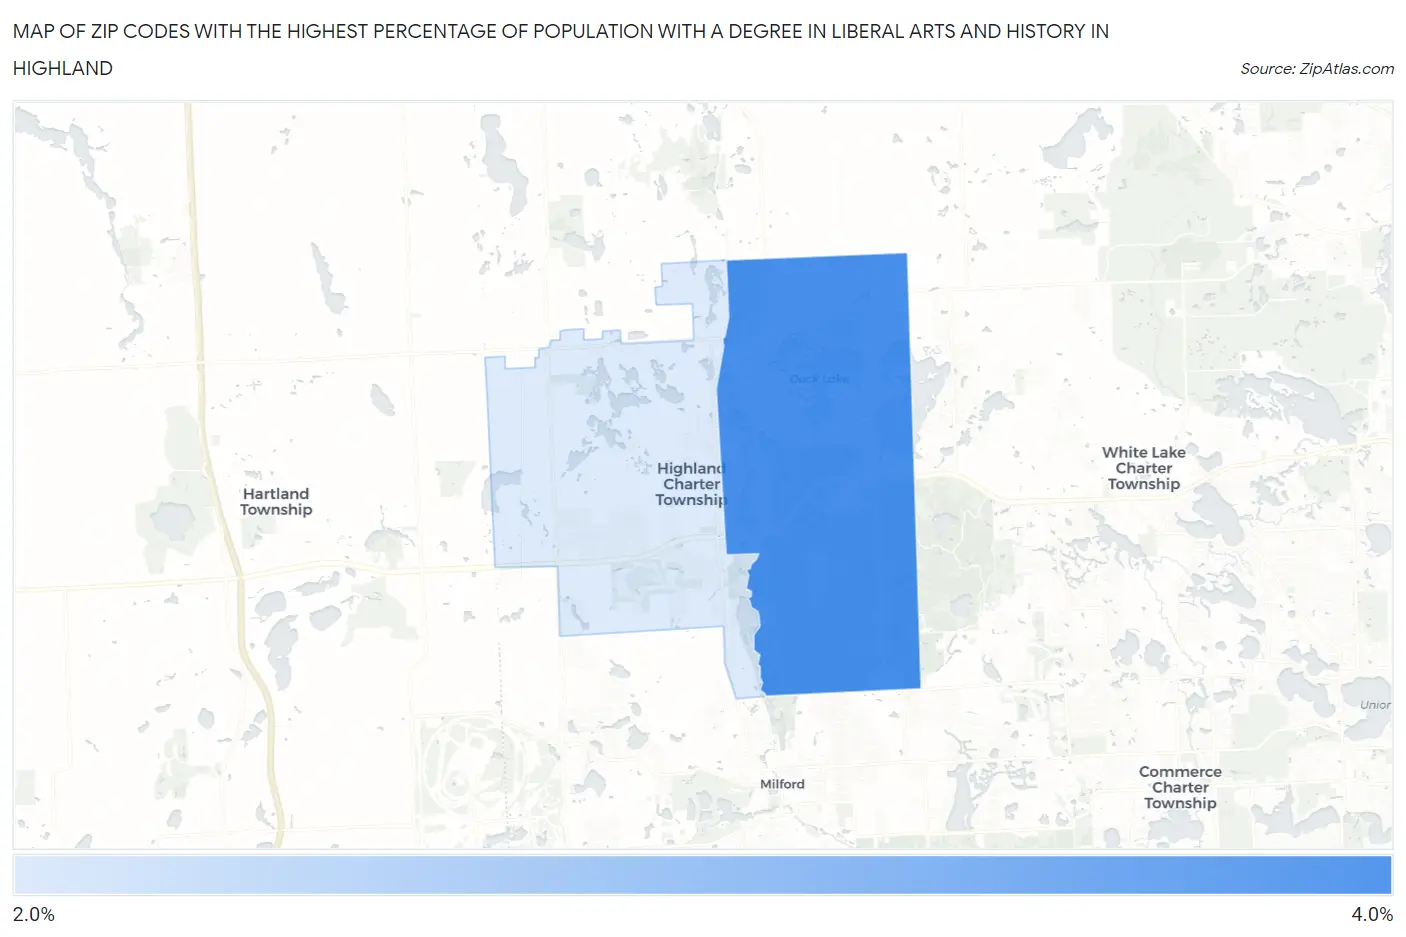
Map of Zip Codes with the Highest Percentage of Population with a Degree in Liberal Arts and History in Highland
2.2%
3.6%
Zip Codes with the Highest Percentage of Population with a Degree in Liberal Arts and History in Highland, MI
| Zip Code | % Graduates | vs State | vs National | |
| 1. | 48356 | 3.6% | 4.0%(-0.420)#485 | 4.9%(-1.31)#16,371 |
| 2. | 48357 | 2.2% | 4.0%(-1.78)#708 | 4.9%(-2.67)#20,830 |
1
Common Questions
What are the Top Zip Codes with the Highest Percentage of Population with a Degree in Liberal Arts and History in Highland, MI?
Top Zip Codes with the Highest Percentage of Population with a Degree in Liberal Arts and History in Highland, MI are:
What zip code has the Highest Percentage of Population with a Degree in Liberal Arts and History in Highland, MI?
48356 has the Highest Percentage of Population with a Degree in Liberal Arts and History in Highland, MI with 3.6%.
What is the Percentage of Population with a Degree in Liberal Arts and History in Michigan?
Percentage of Population with a Degree in Liberal Arts and History in Michigan is 4.0%.
What is the Percentage of Population with a Degree in Liberal Arts and History in the United States?
Percentage of Population with a Degree in Liberal Arts and History in the United States is 4.9%.