Zip Codes with the Highest Percentage of Population with a Degree in Liberal Arts and History in London, KY
RELATED REPORTS & OPTIONS
Liberal Arts and History
London
Compare Zip Codes
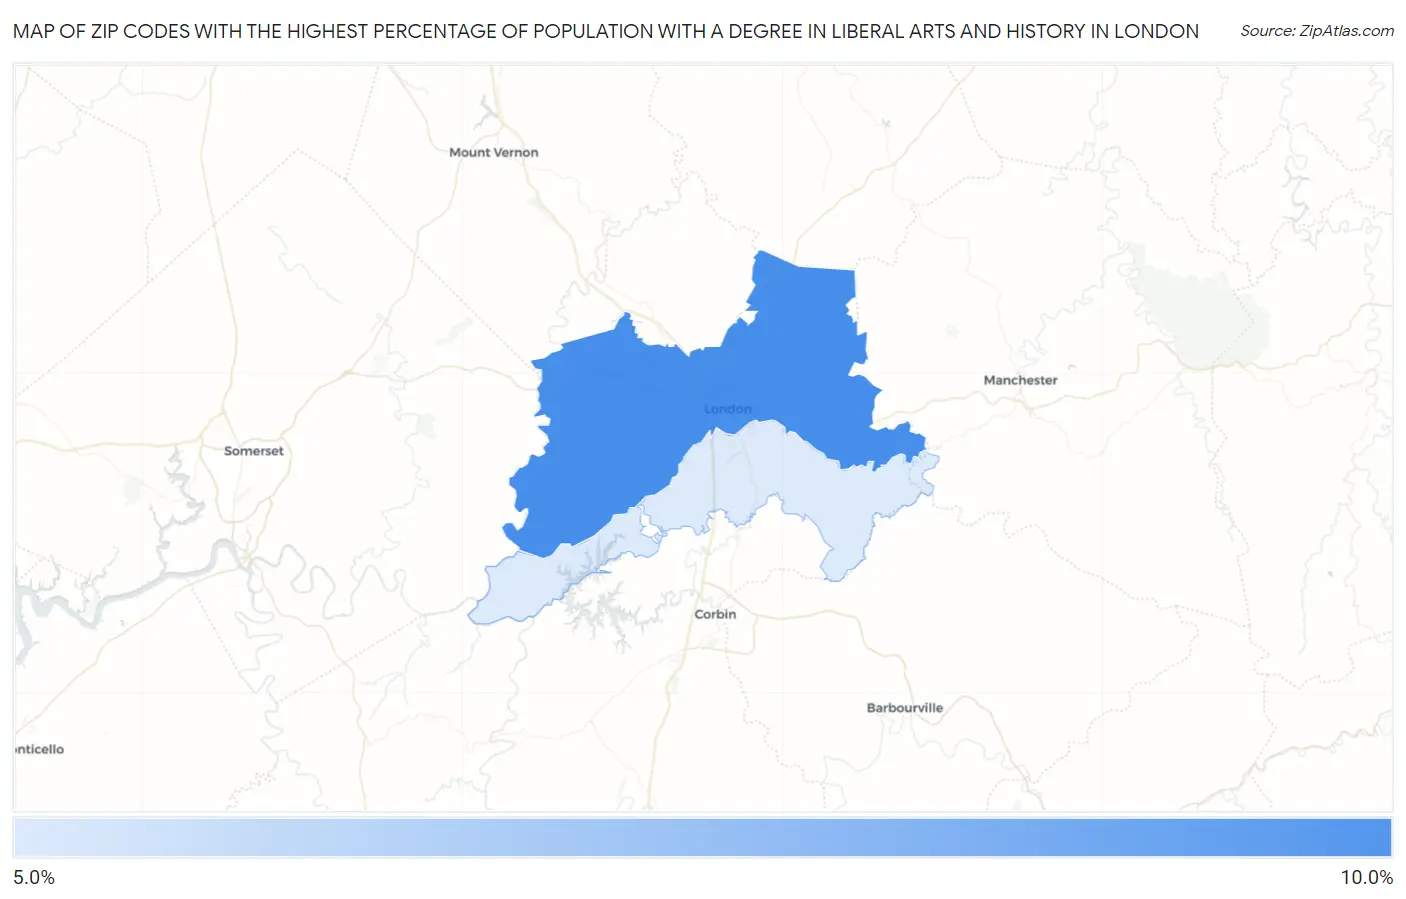
Map of Zip Codes with the Highest Percentage of Population with a Degree in Liberal Arts and History in London
5.2%
8.8%
Zip Codes with the Highest Percentage of Population with a Degree in Liberal Arts and History in London, KY
| Zip Code | % Graduates | vs State | vs National | |
| 1. | 40741 | 8.8% | 5.3%(+3.46)#111 | 4.9%(+3.92)#4,046 |
| 2. | 40744 | 5.2% | 5.3%(-0.129)#214 | 4.9%(+0.329)#10,722 |
1
Common Questions
What are the Top Zip Codes with the Highest Percentage of Population with a Degree in Liberal Arts and History in London, KY?
Top Zip Codes with the Highest Percentage of Population with a Degree in Liberal Arts and History in London, KY are:
What zip code has the Highest Percentage of Population with a Degree in Liberal Arts and History in London, KY?
40741 has the Highest Percentage of Population with a Degree in Liberal Arts and History in London, KY with 8.8%.
What is the Percentage of Population with a Degree in Liberal Arts and History in London, KY?
Percentage of Population with a Degree in Liberal Arts and History in London is 5.5%.
What is the Percentage of Population with a Degree in Liberal Arts and History in Kentucky?
Percentage of Population with a Degree in Liberal Arts and History in Kentucky is 5.3%.
What is the Percentage of Population with a Degree in Liberal Arts and History in the United States?
Percentage of Population with a Degree in Liberal Arts and History in the United States is 4.9%.