Zip Codes with the Highest Percentage of Population Employed in Architecture & Engineering in London, KY
RELATED REPORTS & OPTIONS
Architecture & Engineering
London
Compare Zip Codes
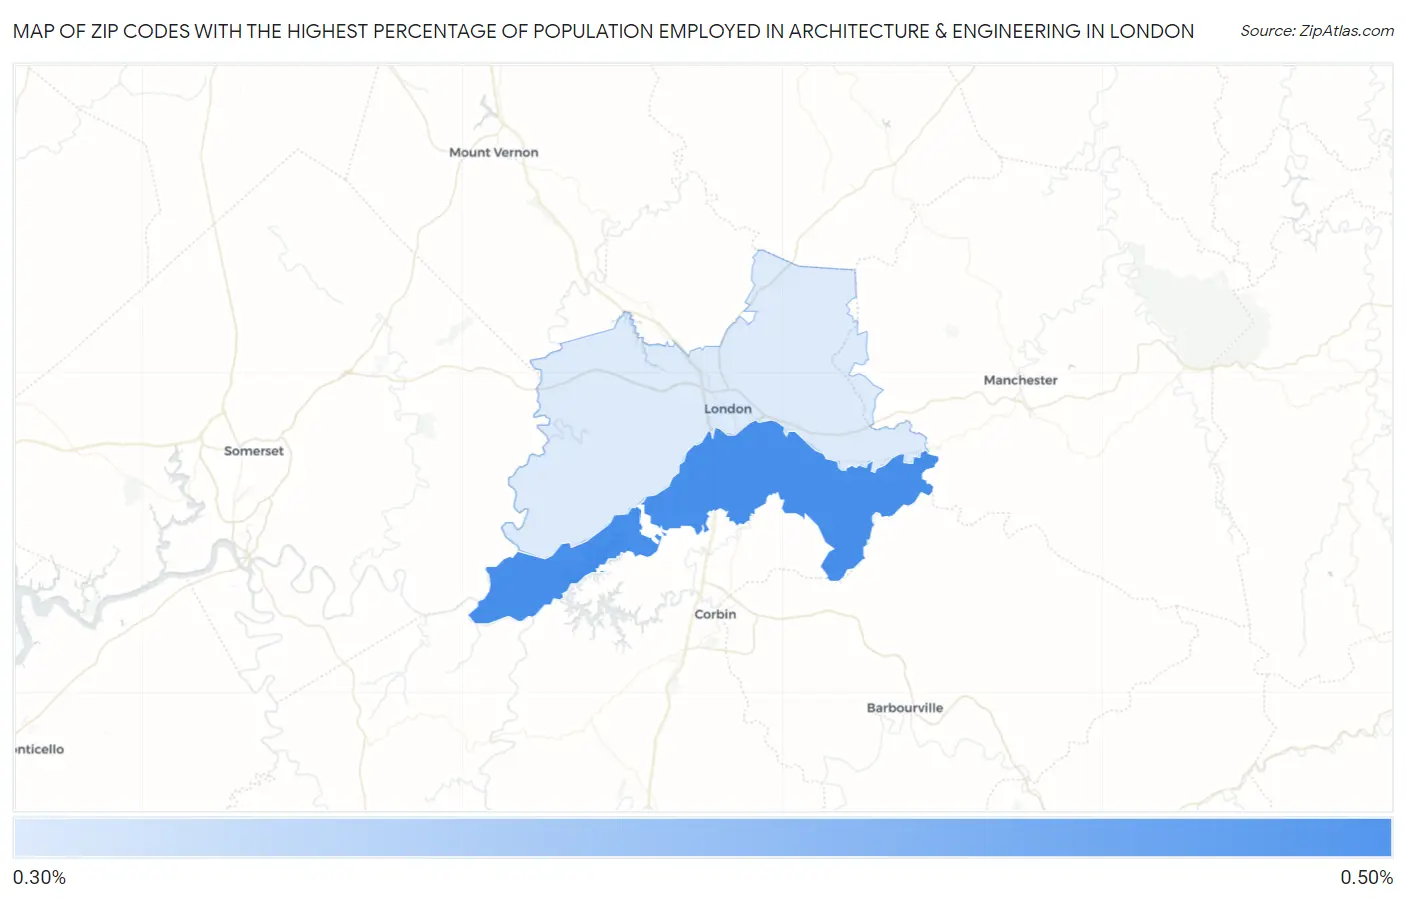
Map of Zip Codes with the Highest Percentage of Population Employed in Architecture & Engineering in London
0.33%
0.44%
Zip Codes with the Highest Percentage of Population Employed in Architecture & Engineering in London, KY
| Zip Code | % Employed | vs State | vs National | |
| 1. | 40744 | 0.44% | 1.7%(-1.26)#310 | 2.1%(-1.71)#20,684 |
| 2. | 40741 | 0.33% | 1.7%(-1.37)#325 | 2.1%(-1.82)#21,371 |
1
Common Questions
What are the Top Zip Codes with the Highest Percentage of Population Employed in Architecture & Engineering in London, KY?
Top Zip Codes with the Highest Percentage of Population Employed in Architecture & Engineering in London, KY are:
What zip code has the Highest Percentage of Population Employed in Architecture & Engineering in London, KY?
40744 has the Highest Percentage of Population Employed in Architecture & Engineering in London, KY with 0.44%.
What is the Percentage of Population Employed in Architecture & Engineering in London, KY?
Percentage of Population Employed in Architecture & Engineering in London is 0.28%.
What is the Percentage of Population Employed in Architecture & Engineering in Kentucky?
Percentage of Population Employed in Architecture & Engineering in Kentucky is 1.7%.
What is the Percentage of Population Employed in Architecture & Engineering in the United States?
Percentage of Population Employed in Architecture & Engineering in the United States is 2.1%.