Zip Codes with the Highest Percentage of Population Employed in Arts, Entertainment & Recreation in Lenexa, KS
RELATED REPORTS & OPTIONS
Arts, Entertainment & Recreation
Lenexa
Compare Zip Codes
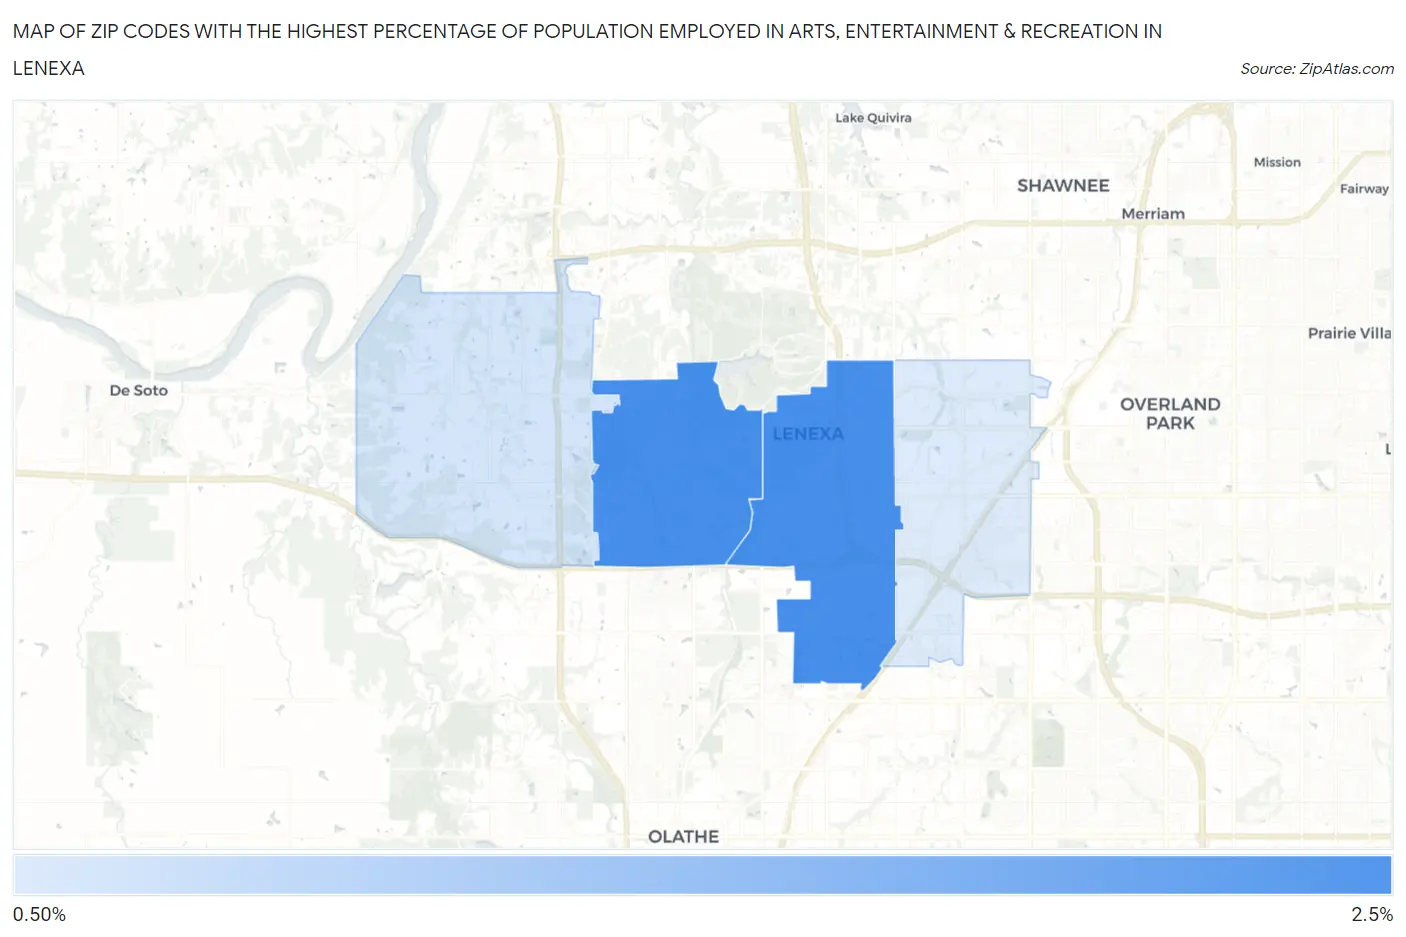
Map of Zip Codes with the Highest Percentage of Population Employed in Arts, Entertainment & Recreation in Lenexa
0.0%
2.5%
Zip Codes with the Highest Percentage of Population Employed in Arts, Entertainment & Recreation in Lenexa, KS
| Zip Code | % Employed | vs State | vs National | |
| 1. | 66220 | 2.1% | 1.7%(+0.327)#123 | 2.1%(-0.009)#9,354 |
| 2. | 66219 | 2.1% | 1.7%(+0.324)#124 | 2.1%(-0.011)#9,361 |
| 3. | 66227 | 1.3% | 1.7%(-0.478)#253 | 2.1%(-0.814)#14,953 |
| 4. | 66215 | 1.2% | 1.7%(-0.538)#258 | 2.1%(-0.873)#15,403 |
1
Common Questions
What are the Top 3 Zip Codes with the Highest Percentage of Population Employed in Arts, Entertainment & Recreation in Lenexa, KS?
Top 3 Zip Codes with the Highest Percentage of Population Employed in Arts, Entertainment & Recreation in Lenexa, KS are:
What zip code has the Highest Percentage of Population Employed in Arts, Entertainment & Recreation in Lenexa, KS?
66220 has the Highest Percentage of Population Employed in Arts, Entertainment & Recreation in Lenexa, KS with 2.1%.
What is the Percentage of Population Employed in Arts, Entertainment & Recreation in Lenexa, KS?
Percentage of Population Employed in Arts, Entertainment & Recreation in Lenexa is 1.6%.
What is the Percentage of Population Employed in Arts, Entertainment & Recreation in Kansas?
Percentage of Population Employed in Arts, Entertainment & Recreation in Kansas is 1.7%.
What is the Percentage of Population Employed in Arts, Entertainment & Recreation in the United States?
Percentage of Population Employed in Arts, Entertainment & Recreation in the United States is 2.1%.