Zip Codes with the Highest Percentage of Population Employed in Arts, Entertainment & Recreation in District Of Columbia
RELATED REPORTS & OPTIONS
Arts, Entertainment & Recreation
District Of Columbia
Compare Zip Codes
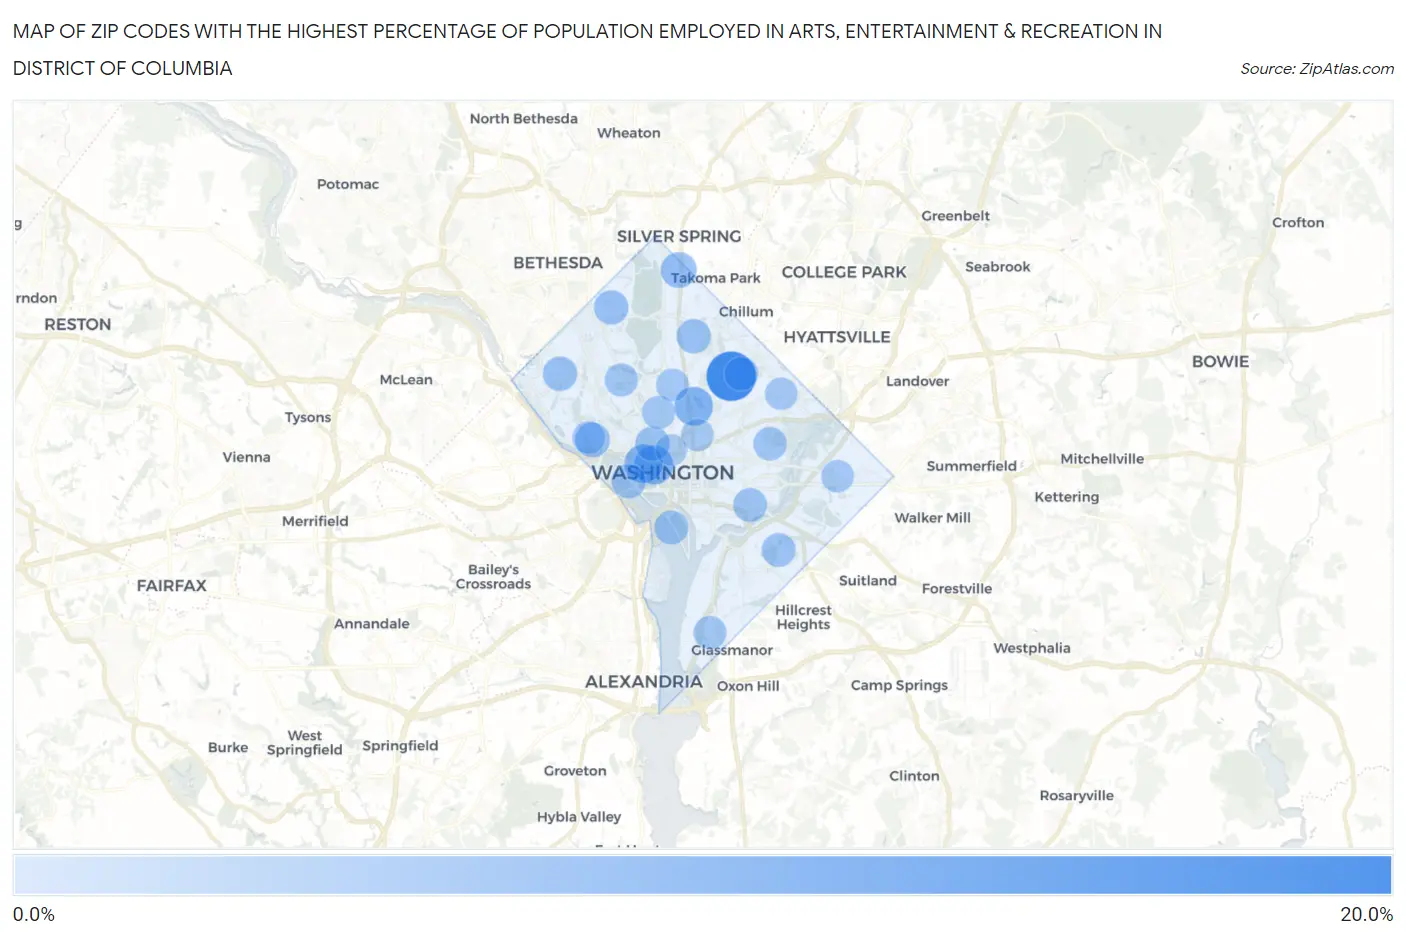
Map of Zip Codes with the Highest Percentage of Population Employed in Arts, Entertainment & Recreation in District Of Columbia
0.0%
20.0%

Zip Codes with the Highest Percentage of Population Employed in Arts, Entertainment & Recreation in District Of Columbia
| Zip Code | % Employed | vs State | vs National | |
| 1. | 20064 | 15.4% | 2.5%(+13.0)#1 | 2.1%(+13.3)#320 |
| 2. | 20006 | 6.9% | 2.5%(+4.43)#2 | 2.1%(+4.80)#1,368 |
| 3. | 20052 | 6.6% | 2.5%(+4.16)#3 | 2.1%(+4.53)#1,454 |
| 4. | 20059 | 6.6% | 2.5%(+4.12)#4 | 2.1%(+4.49)#1,461 |
| 5. | 20012 | 4.3% | 2.5%(+1.85)#5 | 2.1%(+2.22)#2,957 |
| 6. | 20057 | 3.5% | 2.5%(+1.09)#6 | 2.1%(+1.47)#4,035 |
| 7. | 20036 | 3.4% | 2.5%(+0.921)#7 | 2.1%(+1.29)#4,413 |
| 8. | 20016 | 3.2% | 2.5%(+0.765)#8 | 2.1%(+1.14)#4,752 |
| 9. | 20011 | 3.2% | 2.5%(+0.753)#9 | 2.1%(+1.12)#4,788 |
| 10. | 20015 | 3.2% | 2.5%(+0.726)#10 | 2.1%(+1.10)#4,856 |
| 11. | 20037 | 3.2% | 2.5%(+0.713)#11 | 2.1%(+1.08)#4,889 |
| 12. | 20024 | 2.8% | 2.5%(+0.341)#12 | 2.1%(+0.712)#6,022 |
| 13. | 20003 | 2.8% | 2.5%(+0.335)#13 | 2.1%(+0.706)#6,044 |
| 14. | 20020 | 2.8% | 2.5%(+0.328)#14 | 2.1%(+0.699)#6,061 |
| 15. | 20017 | 2.7% | 2.5%(+0.237)#15 | 2.1%(+0.608)#6,399 |
| 16. | 20002 | 2.4% | 2.5%(-0.005)#16 | 2.1%(+0.366)#7,418 |
| 17. | 20009 | 2.2% | 2.5%(-0.210)#17 | 2.1%(+0.161)#8,410 |
| 18. | 20008 | 2.2% | 2.5%(-0.263)#18 | 2.1%(+0.107)#8,701 |
| 19. | 20032 | 2.1% | 2.5%(-0.384)#19 | 2.1%(-0.013)#9,368 |
| 20. | 20010 | 2.0% | 2.5%(-0.449)#20 | 2.1%(-0.078)#9,753 |
| 21. | 20007 | 1.9% | 2.5%(-0.504)#21 | 2.1%(-0.134)#10,089 |
| 22. | 20019 | 1.8% | 2.5%(-0.683)#22 | 2.1%(-0.312)#11,222 |
| 23. | 20018 | 1.8% | 2.5%(-0.700)#23 | 2.1%(-0.329)#11,349 |
| 24. | 20001 | 1.7% | 2.5%(-0.731)#24 | 2.1%(-0.361)#11,572 |
| 25. | 20005 | 1.0% | 2.5%(-1.44)#25 | 2.1%(-1.07)#16,877 |
1
Common Questions
What are the Top 10 Zip Codes with the Highest Percentage of Population Employed in Arts, Entertainment & Recreation in District Of Columbia?
Top 10 Zip Codes with the Highest Percentage of Population Employed in Arts, Entertainment & Recreation in District Of Columbia are:
What zip code has the Highest Percentage of Population Employed in Arts, Entertainment & Recreation in District Of Columbia?
20064 has the Highest Percentage of Population Employed in Arts, Entertainment & Recreation in District Of Columbia with 15.4%.
What is the Percentage of Population Employed in Arts, Entertainment & Recreation in the State of District Of Columbia?
Percentage of Population Employed in Arts, Entertainment & Recreation in District Of Columbia is 2.5%.
What is the Percentage of Population Employed in Arts, Entertainment & Recreation in the United States?
Percentage of Population Employed in Arts, Entertainment & Recreation in the United States is 2.1%.