Zip Codes with the Largest Hispanic or Latino Community in Leawood, KS
RELATED REPORTS & OPTIONS
Hispanic or Latino
Leawood
Compare Zip Codes
Map of Zip Codes with the Largest Hispanic or Latino Community in Leawood
149
558
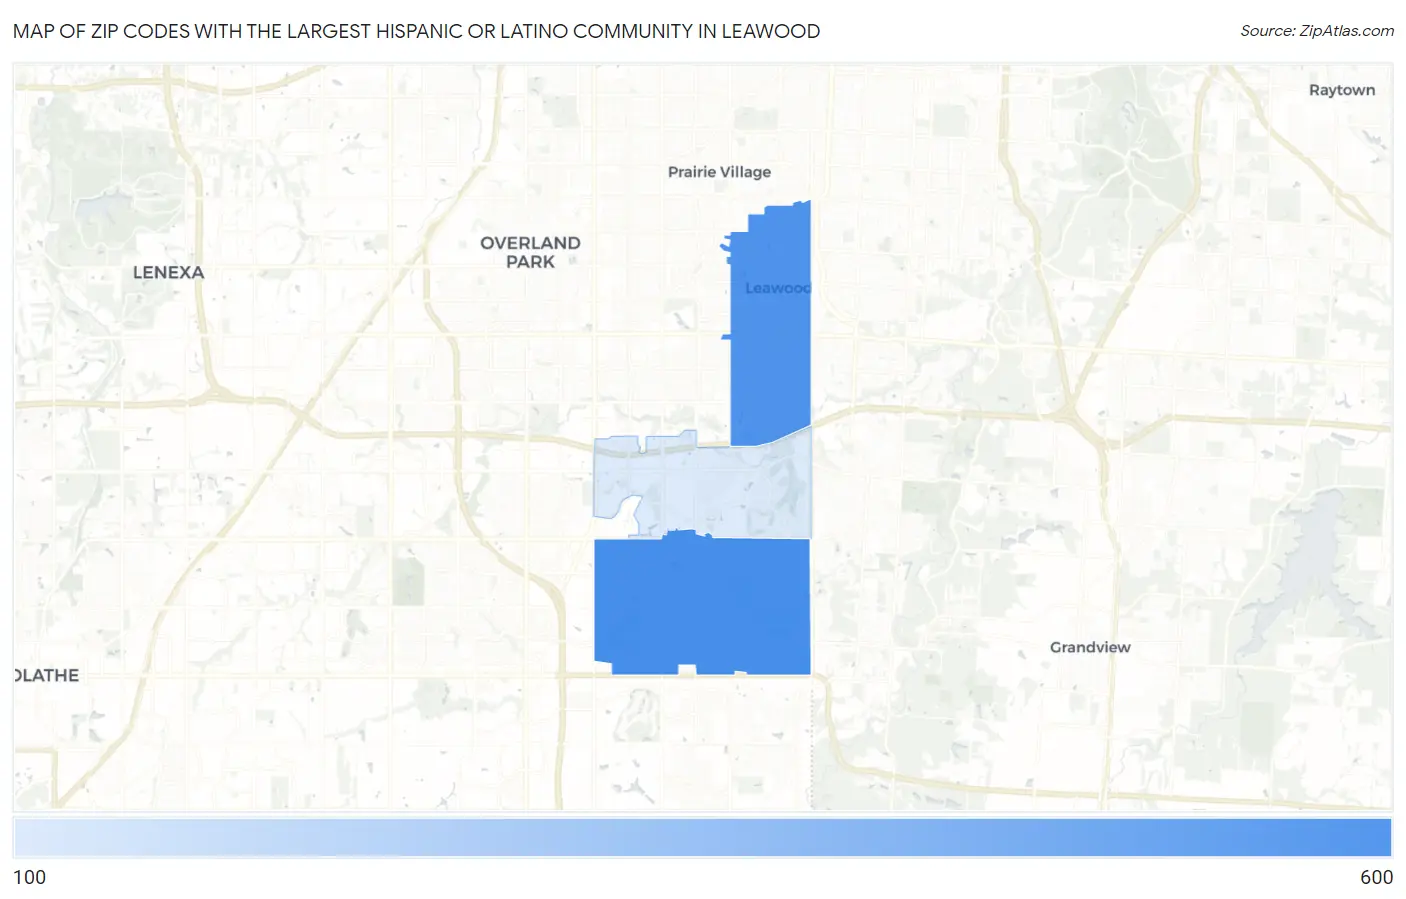
Zip Codes with the Largest Hispanic or Latino Community in Leawood, KS
| Zip Code | Hispanic or Latino | vs State | vs National | |
| 1. | 66209 | 558 | 369,970(0.15%)#111 | 61,755,866(0.00%)#10,321 |
| 2. | 66206 | 526 | 369,970(0.14%)#115 | 61,755,866(0.00%)#10,550 |
| 3. | 66211 | 149 | 369,970(0.04%)#200 | 61,755,866(0.00%)#15,287 |
1
Common Questions
What are the Top Zip Codes with the Largest Hispanic or Latino Community in Leawood, KS?
Top Zip Codes with the Largest Hispanic or Latino Community in Leawood, KS are:
What zip code has the Largest Hispanic or Latino Community in Leawood, KS?
66209 has the Largest Hispanic or Latino Community in Leawood, KS with 558.
What is the Total Hispanic or Latino Population in Leawood, KS?
Total Hispanic or Latino Population in Leawood is 1,084.
What is the Total Hispanic or Latino Population in Kansas?
Total Hispanic or Latino Population in Kansas is 369,970.
What is the Total Hispanic or Latino Population in the United States?
Total Hispanic or Latino Population in the United States is 61,755,866.