Cities with the Highest Percentage of Population Driving Alone to Work in Kansas
RELATED REPORTS & OPTIONS
Drive | Alone
Kansas
Compare Cities
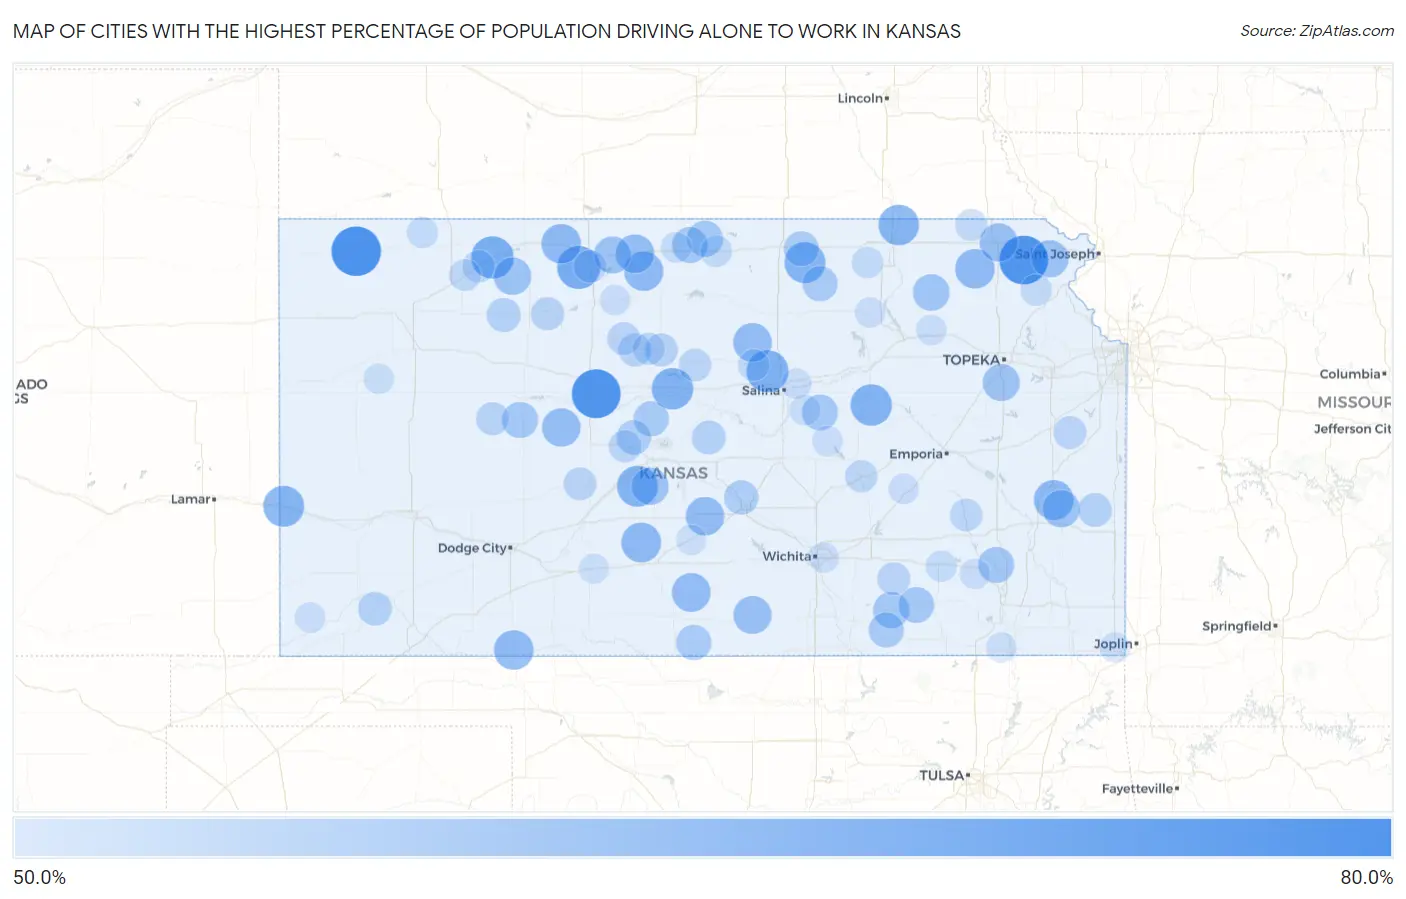
Map of Cities with the Highest Percentage of Population Driving Alone to Work in Kansas
0.0%
80.0%
Cities with the Highest Percentage of Population Driving Alone to Work in Kansas
| City | % Drive Alone | vs State | vs National | |
| 1. | Mcdonald | 70.2% | 41.3%(+28.9)#1 | 42.1%(+28.1)#36 |
| 2. | Munjor | 69.5% | 41.3%(+28.2)#2 | 42.1%(+27.4)#47 |
| 3. | Willis | 69.5% | 41.3%(+28.2)#3 | 42.1%(+27.4)#48 |
| 4. | Mentor | 67.1% | 41.3%(+25.8)#4 | 42.1%(+25.0)#90 |
| 5. | Pilsen | 65.4% | 41.3%(+24.1)#5 | 42.1%(+23.3)#141 |
| 6. | Speed | 64.4% | 41.3%(+23.1)#6 | 42.1%(+22.3)#190 |
| 7. | Clayton | 63.9% | 41.3%(+22.6)#7 | 42.1%(+21.8)#222 |
| 8. | Culver | 63.5% | 41.3%(+22.2)#8 | 42.1%(+21.4)#242 |
| 9. | Dorrance | 63.0% | 41.3%(+21.7)#9 | 42.1%(+20.9)#285 |
| 10. | Latimer | 63.0% | 41.3%(+21.7)#10 | 42.1%(+20.9)#288 |
| 11. | Coolidge | 62.5% | 41.3%(+21.2)#11 | 42.1%(+20.4)#314 |
| 12. | Agenda | 62.5% | 41.3%(+21.2)#12 | 42.1%(+20.4)#319 |
| 13. | Radium | 62.5% | 41.3%(+21.2)#13 | 42.1%(+20.4)#322 |
| 14. | Oketo | 62.2% | 41.3%(+20.9)#14 | 42.1%(+20.1)#355 |
| 15. | St. Benedict | 61.6% | 41.3%(+20.3)#15 | 42.1%(+19.5)#403 |
| 16. | Lone Elm | 61.5% | 41.3%(+20.2)#16 | 42.1%(+19.4)#417 |
| 17. | Byers | 61.5% | 41.3%(+20.2)#17 | 42.1%(+19.4)#423 |
| 18. | Prairie View | 61.3% | 41.3%(+20.0)#18 | 42.1%(+19.2)#442 |
| 19. | Englewood | 61.3% | 41.3%(+20.0)#19 | 42.1%(+19.2)#447 |
| 20. | Goff | 61.3% | 41.3%(+20.0)#20 | 42.1%(+19.2)#448 |
| 21. | Gaylord | 61.1% | 41.3%(+19.8)#21 | 42.1%(+19.0)#484 |
| 22. | Nashville | 60.6% | 41.3%(+19.3)#22 | 42.1%(+18.5)#530 |
| 23. | Plevna | 60.5% | 41.3%(+19.2)#23 | 42.1%(+18.4)#550 |
| 24. | Ada | 60.5% | 41.3%(+19.2)#24 | 42.1%(+18.4)#559 |
| 25. | Athol | 60.5% | 41.3%(+19.2)#25 | 42.1%(+18.4)#560 |
| 26. | Mccracken | 60.4% | 41.3%(+19.1)#26 | 42.1%(+18.3)#576 |
| 27. | Fairview | 60.0% | 41.3%(+18.7)#27 | 42.1%(+17.9)#638 |
| 28. | Danville | 60.0% | 41.3%(+18.7)#28 | 42.1%(+17.9)#646 |
| 29. | Elyria | 59.9% | 41.3%(+18.6)#29 | 42.1%(+17.8)#656 |
| 30. | Lenora | 59.5% | 41.3%(+18.2)#30 | 42.1%(+17.4)#699 |
| 31. | Mildred | 59.4% | 41.3%(+18.1)#31 | 42.1%(+17.3)#737 |
| 32. | Denton | 59.3% | 41.3%(+18.0)#32 | 42.1%(+17.2)#757 |
| 33. | Seward | 59.3% | 41.3%(+18.0)#33 | 42.1%(+17.2)#760 |
| 34. | Wakarusa | 59.1% | 41.3%(+17.8)#34 | 42.1%(+17.0)#805 |
| 35. | Agra | 59.1% | 41.3%(+17.8)#35 | 42.1%(+17.0)#809 |
| 36. | Navarre | 59.0% | 41.3%(+17.7)#36 | 42.1%(+16.9)#828 |
| 37. | Wheaton | 58.8% | 41.3%(+17.5)#37 | 42.1%(+16.7)#862 |
| 38. | Cambridge | 58.4% | 41.3%(+17.1)#38 | 42.1%(+16.3)#950 |
| 39. | Ransom | 58.3% | 41.3%(+17.0)#39 | 42.1%(+16.2)#965 |
| 40. | Burr Oak | 58.3% | 41.3%(+17.0)#40 | 42.1%(+16.2)#976 |
| 41. | Benedict | 58.3% | 41.3%(+17.0)#41 | 42.1%(+16.2)#982 |
| 42. | Esbon | 58.3% | 41.3%(+17.0)#42 | 42.1%(+16.2)#984 |
| 43. | South Mound | 58.2% | 41.3%(+16.9)#43 | 42.1%(+16.1)#1,010 |
| 44. | Carlton | 58.2% | 41.3%(+16.9)#44 | 42.1%(+16.1)#1,011 |
| 45. | Grenola | 58.1% | 41.3%(+16.8)#45 | 42.1%(+16.0)#1,022 |
| 46. | Wabaunsee | 58.0% | 41.3%(+16.7)#46 | 42.1%(+15.9)#1,052 |
| 47. | Hazelton | 57.6% | 41.3%(+16.3)#47 | 42.1%(+15.5)#1,123 |
| 48. | Dexter | 57.5% | 41.3%(+16.2)#48 | 42.1%(+15.4)#1,142 |
| 49. | Vining | 57.5% | 41.3%(+16.2)#49 | 42.1%(+15.4)#1,160 |
| 50. | Susank | 57.5% | 41.3%(+16.2)#50 | 42.1%(+15.4)#1,166 |
| 51. | Cuba | 57.4% | 41.3%(+16.1)#51 | 42.1%(+15.3)#1,187 |
| 52. | Olmitz | 57.1% | 41.3%(+15.8)#52 | 42.1%(+15.0)#1,287 |
| 53. | Willowbrook | 56.9% | 41.3%(+15.6)#53 | 42.1%(+14.8)#1,320 |
| 54. | Morland | 56.5% | 41.3%(+15.2)#54 | 42.1%(+14.4)#1,430 |
| 55. | Tecumseh | 56.3% | 41.3%(+15.0)#55 | 42.1%(+14.2)#1,505 |
| 56. | Mapleton | 56.3% | 41.3%(+15.0)#56 | 42.1%(+14.2)#1,509 |
| 57. | Moscow | 56.3% | 41.3%(+15.0)#57 | 42.1%(+14.2)#1,513 |
| 58. | Ringo | 56.3% | 41.3%(+15.0)#58 | 42.1%(+14.2)#1,525 |
| 59. | Frederick | 56.3% | 41.3%(+15.0)#59 | 42.1%(+14.2)#1,529 |
| 60. | Luray | 55.8% | 41.3%(+14.5)#60 | 42.1%(+13.7)#1,651 |
| 61. | Sycamore | 55.8% | 41.3%(+14.5)#61 | 42.1%(+13.7)#1,656 |
| 62. | Bogue | 55.8% | 41.3%(+14.5)#62 | 42.1%(+13.7)#1,658 |
| 63. | Paradise | 55.8% | 41.3%(+14.5)#63 | 42.1%(+13.7)#1,664 |
| 64. | Utica | 55.7% | 41.3%(+14.4)#64 | 42.1%(+13.6)#1,687 |
| 65. | Natoma | 55.6% | 41.3%(+14.3)#65 | 42.1%(+13.5)#1,700 |
| 66. | Rozel | 55.6% | 41.3%(+14.3)#66 | 42.1%(+13.5)#1,710 |
| 67. | Latham | 55.5% | 41.3%(+14.2)#67 | 42.1%(+13.4)#1,749 |
| 68. | Rantoul | 55.5% | 41.3%(+14.2)#68 | 42.1%(+13.4)#1,757 |
| 69. | Sylvan Grove | 55.4% | 41.3%(+14.1)#69 | 42.1%(+13.3)#1,781 |
| 70. | Glade | 55.4% | 41.3%(+14.1)#70 | 42.1%(+13.3)#1,789 |
| 71. | Virgil | 55.3% | 41.3%(+14.0)#71 | 42.1%(+13.2)#1,831 |
| 72. | Albert | 55.2% | 41.3%(+13.9)#72 | 42.1%(+13.1)#1,863 |
| 73. | Florence | 55.1% | 41.3%(+13.8)#73 | 42.1%(+13.0)#1,893 |
| 74. | Jennings | 55.0% | 41.3%(+13.7)#74 | 42.1%(+12.9)#1,942 |
| 75. | Waldo | 55.0% | 41.3%(+13.7)#75 | 42.1%(+12.9)#1,945 |
| 76. | Bern | 54.7% | 41.3%(+13.4)#76 | 42.1%(+12.6)#2,030 |
| 77. | Dresden | 54.7% | 41.3%(+13.4)#77 | 42.1%(+12.6)#2,034 |
| 78. | Mankato | 54.5% | 41.3%(+13.2)#78 | 42.1%(+12.4)#2,088 |
| 79. | Tescott | 54.5% | 41.3%(+13.2)#79 | 42.1%(+12.4)#2,106 |
| 80. | Effingham | 54.4% | 41.3%(+13.1)#80 | 42.1%(+12.3)#2,149 |
| 81. | Barnes | 54.3% | 41.3%(+13.0)#81 | 42.1%(+12.2)#2,213 |
| 82. | Severy | 54.1% | 41.3%(+12.8)#82 | 42.1%(+12.0)#2,295 |
| 83. | Herndon | 54.1% | 41.3%(+12.8)#83 | 42.1%(+12.0)#2,301 |
| 84. | Gypsum | 53.8% | 41.3%(+12.5)#84 | 42.1%(+11.7)#2,399 |
| 85. | Lebanon | 53.8% | 41.3%(+12.5)#85 | 42.1%(+11.7)#2,409 |
| 86. | Durham | 53.7% | 41.3%(+12.4)#86 | 42.1%(+11.6)#2,455 |
| 87. | Louisville | 53.6% | 41.3%(+12.3)#87 | 42.1%(+11.5)#2,488 |
| 88. | Woodston | 53.6% | 41.3%(+12.3)#88 | 42.1%(+11.5)#2,491 |
| 89. | Furley | 53.6% | 41.3%(+12.3)#89 | 42.1%(+11.5)#2,493 |
| 90. | Richfield | 53.6% | 41.3%(+12.3)#90 | 42.1%(+11.5)#2,494 |
| 91. | Eastborough | 53.5% | 41.3%(+12.2)#91 | 42.1%(+11.4)#2,516 |
| 92. | Leonardville | 53.5% | 41.3%(+12.2)#92 | 42.1%(+11.4)#2,519 |
| 93. | New Cambria | 53.5% | 41.3%(+12.2)#93 | 42.1%(+11.4)#2,560 |
| 94. | Matfield Green | 53.5% | 41.3%(+12.2)#95 | 42.1%(+11.4)#2,573 |
| 95. | New Albany | 53.5% | 41.3%(+12.2)#96 | 42.1%(+11.4)#2,574 |
| 96. | Russell Springs | 53.5% | 41.3%(+12.2)#97 | 42.1%(+11.4)#2,578 |
| 97. | Lowell | 53.4% | 41.3%(+12.1)#98 | 42.1%(+11.3)#2,617 |
| 98. | Turon | 53.4% | 41.3%(+12.1)#99 | 42.1%(+11.3)#2,622 |
| 99. | Greensburg | 53.3% | 41.3%(+12.0)#100 | 42.1%(+11.2)#2,666 |
| 100. | Dearing | 53.3% | 41.3%(+12.0)#101 | 42.1%(+11.2)#2,676 |
Common Questions
What are the Top 10 Cities with the Highest Percentage of Population Driving Alone to Work in Kansas?
Top 10 Cities with the Highest Percentage of Population Driving Alone to Work in Kansas are:
What city has the Highest Percentage of Population Driving Alone to Work in Kansas?
McDonald has the Highest Percentage of Population Driving Alone to Work in Kansas with 70.2%.
What is the Percentage of Population Driving Alone to Work in the State of Kansas?
Percentage of Population Driving Alone to Work in Kansas is 41.3%.
What is the Percentage of Population Driving Alone to Work in the United States?
Percentage of Population Driving Alone to Work in the United States is 42.1%.