Ransom, KS Map & Demographics
Ransom Map
Ransom Overview
$35,378
PER CAPITA INCOME
$66,000
AVG FAMILY INCOME
$52,917
AVG HOUSEHOLD INCOME
0.50
INEQUALITY / GINI INDEX
265
TOTAL POPULATION
114
MALE POPULATION
151
FEMALE POPULATION
75.50
MALES / 100 FEMALES
132.46
FEMALES / 100 MALES
59.7
MEDIAN AGE
2.8
AVG FAMILY SIZE
2.1
AVG HOUSEHOLD SIZE
130
LABOR FORCE [ PEOPLE ]
55.6%
PERCENT IN LABOR FORCE
Ransom Zip Codes
Ransom Area Codes
Income in Ransom
Income Overview in Ransom
Per Capita Income in Ransom is $35,378, while median incomes of families and households are $66,000 and $52,917 respectively.
| Characteristic | Number | Measure |
| Per Capita Income | 265 | $35,378 |
| Median Family Income | 72 | $66,000 |
| Mean Family Income | 72 | $100,817 |
| Median Household Income | 116 | $52,917 |
| Mean Household Income | 116 | $73,985 |
| Income Deficit | 72 | $0 |
| Wage / Income Gap (%) | 265 | 0.00% |
| Wage / Income Gap ($) | 265 | 100.00¢ per $1 |
| Gini / Inequality Index | 265 | 0.50 |
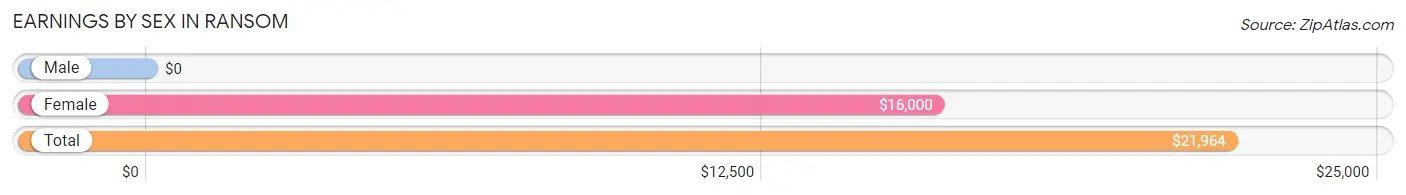
Earnings by Sex in Ransom
| Sex | Number | Average Earnings |
| Male | 69 (46.9%) | $0 |
| Female | 78 (53.1%) | $16,000 |
| Total | 147 (100.0%) | $21,964 |
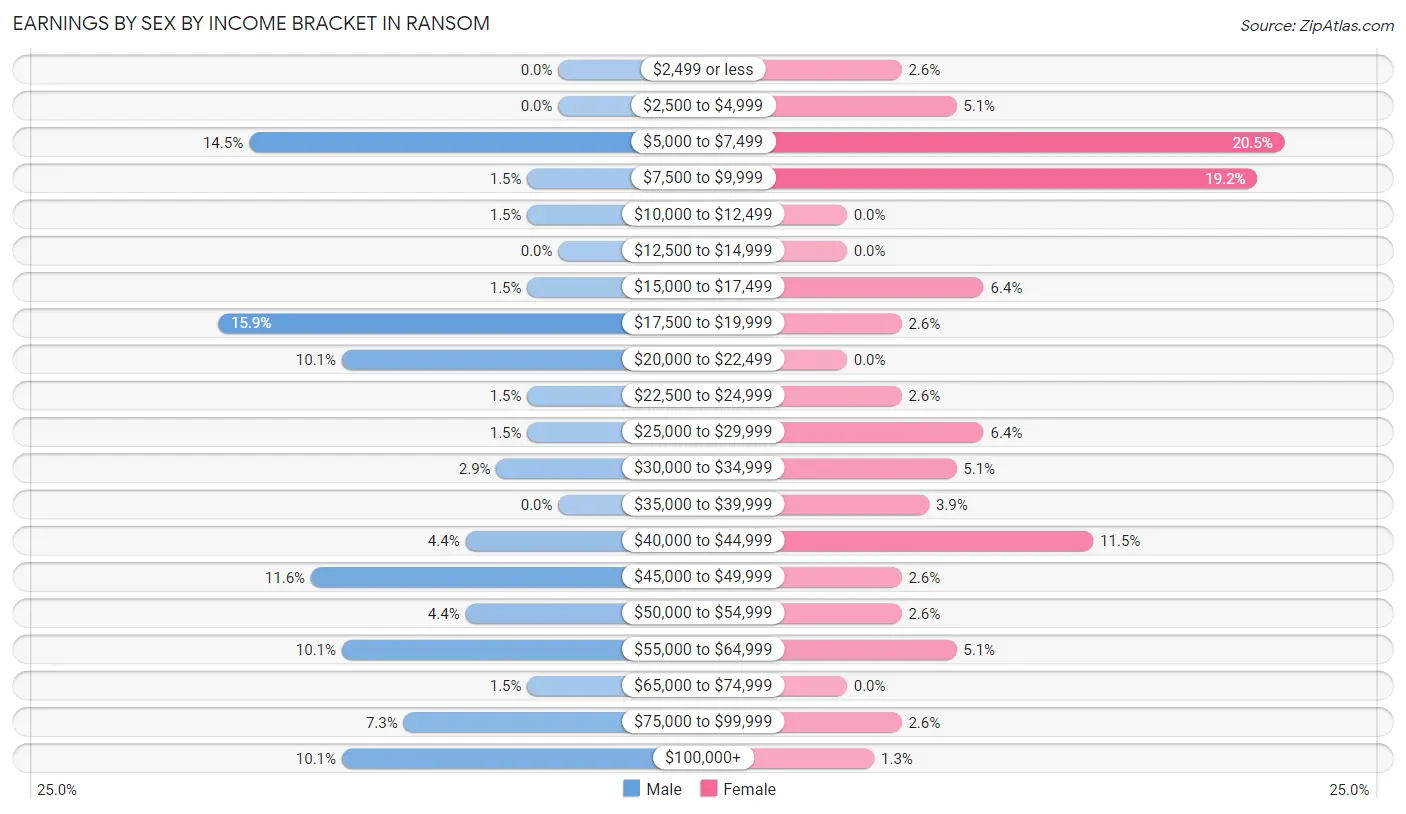
Earnings by Sex by Income Bracket in Ransom
The most common earnings brackets in Ransom are $17,500 to $19,999 for men (11 | 15.9%) and $5,000 to $7,499 for women (16 | 20.5%).
| Income | Male | Female |
| $2,499 or less | 0 (0.0%) | 2 (2.6%) |
| $2,500 to $4,999 | 0 (0.0%) | 4 (5.1%) |
| $5,000 to $7,499 | 10 (14.5%) | 16 (20.5%) |
| $7,500 to $9,999 | 1 (1.5%) | 15 (19.2%) |
| $10,000 to $12,499 | 1 (1.5%) | 0 (0.0%) |
| $12,500 to $14,999 | 0 (0.0%) | 0 (0.0%) |
| $15,000 to $17,499 | 1 (1.5%) | 5 (6.4%) |
| $17,500 to $19,999 | 11 (15.9%) | 2 (2.6%) |
| $20,000 to $22,499 | 7 (10.1%) | 0 (0.0%) |
| $22,500 to $24,999 | 1 (1.5%) | 2 (2.6%) |
| $25,000 to $29,999 | 1 (1.5%) | 5 (6.4%) |
| $30,000 to $34,999 | 2 (2.9%) | 4 (5.1%) |
| $35,000 to $39,999 | 0 (0.0%) | 3 (3.8%) |
| $40,000 to $44,999 | 3 (4.3%) | 9 (11.5%) |
| $45,000 to $49,999 | 8 (11.6%) | 2 (2.6%) |
| $50,000 to $54,999 | 3 (4.3%) | 2 (2.6%) |
| $55,000 to $64,999 | 7 (10.1%) | 4 (5.1%) |
| $65,000 to $74,999 | 1 (1.5%) | 0 (0.0%) |
| $75,000 to $99,999 | 5 (7.2%) | 2 (2.6%) |
| $100,000+ | 7 (10.1%) | 1 (1.3%) |
| Total | 69 (100.0%) | 78 (100.0%) |
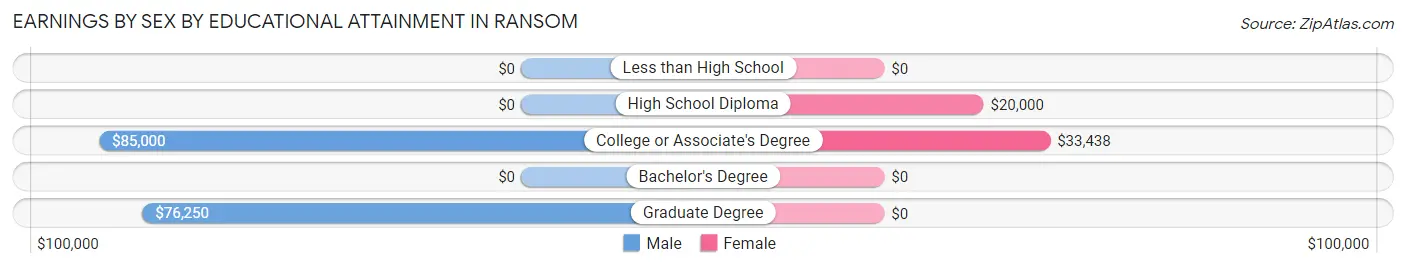
Earnings by Sex by Educational Attainment in Ransom
Average earnings in Ransom are $42,917 for men and $29,000 for women, a difference of 32.4%. Men with an educational attainment of college or associate's degree enjoy the highest average annual earnings of $85,000, while those with graduate degree education earn the least with $76,250. Women with an educational attainment of college or associate's degree earn the most with the average annual earnings of $33,438, while those with high school diploma education have the smallest earnings of $20,000.
| Educational Attainment | Male Income | Female Income |
| Less than High School | - | - |
| High School Diploma | - | - |
| College or Associate's Degree | $85,000 | $33,438 |
| Bachelor's Degree | - | - |
| Graduate Degree | $76,250 | $0 |
| Total | $42,917 | $29,000 |
Family Income in Ransom
Family Income Brackets in Ransom
According to the Ransom family income data, there are 29 families falling into the $50,000 to $74,999 income range, which is the most common income bracket and makes up 40.3% of all families.
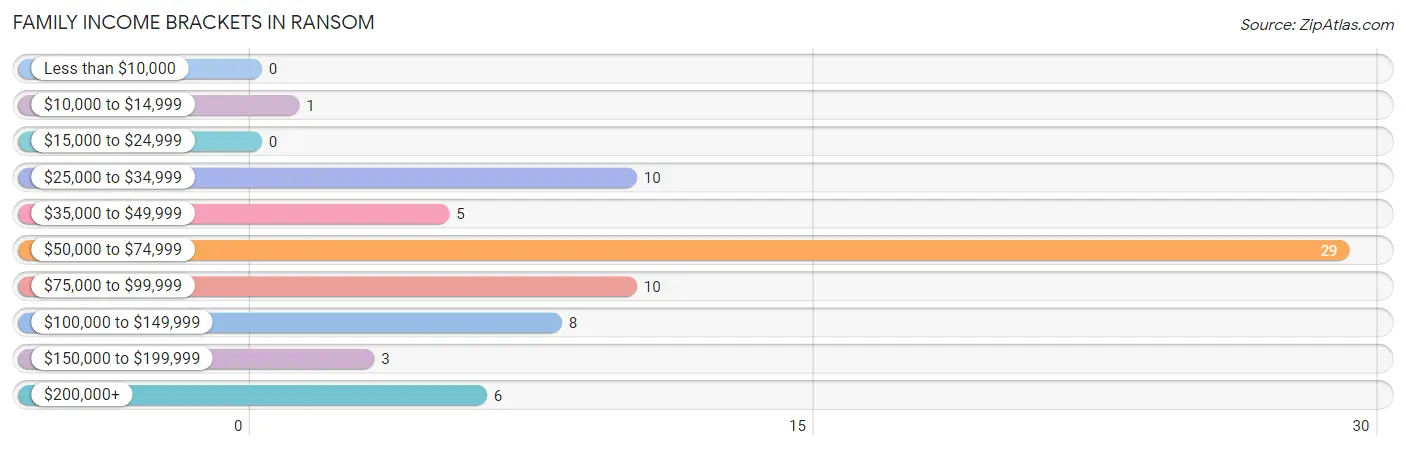
| Income Bracket | # Families | % Families |
| Less than $10,000 | 0 | 0.0% |
| $10,000 to $14,999 | 1 | 1.4% |
| $15,000 to $24,999 | 0 | 0.0% |
| $25,000 to $34,999 | 10 | 13.9% |
| $35,000 to $49,999 | 5 | 6.9% |
| $50,000 to $74,999 | 29 | 40.3% |
| $75,000 to $99,999 | 10 | 13.9% |
| $100,000 to $149,999 | 8 | 11.1% |
| $150,000 to $199,999 | 3 | 4.2% |
| $200,000+ | 6 | 8.3% |
Family Income by Famaliy Size in Ransom
3-person families (13 | 18.1%) account for the highest median family income in Ransom with $65,938 per family, while 2-person families (48 | 66.7%) have the highest median income of $32,916 per family member.
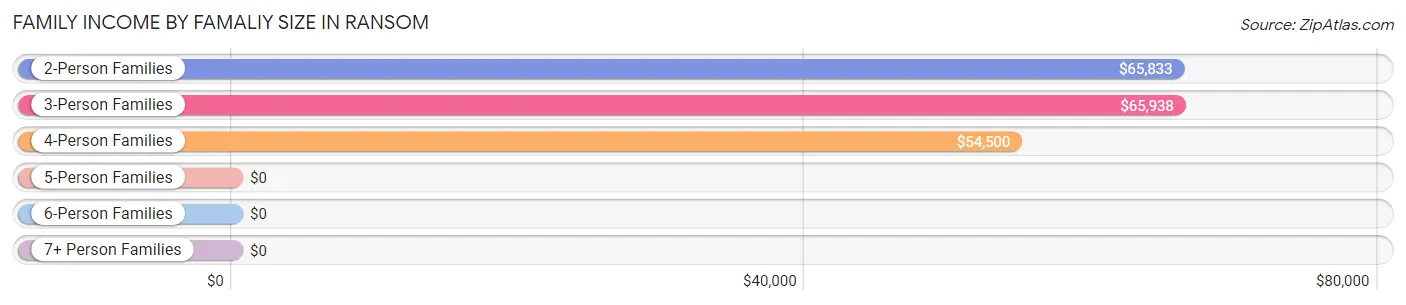
| Income Bracket | # Families | Median Income |
| 2-Person Families | 48 (66.7%) | $65,833 |
| 3-Person Families | 13 (18.1%) | $65,938 |
| 4-Person Families | 8 (11.1%) | $54,500 |
| 5-Person Families | 3 (4.2%) | $0 |
| 6-Person Families | 0 (0.0%) | $0 |
| 7+ Person Families | 0 (0.0%) | $0 |
| Total | 72 (100.0%) | $66,000 |
Family Income by Number of Earners in Ransom
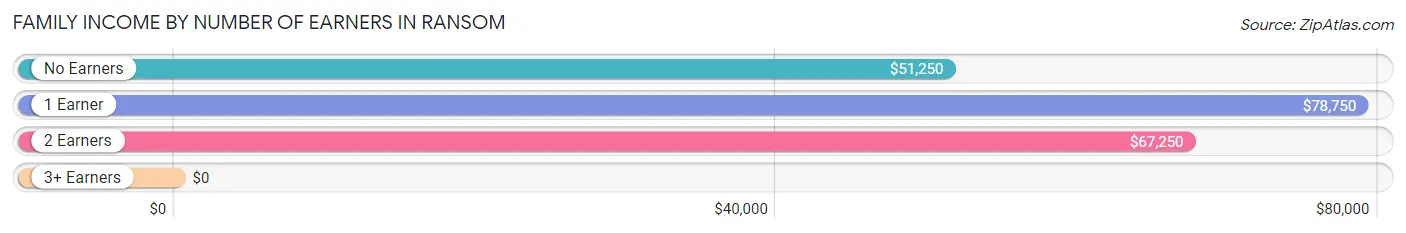
| Number of Earners | # Families | Median Income |
| No Earners | 15 (20.8%) | $51,250 |
| 1 Earner | 7 (9.7%) | $78,750 |
| 2 Earners | 42 (58.3%) | $67,250 |
| 3+ Earners | 8 (11.1%) | $0 |
| Total | 72 (100.0%) | $66,000 |
Household Income in Ransom
Household Income Brackets in Ransom
With 31 households falling in the category, the $50,000 to $74,999 income range is the most frequent in Ransom, accounting for 26.7% of all households. In contrast, only 1 households (0.9%) fall into the less than $10,000 income bracket, making it the least populous group.
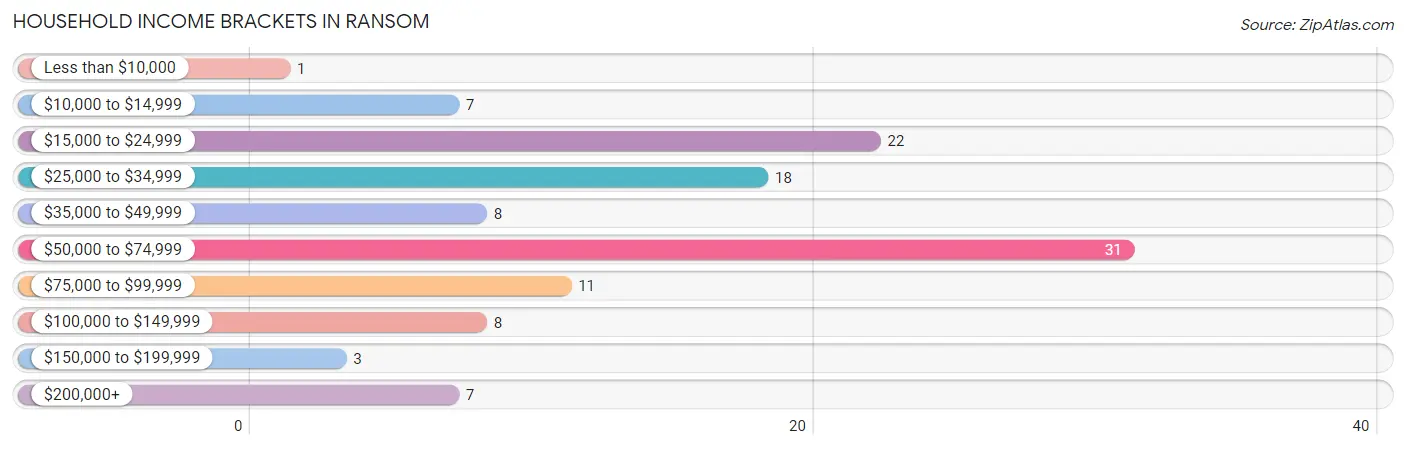
| Income Bracket | # Households | % Households |
| Less than $10,000 | 1 | 0.9% |
| $10,000 to $14,999 | 7 | 6.0% |
| $15,000 to $24,999 | 22 | 19.0% |
| $25,000 to $34,999 | 18 | 15.5% |
| $35,000 to $49,999 | 8 | 6.9% |
| $50,000 to $74,999 | 31 | 26.7% |
| $75,000 to $99,999 | 11 | 9.5% |
| $100,000 to $149,999 | 8 | 6.9% |
| $150,000 to $199,999 | 3 | 2.6% |
| $200,000+ | 7 | 6.0% |
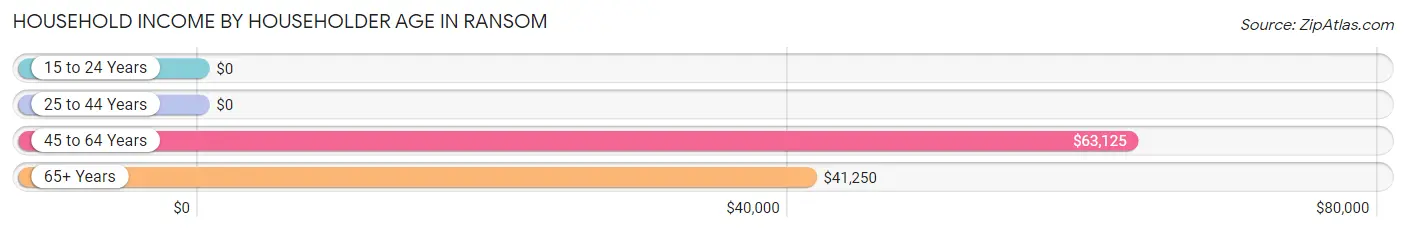
Household Income by Householder Age in Ransom
The median household income in Ransom is $52,917, with the highest median household income of $63,125 found in the 45 to 64 years age bracket for the primary householder. A total of 43 households (37.1%) fall into this category.
| Income Bracket | # Households | Median Income |
| 15 to 24 Years | 0 (0.0%) | $0 |
| 25 to 44 Years | 21 (18.1%) | $0 |
| 45 to 64 Years | 43 (37.1%) | $63,125 |
| 65+ Years | 52 (44.8%) | $41,250 |
| Total | 116 (100.0%) | $52,917 |
Poverty in Ransom
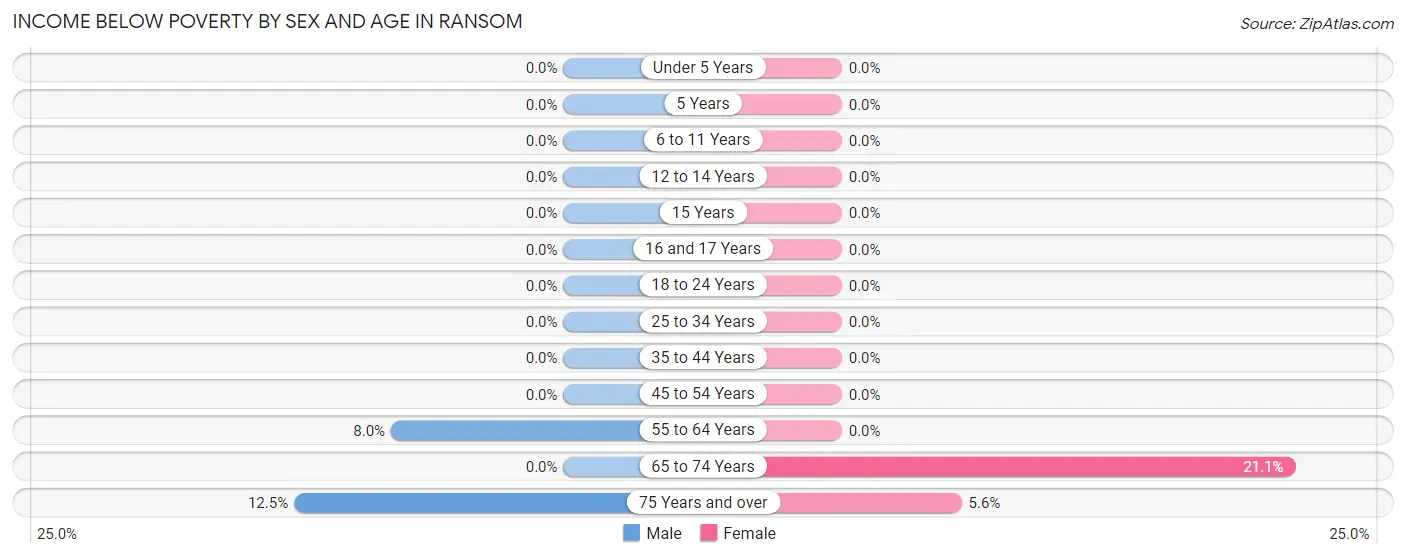
Income Below Poverty by Sex and Age in Ransom
With 3.5% poverty level for males and 3.7% for females among the residents of Ransom, 75 year old and over males and 65 to 74 year old females are the most vulnerable to poverty, with 2 males (12.5%) and 4 females (21.0%) in their respective age groups living below the poverty level.
| Age Bracket | Male | Female |
| Under 5 Years | 0 (0.0%) | 0 (0.0%) |
| 5 Years | 0 (0.0%) | 0 (0.0%) |
| 6 to 11 Years | 0 (0.0%) | 0 (0.0%) |
| 12 to 14 Years | 0 (0.0%) | 0 (0.0%) |
| 15 Years | 0 (0.0%) | 0 (0.0%) |
| 16 and 17 Years | 0 (0.0%) | 0 (0.0%) |
| 18 to 24 Years | 0 (0.0%) | 0 (0.0%) |
| 25 to 34 Years | 0 (0.0%) | 0 (0.0%) |
| 35 to 44 Years | 0 (0.0%) | 0 (0.0%) |
| 45 to 54 Years | 0 (0.0%) | 0 (0.0%) |
| 55 to 64 Years | 2 (8.0%) | 0 (0.0%) |
| 65 to 74 Years | 0 (0.0%) | 4 (21.0%) |
| 75 Years and over | 2 (12.5%) | 1 (5.6%) |
| Total | 4 (3.5%) | 5 (3.7%) |
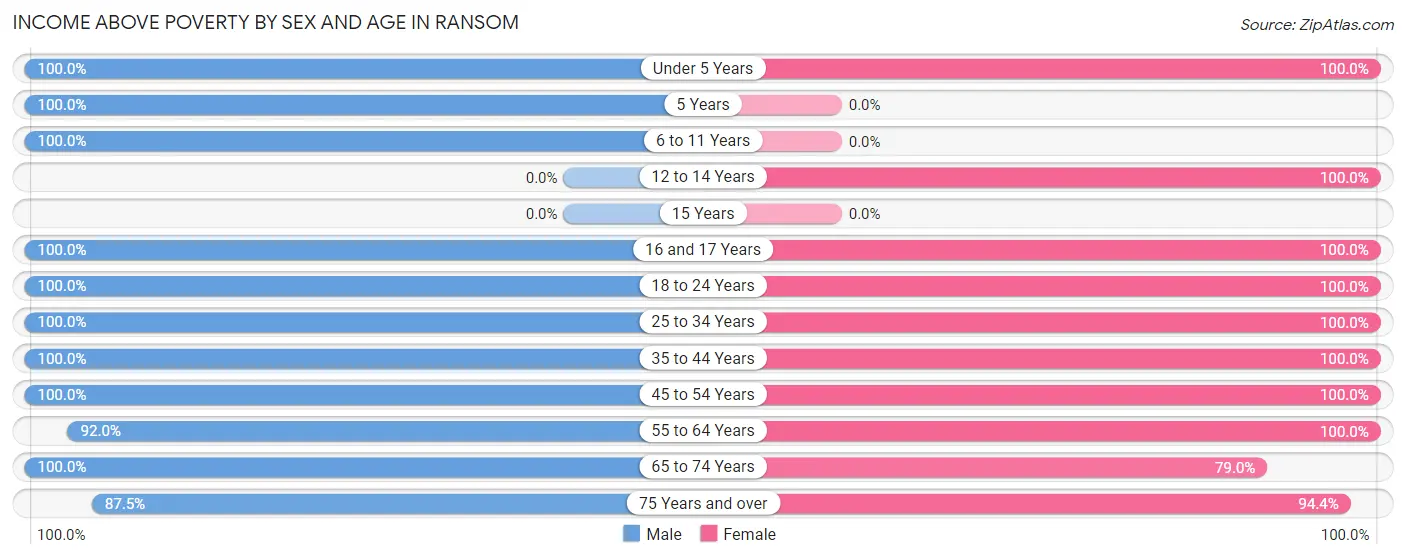
Income Above Poverty by Sex and Age in Ransom
According to the poverty statistics in Ransom, males aged under 5 years and females aged under 5 years are the age groups that are most secure financially, with 100.0% of males and 100.0% of females in these age groups living above the poverty line.
| Age Bracket | Male | Female |
| Under 5 Years | 4 (100.0%) | 3 (100.0%) |
| 5 Years | 1 (100.0%) | 0 (0.0%) |
| 6 to 11 Years | 6 (100.0%) | 0 (0.0%) |
| 12 to 14 Years | 0 (0.0%) | 17 (100.0%) |
| 15 Years | 0 (0.0%) | 0 (0.0%) |
| 16 and 17 Years | 1 (100.0%) | 14 (100.0%) |
| 18 to 24 Years | 11 (100.0%) | 6 (100.0%) |
| 25 to 34 Years | 13 (100.0%) | 3 (100.0%) |
| 35 to 44 Years | 6 (100.0%) | 9 (100.0%) |
| 45 to 54 Years | 9 (100.0%) | 12 (100.0%) |
| 55 to 64 Years | 23 (92.0%) | 33 (100.0%) |
| 65 to 74 Years | 22 (100.0%) | 15 (78.9%) |
| 75 Years and over | 14 (87.5%) | 17 (94.4%) |
| Total | 110 (96.5%) | 129 (96.3%) |
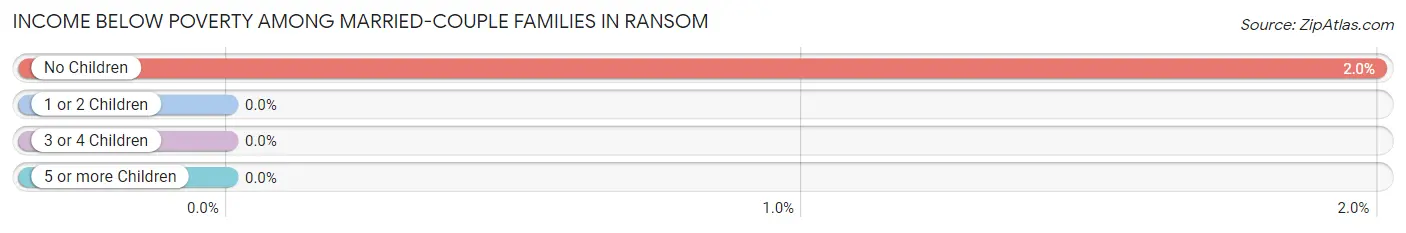
Income Below Poverty Among Married-Couple Families in Ransom
The poverty statistics for married-couple families in Ransom show that 1.8% or 1 of the total 56 families live below the poverty line. Families with no children have the highest poverty rate of 2.0%, comprising of 1 families. On the other hand, families with 1 or 2 children have the lowest poverty rate of 0.0%, which includes 0 families.
| Children | Above Poverty | Below Poverty |
| No Children | 49 (98.0%) | 1 (2.0%) |
| 1 or 2 Children | 3 (100.0%) | 0 (0.0%) |
| 3 or 4 Children | 3 (100.0%) | 0 (0.0%) |
| 5 or more Children | 0 (0.0%) | 0 (0.0%) |
| Total | 55 (98.2%) | 1 (1.8%) |
Income Below Poverty Among Single-Parent Households in Ransom
| Children | Single Father | Single Mother |
| No Children | 0 (0.0%) | 0 (0.0%) |
| 1 or 2 Children | 0 (0.0%) | 0 (0.0%) |
| 3 or 4 Children | 0 (0.0%) | 0 (0.0%) |
| 5 or more Children | 0 (0.0%) | 0 (0.0%) |
| Total | 0 (0.0%) | 0 (0.0%) |
Income Below Poverty Among Married-Couple vs Single-Parent Households in Ransom
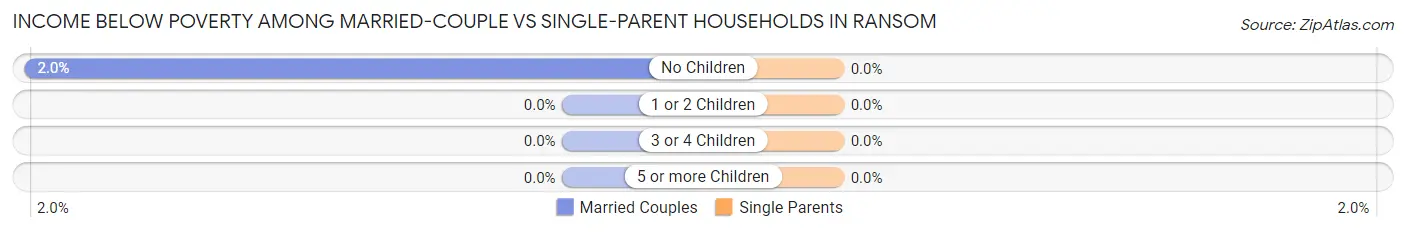
| Children | Married-Couple Families | Single-Parent Households |
| No Children | 1 (2.0%) | 0 (0.0%) |
| 1 or 2 Children | 0 (0.0%) | 0 (0.0%) |
| 3 or 4 Children | 0 (0.0%) | 0 (0.0%) |
| 5 or more Children | 0 (0.0%) | 0 (0.0%) |
| Total | 1 (1.8%) | 0 (0.0%) |
Race in Ransom
The most populous races in Ransom are White / Caucasian (251 | 94.7%), Two or more Races (10 | 3.8%), and Native / Alaskan (3 | 1.1%).
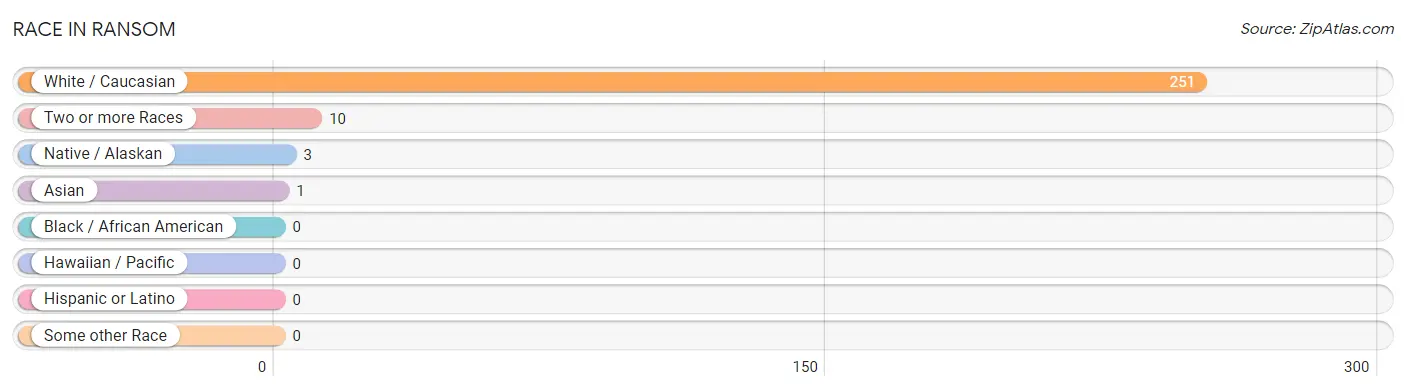
| Race | # Population | % Population |
| Asian | 1 | 0.4% |
| Black / African American | 0 | 0.0% |
| Hawaiian / Pacific | 0 | 0.0% |
| Hispanic or Latino | 0 | 0.0% |
| Native / Alaskan | 3 | 1.1% |
| White / Caucasian | 251 | 94.7% |
| Two or more Races | 10 | 3.8% |
| Some other Race | 0 | 0.0% |
| Total | 265 | 100.0% |
Ancestry in Ransom
The most populous ancestries reported in Ransom are German (146 | 55.1%), English (42 | 15.9%), American (33 | 12.4%), Irish (20 | 7.5%), and Italian (6 | 2.3%), together accounting for 93.2% of all Ransom residents.
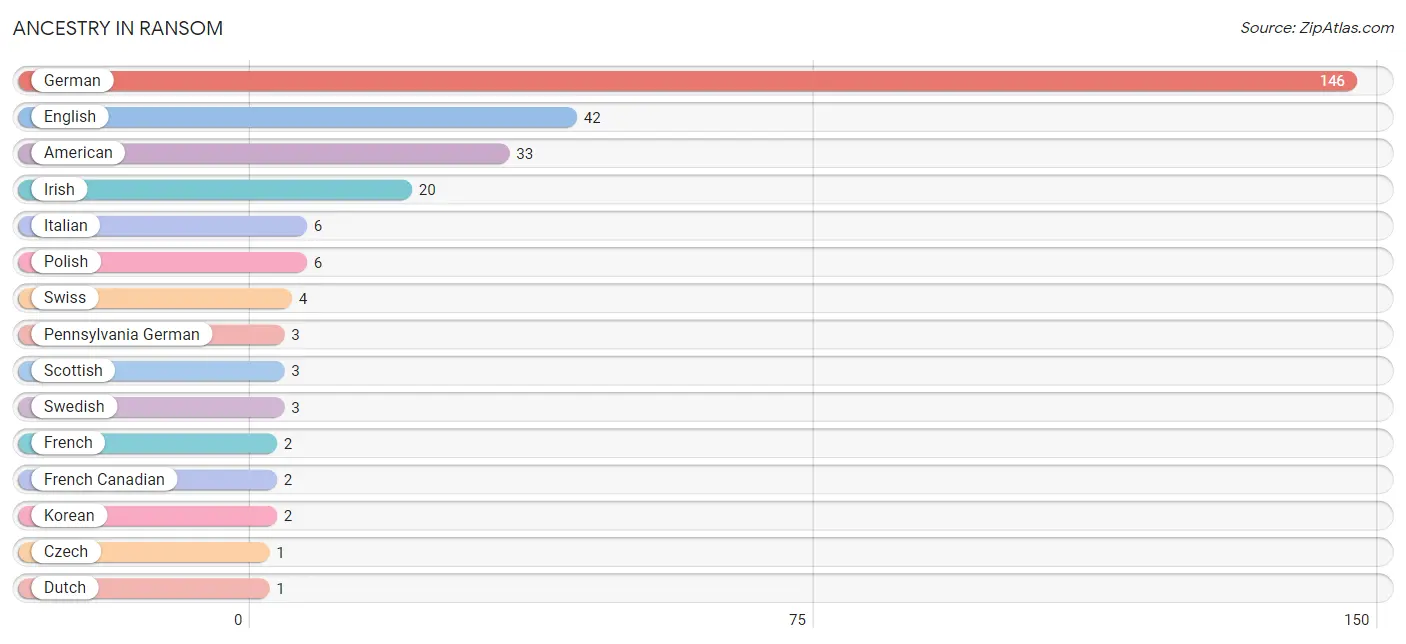
| Ancestry | # Population | % Population |
| American | 33 | 12.4% |
| Czech | 1 | 0.4% |
| Dutch | 1 | 0.4% |
| English | 42 | 15.9% |
| French | 2 | 0.7% |
| French Canadian | 2 | 0.7% |
| German | 146 | 55.1% |
| Irish | 20 | 7.5% |
| Italian | 6 | 2.3% |
| Korean | 2 | 0.7% |
| Pennsylvania German | 3 | 1.1% |
| Polish | 6 | 2.3% |
| Scottish | 3 | 1.1% |
| Swedish | 3 | 1.1% |
| Swiss | 4 | 1.5% |
| Welsh | 1 | 0.4% | View All 16 Rows |
Immigrants in Ransom
The most numerous immigrant groups reported in Ransom came from Asia (1 | 0.4%), Philippines (1 | 0.4%), and South Eastern Asia (1 | 0.4%), together accounting for 1.1% of all Ransom residents.
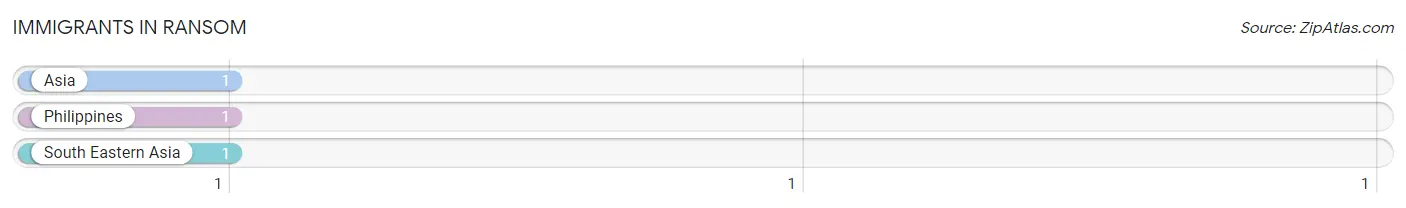
| Immigration Origin | # Population | % Population |
| Asia | 1 | 0.4% |
| Philippines | 1 | 0.4% |
| South Eastern Asia | 1 | 0.4% | View All 3 Rows |
Sex and Age in Ransom
Sex and Age in Ransom
The most populous age groups in Ransom are 60 to 64 Years (16 | 14.0%) for men and 85 Years and over (25 | 16.6%) for women.
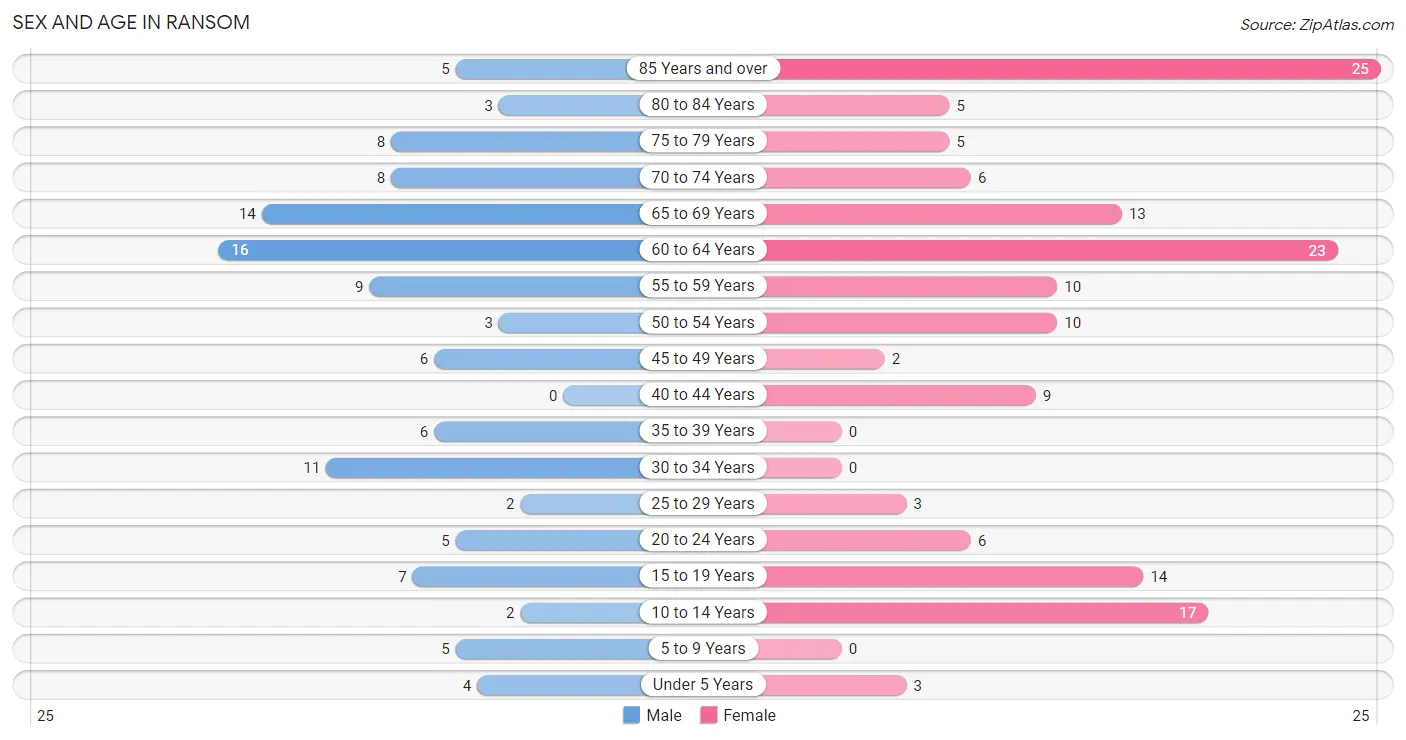
| Age Bracket | Male | Female |
| Under 5 Years | 4 (3.5%) | 3 (2.0%) |
| 5 to 9 Years | 5 (4.4%) | 0 (0.0%) |
| 10 to 14 Years | 2 (1.8%) | 17 (11.3%) |
| 15 to 19 Years | 7 (6.1%) | 14 (9.3%) |
| 20 to 24 Years | 5 (4.4%) | 6 (4.0%) |
| 25 to 29 Years | 2 (1.8%) | 3 (2.0%) |
| 30 to 34 Years | 11 (9.7%) | 0 (0.0%) |
| 35 to 39 Years | 6 (5.3%) | 0 (0.0%) |
| 40 to 44 Years | 0 (0.0%) | 9 (6.0%) |
| 45 to 49 Years | 6 (5.3%) | 2 (1.3%) |
| 50 to 54 Years | 3 (2.6%) | 10 (6.6%) |
| 55 to 59 Years | 9 (7.9%) | 10 (6.6%) |
| 60 to 64 Years | 16 (14.0%) | 23 (15.2%) |
| 65 to 69 Years | 14 (12.3%) | 13 (8.6%) |
| 70 to 74 Years | 8 (7.0%) | 6 (4.0%) |
| 75 to 79 Years | 8 (7.0%) | 5 (3.3%) |
| 80 to 84 Years | 3 (2.6%) | 5 (3.3%) |
| 85 Years and over | 5 (4.4%) | 25 (16.6%) |
| Total | 114 (100.0%) | 151 (100.0%) |
Families and Households in Ransom
Median Family Size in Ransom
The median family size in Ransom is 2.83 persons per family, with single female/mother families (12 | 16.7%) accounting for the largest median family size of 4.25 persons per family. On the other hand, married-couple families (56 | 77.8%) represent the smallest median family size with 2.54 persons per family.
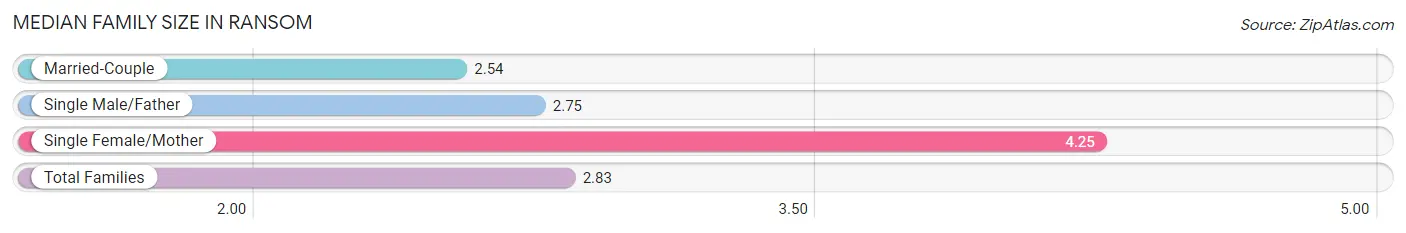
| Family Type | # Families | Family Size |
| Married-Couple | 56 (77.8%) | 2.54 |
| Single Male/Father | 4 (5.6%) | 2.75 |
| Single Female/Mother | 12 (16.7%) | 4.25 |
| Total Families | 72 (100.0%) | 2.83 |
Median Household Size in Ransom
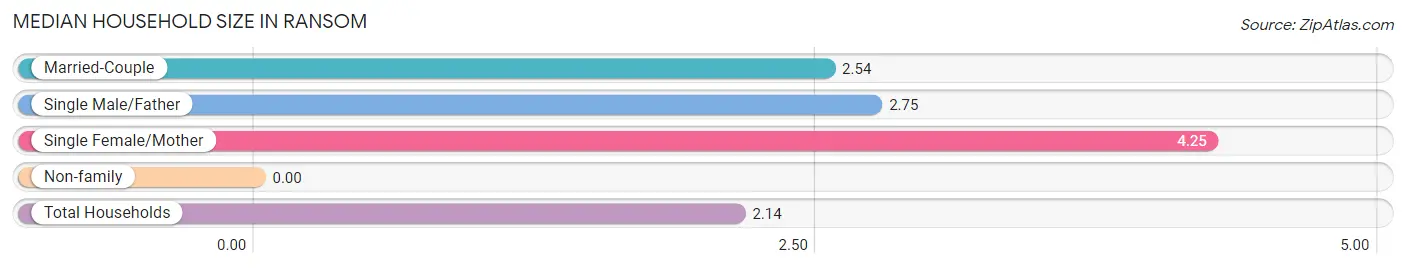
| Household Type | # Households | Household Size |
| Married-Couple | 56 (48.3%) | 2.54 |
| Single Male/Father | 4 (3.5%) | 2.75 |
| Single Female/Mother | 12 (10.3%) | 4.25 |
| Non-family | 44 (37.9%) | - |
| Total Households | 116 (100.0%) | 2.14 |
Household Size by Marriage Status in Ransom
Out of a total of 116 households in Ransom, 72 (62.1%) are family households, while 44 (37.9%) are nonfamily households. The most numerous type of family households are 2-person households, comprising 48, and the most common type of nonfamily households are 1-person households, comprising 44.
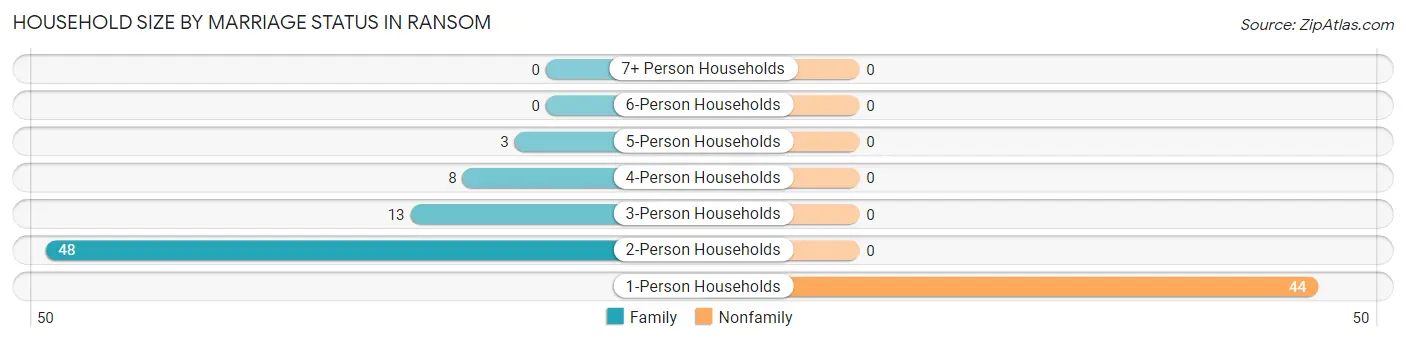
| Household Size | Family Households | Nonfamily Households |
| 1-Person Households | - | 44 (37.9%) |
| 2-Person Households | 48 (41.4%) | 0 (0.0%) |
| 3-Person Households | 13 (11.2%) | 0 (0.0%) |
| 4-Person Households | 8 (6.9%) | 0 (0.0%) |
| 5-Person Households | 3 (2.6%) | 0 (0.0%) |
| 6-Person Households | 0 (0.0%) | 0 (0.0%) |
| 7+ Person Households | 0 (0.0%) | 0 (0.0%) |
| Total | 72 (62.1%) | 44 (37.9%) |
Female Fertility in Ransom
Fertility by Age in Ransom
Average fertility rate in Ransom is 83.0 births per 1,000 women. Women in the age bracket of 20 to 34 years have the highest fertility rate with 333.0 births per 1,000 women. Women in the age bracket of 20 to 34 years acount for 100.0% of all women with births.
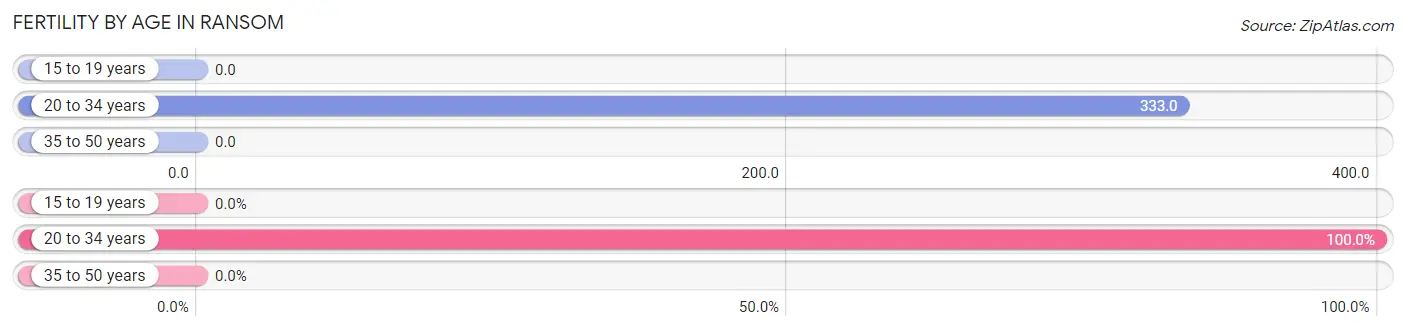
| Age Bracket | Women with Births | Births / 1,000 Women |
| 15 to 19 years | 0 (0.0%) | 0.0 |
| 20 to 34 years | 3 (100.0%) | 333.0 |
| 35 to 50 years | 0 (0.0%) | 0.0 |
| Total | 3 (100.0%) | 83.0 |
Fertility by Age by Marriage Status in Ransom
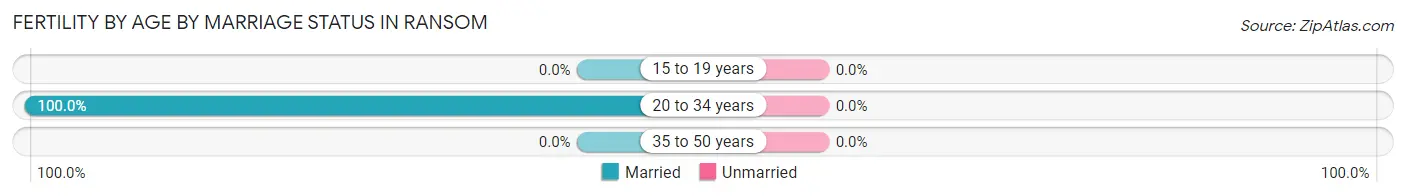
| Age Bracket | Married | Unmarried |
| 15 to 19 years | 0 (0.0%) | 0 (0.0%) |
| 20 to 34 years | 3 (100.0%) | 0 (0.0%) |
| 35 to 50 years | 0 (0.0%) | 0 (0.0%) |
| Total | 3 (100.0%) | 0 (0.0%) |
Fertility by Education in Ransom
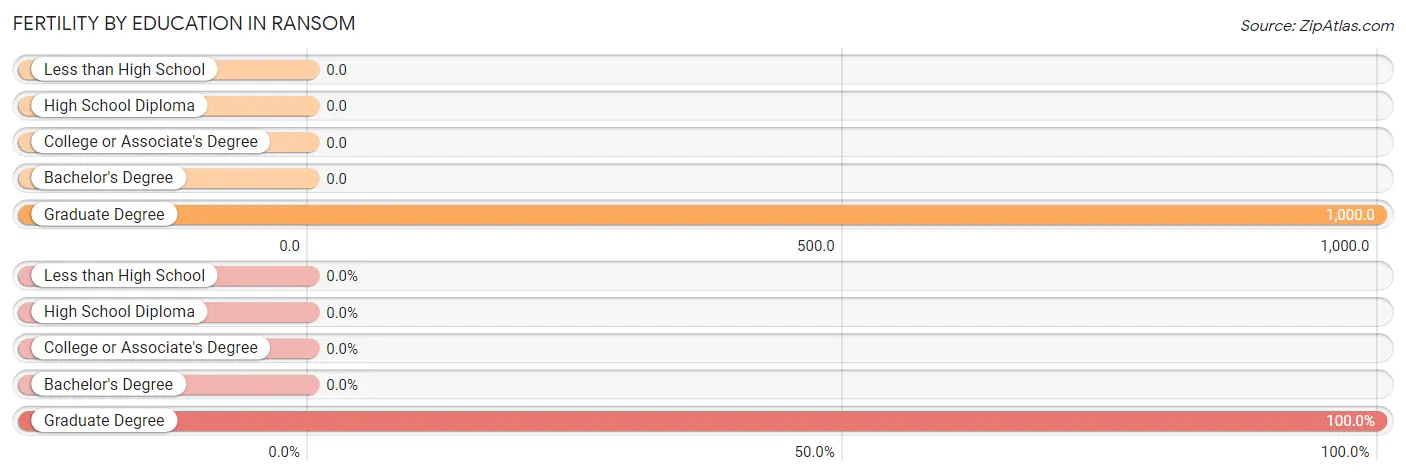
| Educational Attainment | Women with Births | Births / 1,000 Women |
| Less than High School | 0 (0.0%) | 0.0 |
| High School Diploma | 0 (0.0%) | 0.0 |
| College or Associate's Degree | 0 (0.0%) | 0.0 |
| Bachelor's Degree | 0 (0.0%) | 0.0 |
| Graduate Degree | 3 (100.0%) | 1,000.0 |
| Total | 3 (100.0%) | 83.0 |
Fertility by Education by Marriage Status in Ransom
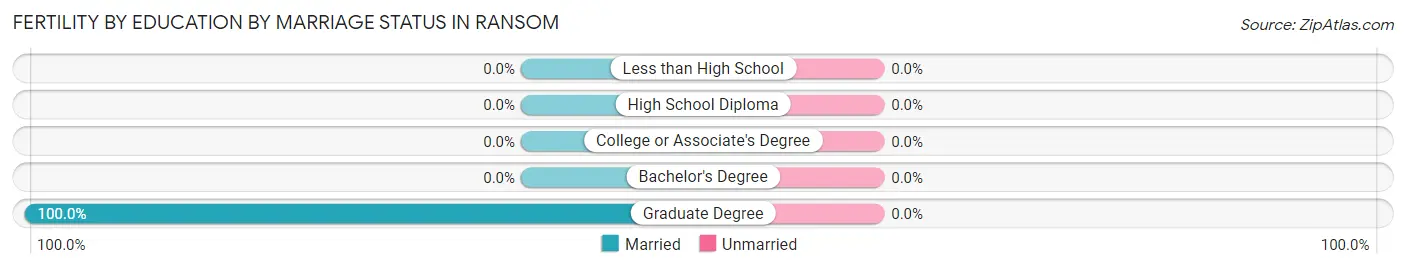
| Educational Attainment | Married | Unmarried |
| Less than High School | 0 (0.0%) | 0 (0.0%) |
| High School Diploma | 0 (0.0%) | 0 (0.0%) |
| College or Associate's Degree | 0 (0.0%) | 0 (0.0%) |
| Bachelor's Degree | 0 (0.0%) | 0 (0.0%) |
| Graduate Degree | 3 (100.0%) | 0 (0.0%) |
| Total | 3 (100.0%) | 0 (0.0%) |
Employment Characteristics in Ransom
Employment by Class of Employer in Ransom
Among the 129 employed individuals in Ransom, private company employees (70 | 54.3%), self-employed (not incorporated) (18 | 14.0%), and state government employees (17 | 13.2%) make up the most common classes of employment.
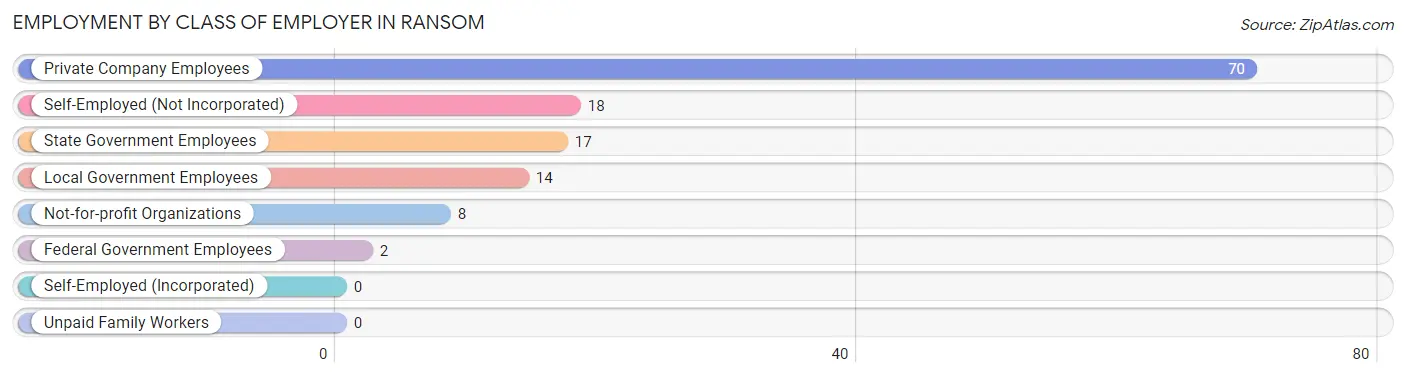
| Employer Class | # Employees | % Employees |
| Private Company Employees | 70 | 54.3% |
| Self-Employed (Incorporated) | 0 | 0.0% |
| Self-Employed (Not Incorporated) | 18 | 14.0% |
| Not-for-profit Organizations | 8 | 6.2% |
| Local Government Employees | 14 | 10.8% |
| State Government Employees | 17 | 13.2% |
| Federal Government Employees | 2 | 1.5% |
| Unpaid Family Workers | 0 | 0.0% |
| Total | 129 | 100.0% |
Employment Status by Age in Ransom
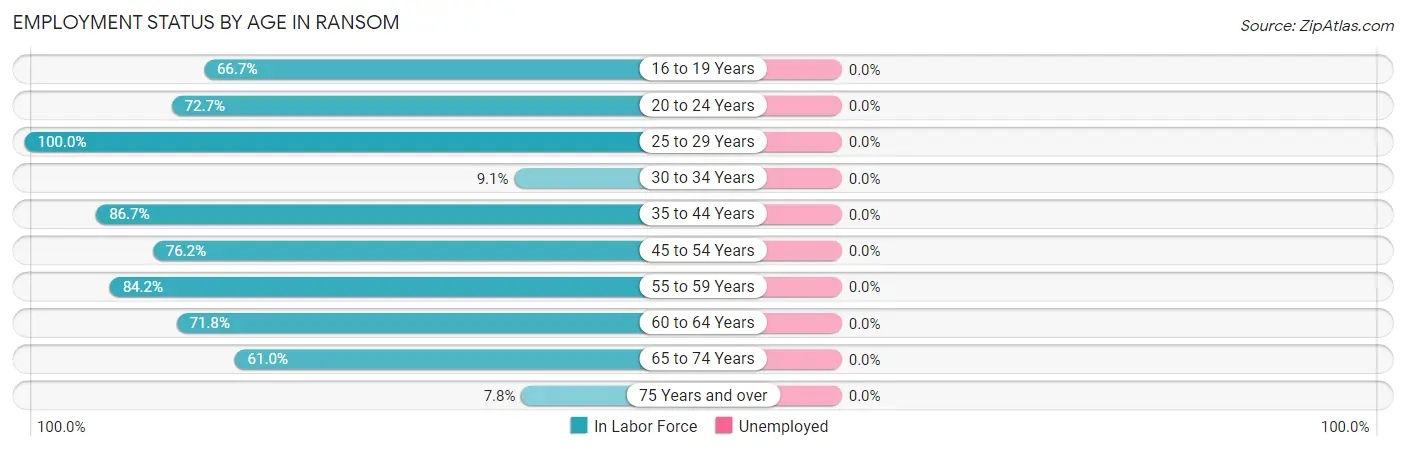
| Age Bracket | In Labor Force | Unemployed |
| 16 to 19 Years | 14 (66.7%) | 0 (0.0%) |
| 20 to 24 Years | 8 (72.7%) | 0 (0.0%) |
| 25 to 29 Years | 5 (100.0%) | 0 (0.0%) |
| 30 to 34 Years | 1 (9.1%) | 0 (0.0%) |
| 35 to 44 Years | 13 (86.7%) | 0 (0.0%) |
| 45 to 54 Years | 16 (76.2%) | 0 (0.0%) |
| 55 to 59 Years | 16 (84.2%) | 0 (0.0%) |
| 60 to 64 Years | 28 (71.8%) | 0 (0.0%) |
| 65 to 74 Years | 25 (61.0%) | 0 (0.0%) |
| 75 Years and over | 4 (7.8%) | 0 (0.0%) |
| Total | 130 (55.6%) | 0 (0.0%) |
Employment Status by Educational Attainment in Ransom
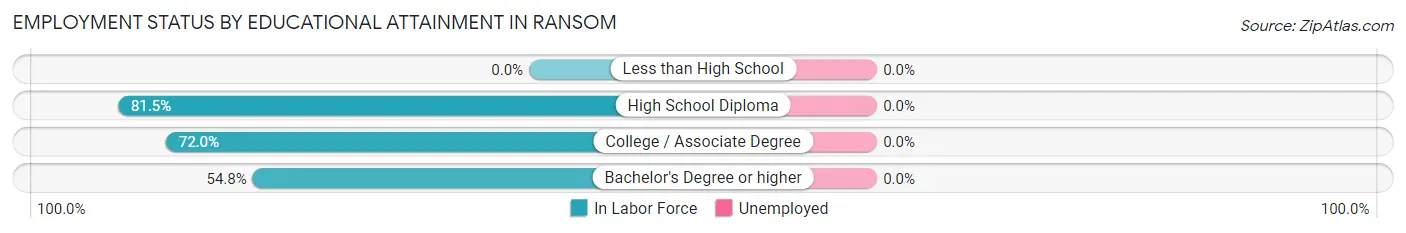
| Educational Attainment | In Labor Force | Unemployed |
| Less than High School | 0 (0.0%) | 0 (0.0%) |
| High School Diploma | 44 (81.5%) | 0 (0.0%) |
| College / Associate Degree | 18 (72.0%) | 0 (0.0%) |
| Bachelor's Degree or higher | 17 (54.8%) | 0 (0.0%) |
| Total | 79 (71.8%) | 0 (0.0%) |
Employment Occupations by Sex in Ransom
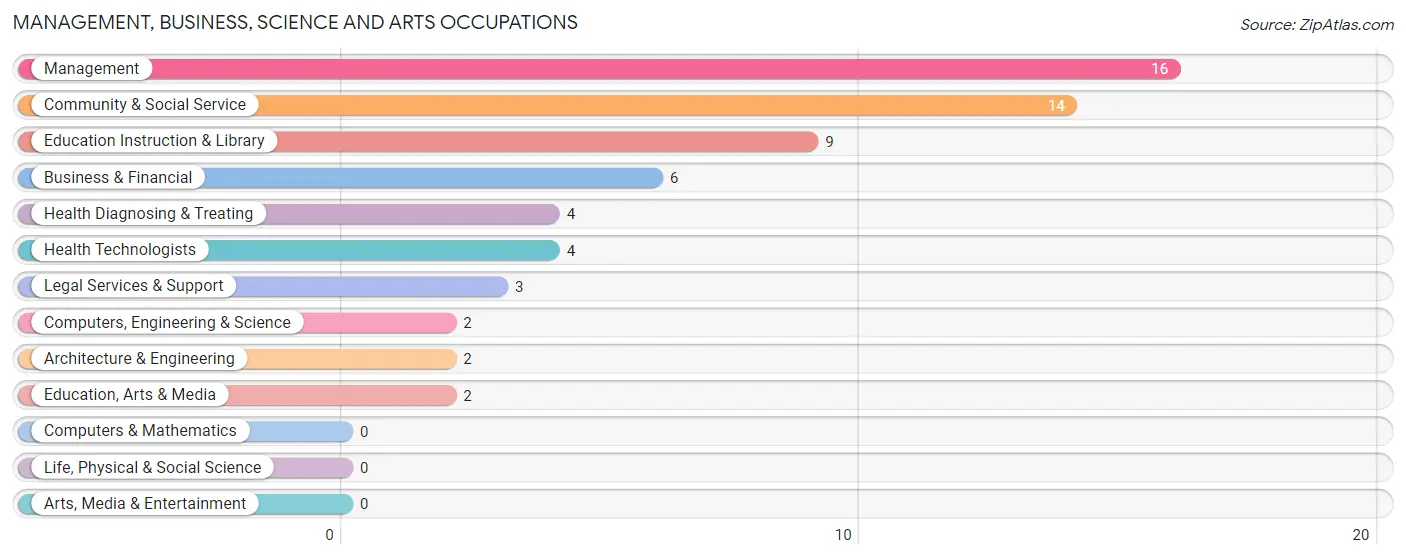
Management, Business, Science and Arts Occupations
The most common Management, Business, Science and Arts occupations in Ransom are Management (16 | 12.3%), Community & Social Service (14 | 10.8%), Education Instruction & Library (9 | 6.9%), Business & Financial (6 | 4.6%), and Health Diagnosing & Treating (4 | 3.1%).
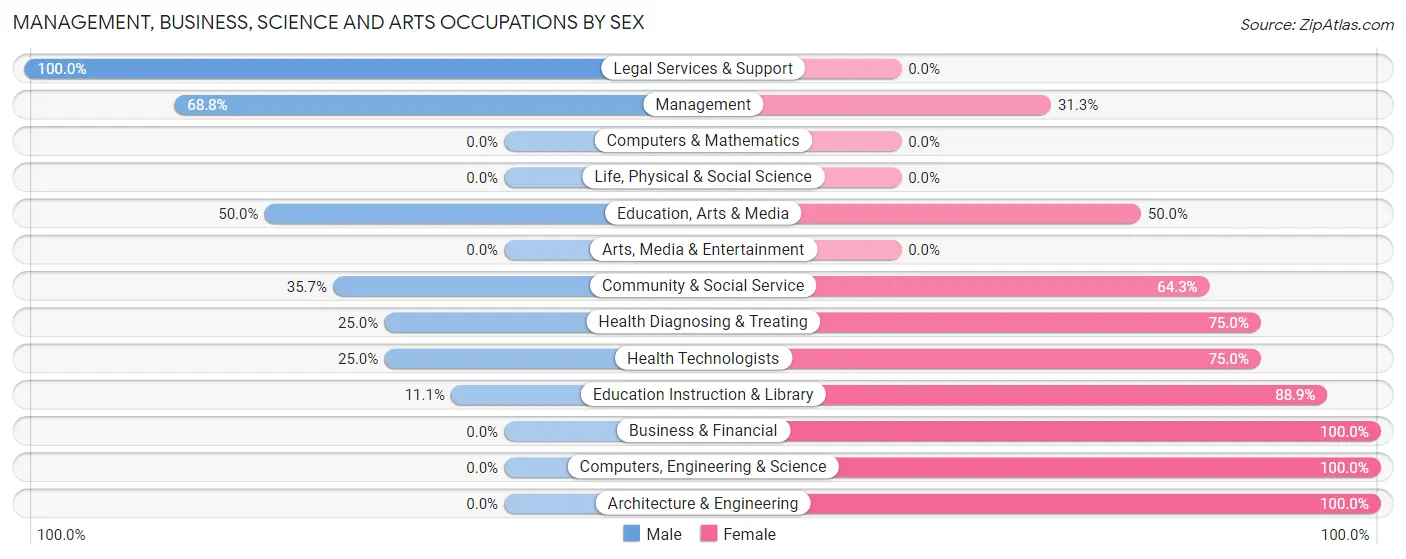
Management, Business, Science and Arts Occupations by Sex
Within the Management, Business, Science and Arts occupations in Ransom, the most male-oriented occupations are Legal Services & Support (100.0%), Management (68.8%), and Education, Arts & Media (50.0%), while the most female-oriented occupations are Business & Financial (100.0%), Computers, Engineering & Science (100.0%), and Architecture & Engineering (100.0%).
| Occupation | Male | Female |
| Management | 11 (68.8%) | 5 (31.2%) |
| Business & Financial | 0 (0.0%) | 6 (100.0%) |
| Computers, Engineering & Science | 0 (0.0%) | 2 (100.0%) |
| Computers & Mathematics | 0 (0.0%) | 0 (0.0%) |
| Architecture & Engineering | 0 (0.0%) | 2 (100.0%) |
| Life, Physical & Social Science | 0 (0.0%) | 0 (0.0%) |
| Community & Social Service | 5 (35.7%) | 9 (64.3%) |
| Education, Arts & Media | 1 (50.0%) | 1 (50.0%) |
| Legal Services & Support | 3 (100.0%) | 0 (0.0%) |
| Education Instruction & Library | 1 (11.1%) | 8 (88.9%) |
| Arts, Media & Entertainment | 0 (0.0%) | 0 (0.0%) |
| Health Diagnosing & Treating | 1 (25.0%) | 3 (75.0%) |
| Health Technologists | 1 (25.0%) | 3 (75.0%) |
| Total (Category) | 17 (40.5%) | 25 (59.5%) |
| Total (Overall) | 57 (43.9%) | 73 (56.1%) |
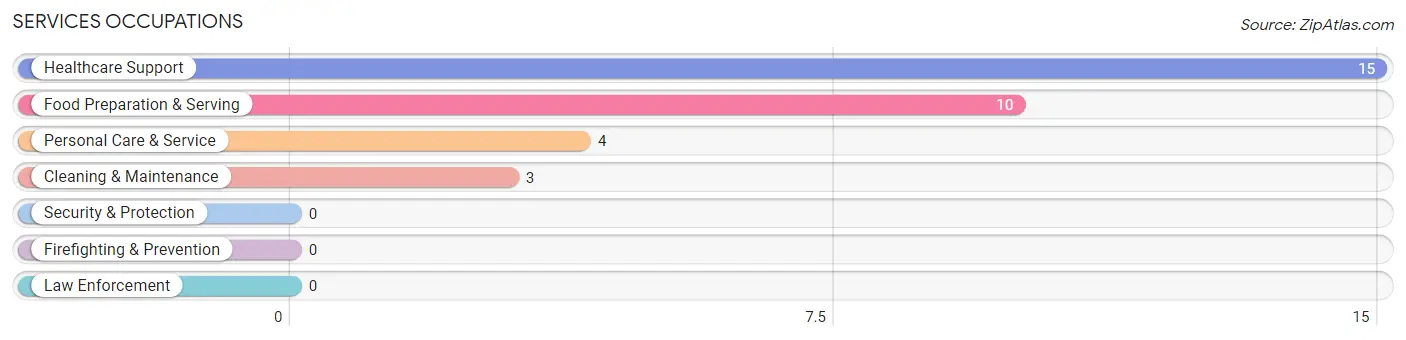
Services Occupations
The most common Services occupations in Ransom are Healthcare Support (15 | 11.5%), Food Preparation & Serving (10 | 7.7%), Personal Care & Service (4 | 3.1%), and Cleaning & Maintenance (3 | 2.3%).
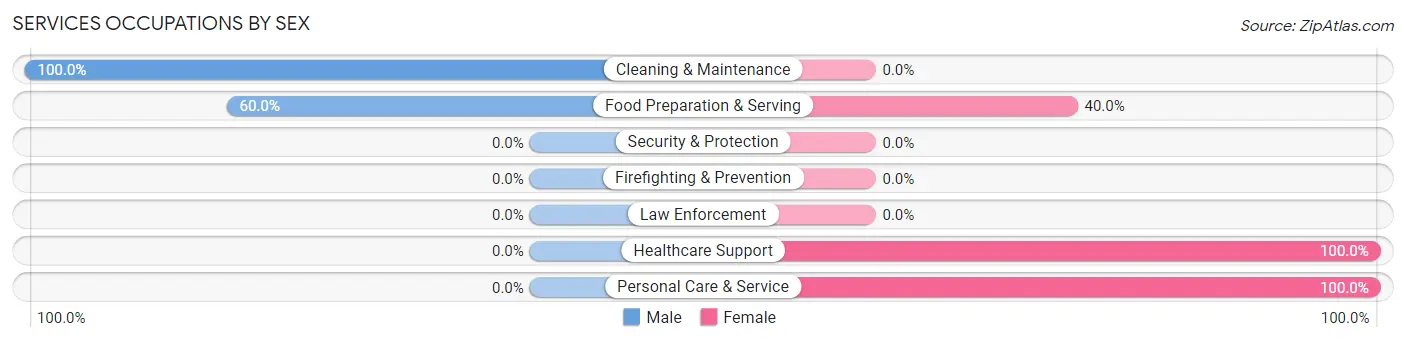
Services Occupations by Sex
Within the Services occupations in Ransom, the most male-oriented occupations are Cleaning & Maintenance (100.0%), and Food Preparation & Serving (60.0%), while the most female-oriented occupations are Healthcare Support (100.0%), Personal Care & Service (100.0%), and Food Preparation & Serving (40.0%).
| Occupation | Male | Female |
| Healthcare Support | 0 (0.0%) | 15 (100.0%) |
| Security & Protection | 0 (0.0%) | 0 (0.0%) |
| Firefighting & Prevention | 0 (0.0%) | 0 (0.0%) |
| Law Enforcement | 0 (0.0%) | 0 (0.0%) |
| Food Preparation & Serving | 6 (60.0%) | 4 (40.0%) |
| Cleaning & Maintenance | 3 (100.0%) | 0 (0.0%) |
| Personal Care & Service | 0 (0.0%) | 4 (100.0%) |
| Total (Category) | 9 (28.1%) | 23 (71.9%) |
| Total (Overall) | 57 (43.9%) | 73 (56.1%) |
Sales and Office Occupations
The most common Sales and Office occupations in Ransom are Office & Administration (16 | 12.3%), and Sales & Related (8 | 6.1%).
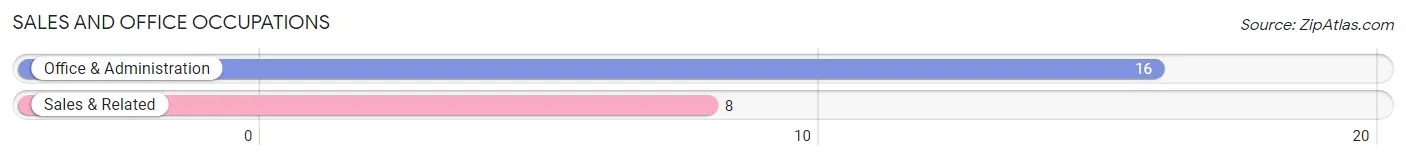
Sales and Office Occupations by Sex
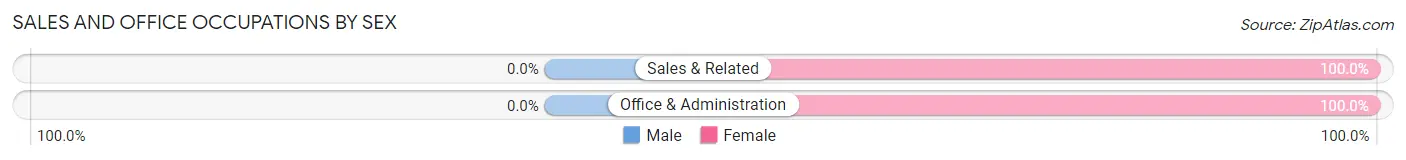
| Occupation | Male | Female |
| Sales & Related | 0 (0.0%) | 8 (100.0%) |
| Office & Administration | 0 (0.0%) | 16 (100.0%) |
| Total (Category) | 0 (0.0%) | 24 (100.0%) |
| Total (Overall) | 57 (43.9%) | 73 (56.1%) |
Natural Resources, Construction and Maintenance Occupations
The most common Natural Resources, Construction and Maintenance occupations in Ransom are Installation, Maintenance & Repair (11 | 8.5%), Construction & Extraction (10 | 7.7%), and Farming, Fishing & Forestry (3 | 2.3%).
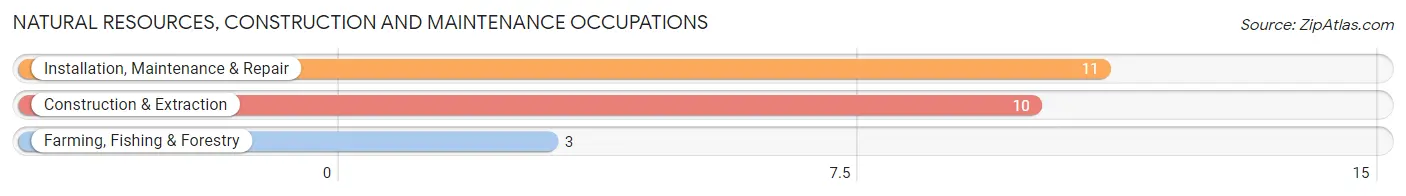
Natural Resources, Construction and Maintenance Occupations by Sex
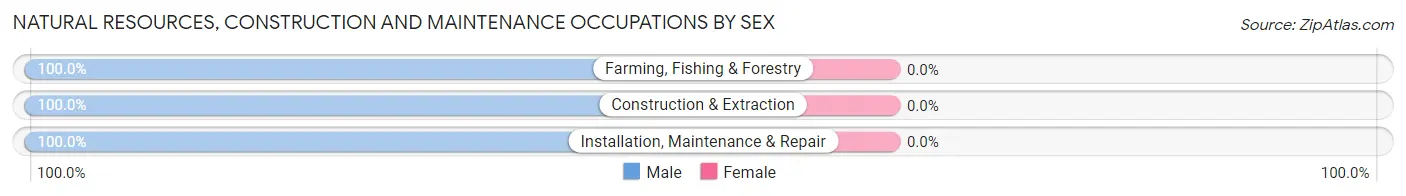
| Occupation | Male | Female |
| Farming, Fishing & Forestry | 3 (100.0%) | 0 (0.0%) |
| Construction & Extraction | 10 (100.0%) | 0 (0.0%) |
| Installation, Maintenance & Repair | 11 (100.0%) | 0 (0.0%) |
| Total (Category) | 24 (100.0%) | 0 (0.0%) |
| Total (Overall) | 57 (43.9%) | 73 (56.1%) |
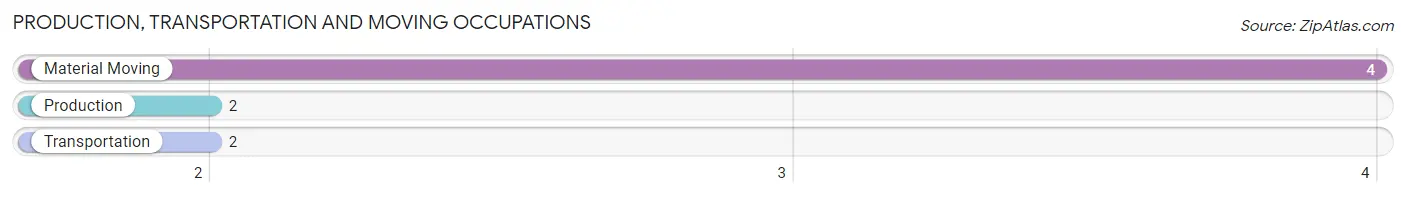
Production, Transportation and Moving Occupations
The most common Production, Transportation and Moving occupations in Ransom are Material Moving (4 | 3.1%), Production (2 | 1.5%), and Transportation (2 | 1.5%).
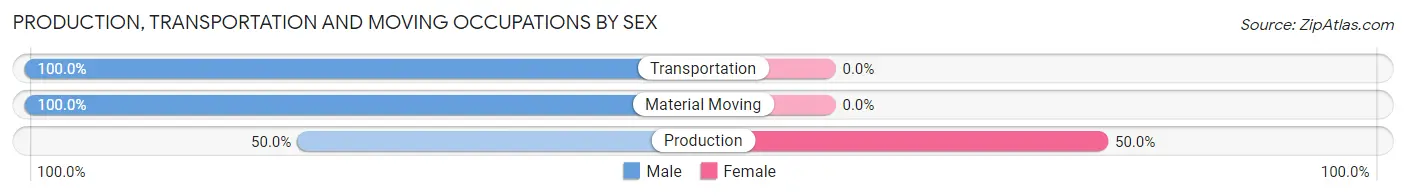
Production, Transportation and Moving Occupations by Sex
| Occupation | Male | Female |
| Production | 1 (50.0%) | 1 (50.0%) |
| Transportation | 2 (100.0%) | 0 (0.0%) |
| Material Moving | 4 (100.0%) | 0 (0.0%) |
| Total (Category) | 7 (87.5%) | 1 (12.5%) |
| Total (Overall) | 57 (43.9%) | 73 (56.1%) |
Employment Industries by Sex in Ransom
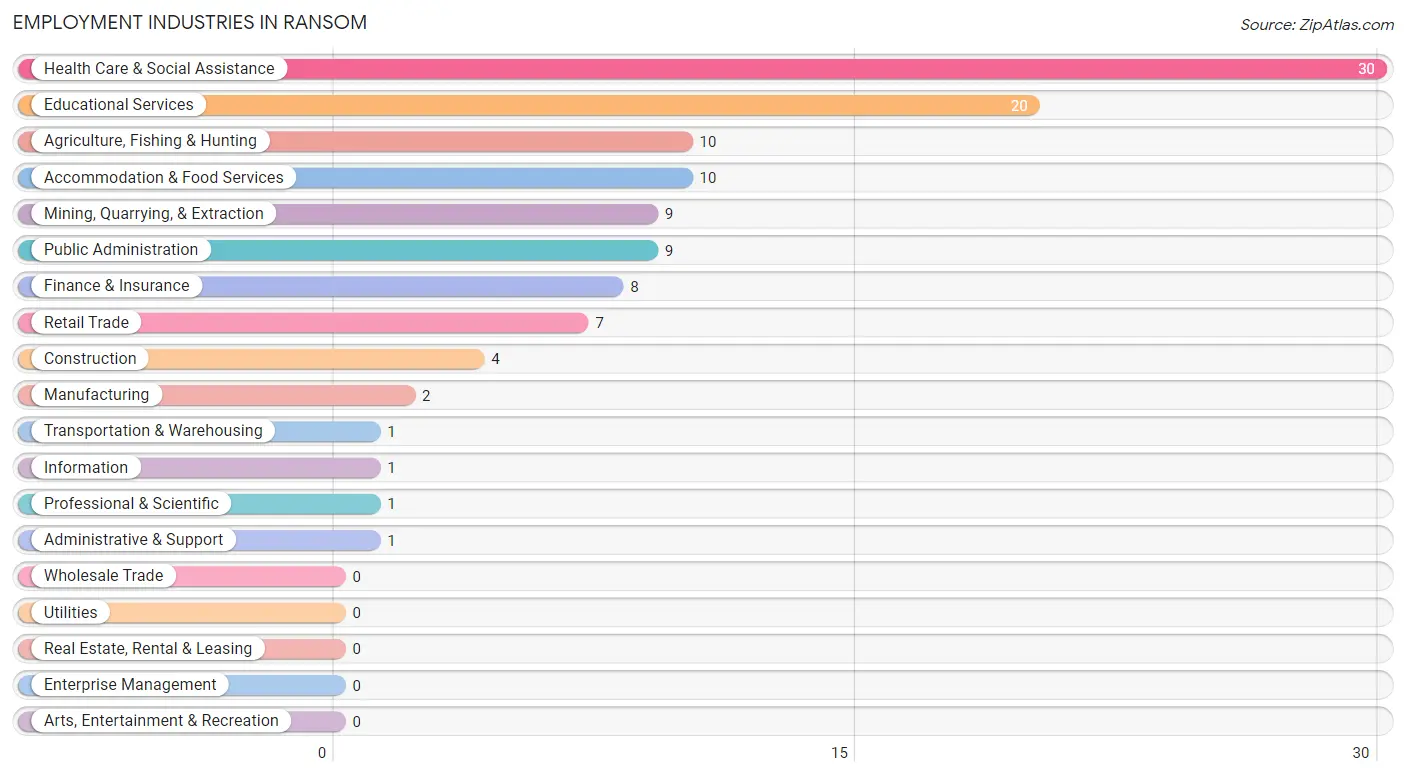
Employment Industries in Ransom
The major employment industries in Ransom include Health Care & Social Assistance (30 | 23.1%), Educational Services (20 | 15.4%), Agriculture, Fishing & Hunting (10 | 7.7%), Accommodation & Food Services (10 | 7.7%), and Mining, Quarrying, & Extraction (9 | 6.9%).
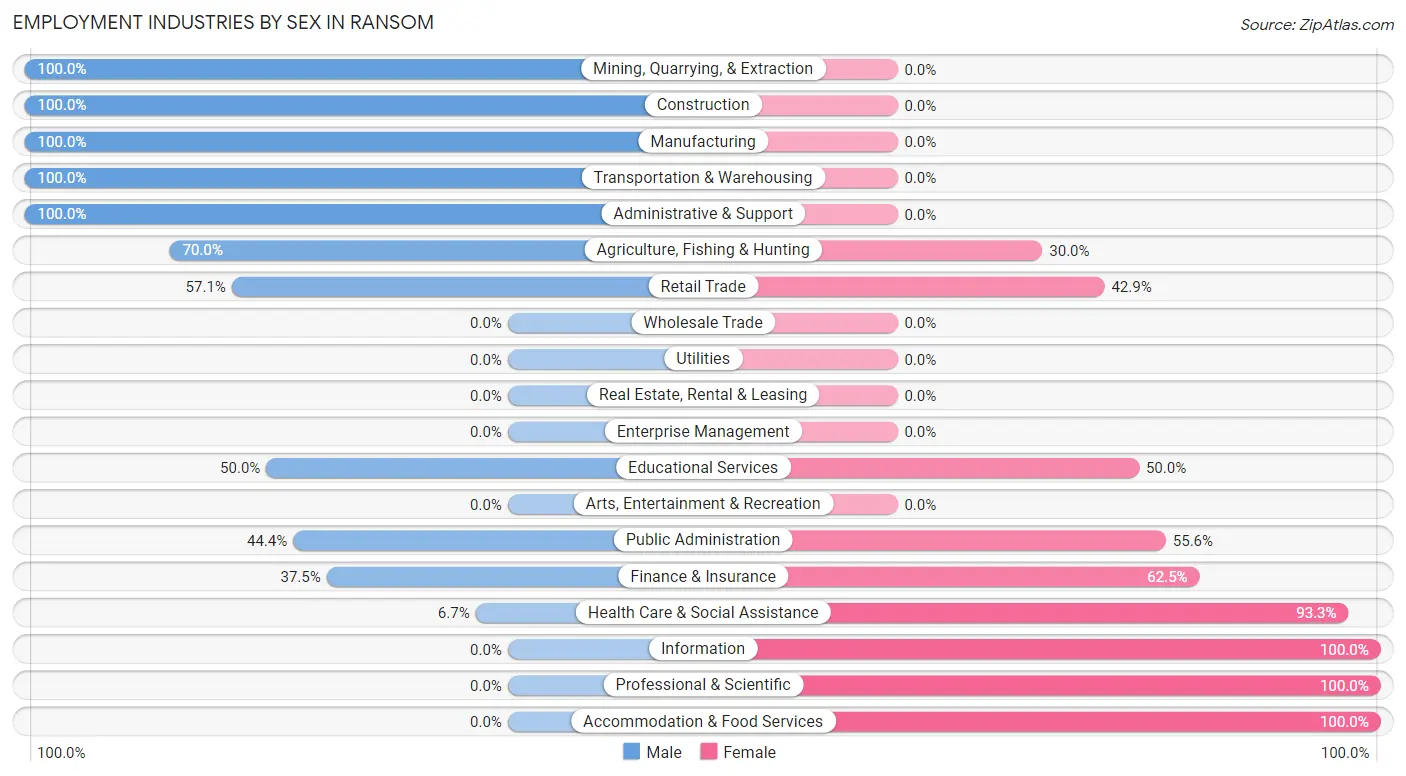
Employment Industries by Sex in Ransom
The Ransom industries that see more men than women are Mining, Quarrying, & Extraction (100.0%), Construction (100.0%), and Manufacturing (100.0%), whereas the industries that tend to have a higher number of women are Information (100.0%), Professional & Scientific (100.0%), and Accommodation & Food Services (100.0%).
| Industry | Male | Female |
| Agriculture, Fishing & Hunting | 7 (70.0%) | 3 (30.0%) |
| Mining, Quarrying, & Extraction | 9 (100.0%) | 0 (0.0%) |
| Construction | 4 (100.0%) | 0 (0.0%) |
| Manufacturing | 2 (100.0%) | 0 (0.0%) |
| Wholesale Trade | 0 (0.0%) | 0 (0.0%) |
| Retail Trade | 4 (57.1%) | 3 (42.9%) |
| Transportation & Warehousing | 1 (100.0%) | 0 (0.0%) |
| Utilities | 0 (0.0%) | 0 (0.0%) |
| Information | 0 (0.0%) | 1 (100.0%) |
| Finance & Insurance | 3 (37.5%) | 5 (62.5%) |
| Real Estate, Rental & Leasing | 0 (0.0%) | 0 (0.0%) |
| Professional & Scientific | 0 (0.0%) | 1 (100.0%) |
| Enterprise Management | 0 (0.0%) | 0 (0.0%) |
| Administrative & Support | 1 (100.0%) | 0 (0.0%) |
| Educational Services | 10 (50.0%) | 10 (50.0%) |
| Health Care & Social Assistance | 2 (6.7%) | 28 (93.3%) |
| Arts, Entertainment & Recreation | 0 (0.0%) | 0 (0.0%) |
| Accommodation & Food Services | 0 (0.0%) | 10 (100.0%) |
| Public Administration | 4 (44.4%) | 5 (55.6%) |
| Total | 57 (43.9%) | 73 (56.1%) |
Education in Ransom
School Enrollment in Ransom
The most common levels of schooling among the 49 students in Ransom are high school (24 | 49.0%), middle school (16 | 32.7%), and elementary school (4 | 8.2%).
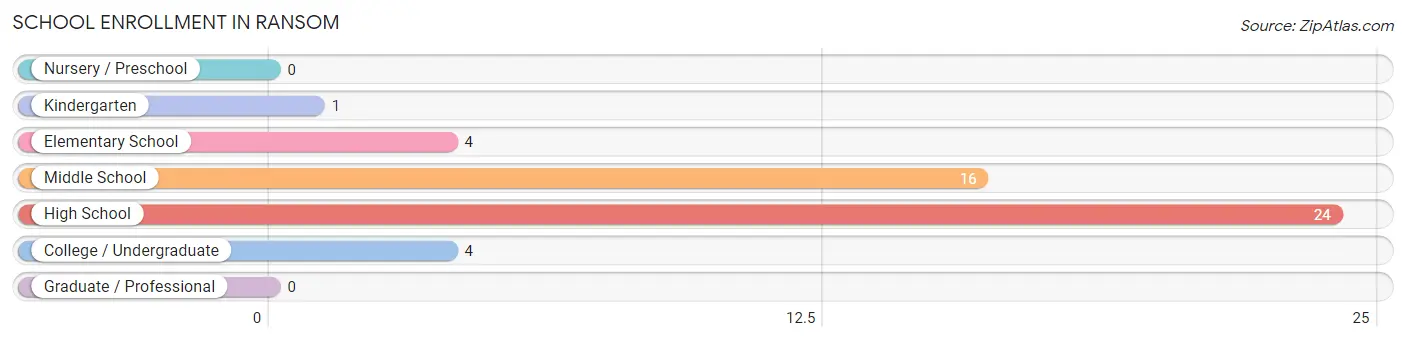
| School Level | # Students | % Students |
| Nursery / Preschool | 0 | 0.0% |
| Kindergarten | 1 | 2.0% |
| Elementary School | 4 | 8.2% |
| Middle School | 16 | 32.7% |
| High School | 24 | 49.0% |
| College / Undergraduate | 4 | 8.2% |
| Graduate / Professional | 0 | 0.0% |
| Total | 49 | 100.0% |
School Enrollment by Age by Funding Source in Ransom
Out of a total of 49 students who are enrolled in schools in Ransom, 2 (4.1%) attend a private institution, while the remaining 47 (95.9%) are enrolled in public schools. The age group of 5 to 9 year old has the highest likelihood of being enrolled in private schools, with 2 (40.0% in the age bracket) enrolled. Conversely, the age group of 10 to 14 year olds has the lowest likelihood of being enrolled in a private school, with 19 (100.0% in the age bracket) attending a public institution.
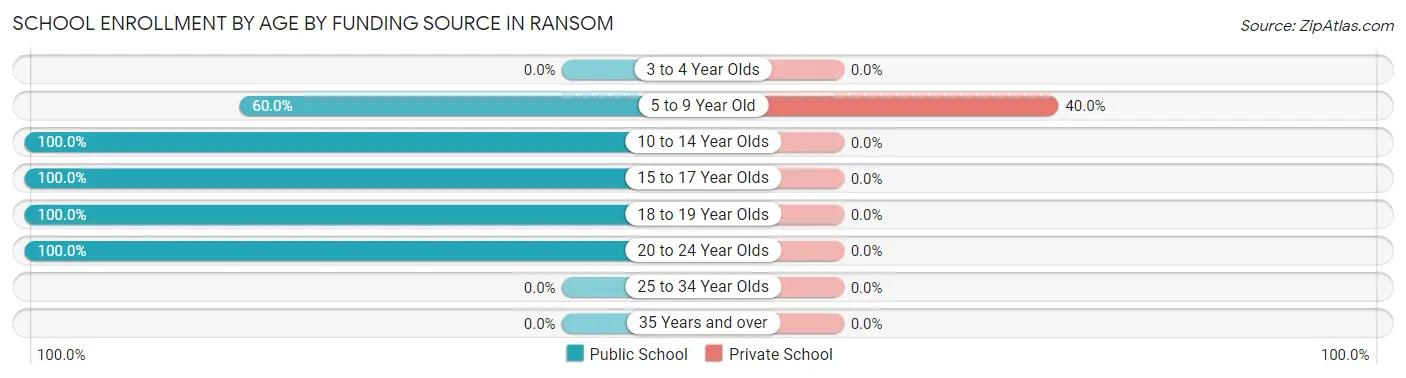
| Age Bracket | Public School | Private School |
| 3 to 4 Year Olds | 0 (0.0%) | 0 (0.0%) |
| 5 to 9 Year Old | 3 (60.0%) | 2 (40.0%) |
| 10 to 14 Year Olds | 19 (100.0%) | 0 (0.0%) |
| 15 to 17 Year Olds | 15 (100.0%) | 0 (0.0%) |
| 18 to 19 Year Olds | 6 (100.0%) | 0 (0.0%) |
| 20 to 24 Year Olds | 4 (100.0%) | 0 (0.0%) |
| 25 to 34 Year Olds | 0 (0.0%) | 0 (0.0%) |
| 35 Years and over | 0 (0.0%) | 0 (0.0%) |
| Total | 47 (95.9%) | 2 (4.1%) |
Educational Attainment by Field of Study in Ransom
Communications (11 | 25.6%), bio, nature & agricultural (7 | 16.3%), business (7 | 16.3%), social sciences (6 | 14.0%), and education (6 | 14.0%) are the most common fields of study among 43 individuals in Ransom who have obtained a bachelor's degree or higher.
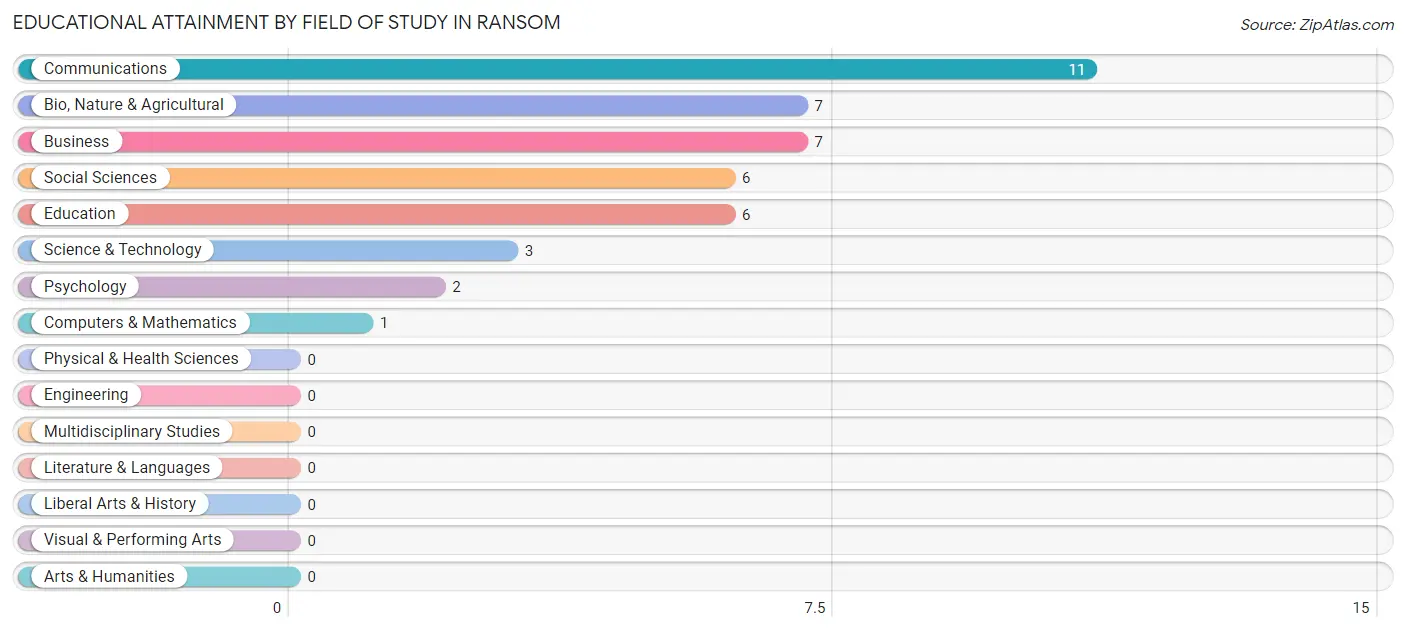
| Field of Study | # Graduates | % Graduates |
| Computers & Mathematics | 1 | 2.3% |
| Bio, Nature & Agricultural | 7 | 16.3% |
| Physical & Health Sciences | 0 | 0.0% |
| Psychology | 2 | 4.6% |
| Social Sciences | 6 | 14.0% |
| Engineering | 0 | 0.0% |
| Multidisciplinary Studies | 0 | 0.0% |
| Science & Technology | 3 | 7.0% |
| Business | 7 | 16.3% |
| Education | 6 | 14.0% |
| Literature & Languages | 0 | 0.0% |
| Liberal Arts & History | 0 | 0.0% |
| Visual & Performing Arts | 0 | 0.0% |
| Communications | 11 | 25.6% |
| Arts & Humanities | 0 | 0.0% |
| Total | 43 | 100.0% |
Transportation & Commute in Ransom
Vehicle Availability by Sex in Ransom
The most prevalent vehicle ownership categories in Ransom are males with 2 vehicles (28, accounting for 50.0%) and females with 2 vehicles (42, making up 38.4%).
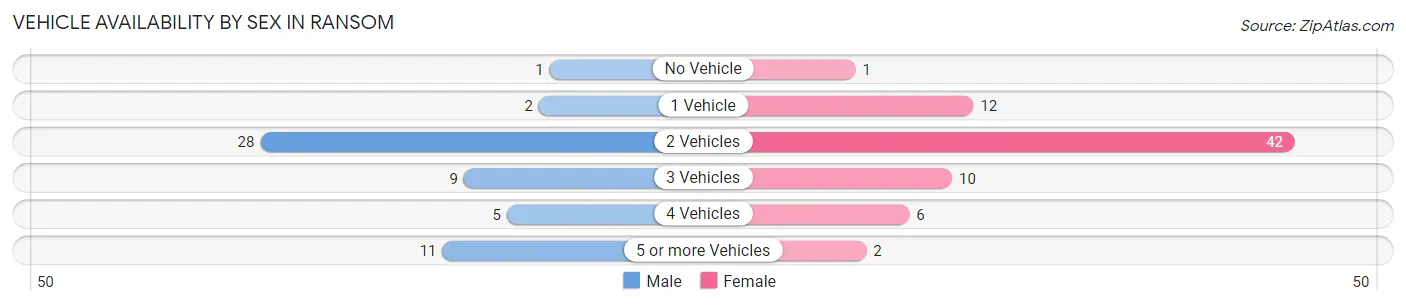
| Vehicles Available | Male | Female |
| No Vehicle | 1 (1.8%) | 1 (1.4%) |
| 1 Vehicle | 2 (3.6%) | 12 (16.4%) |
| 2 Vehicles | 28 (50.0%) | 42 (57.5%) |
| 3 Vehicles | 9 (16.1%) | 10 (13.7%) |
| 4 Vehicles | 5 (8.9%) | 6 (8.2%) |
| 5 or more Vehicles | 11 (19.6%) | 2 (2.7%) |
| Total | 56 (100.0%) | 73 (100.0%) |
Commute Time in Ransom
The most frequently occuring commute durations in Ransom are less than 5 minutes (30 commuters, 23.4%), 5 to 9 minutes (26 commuters, 20.3%), and 15 to 19 minutes (22 commuters, 17.2%).
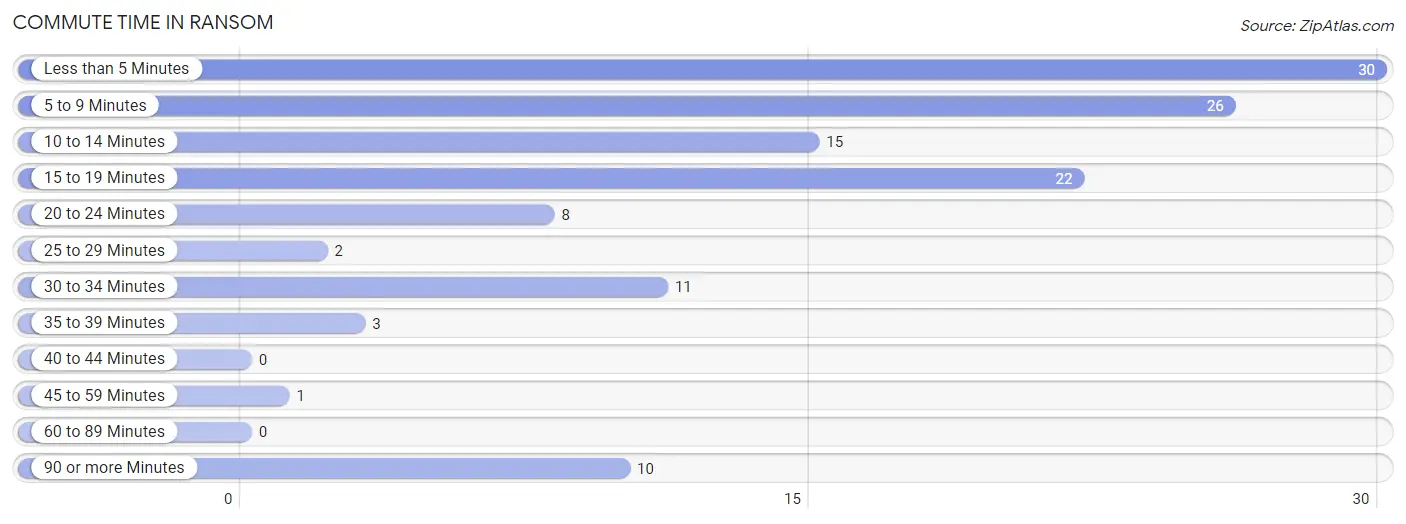
| Commute Time | # Commuters | % Commuters |
| Less than 5 Minutes | 30 | 23.4% |
| 5 to 9 Minutes | 26 | 20.3% |
| 10 to 14 Minutes | 15 | 11.7% |
| 15 to 19 Minutes | 22 | 17.2% |
| 20 to 24 Minutes | 8 | 6.2% |
| 25 to 29 Minutes | 2 | 1.6% |
| 30 to 34 Minutes | 11 | 8.6% |
| 35 to 39 Minutes | 3 | 2.3% |
| 40 to 44 Minutes | 0 | 0.0% |
| 45 to 59 Minutes | 1 | 0.8% |
| 60 to 89 Minutes | 0 | 0.0% |
| 90 or more Minutes | 10 | 7.8% |
Commute Time by Sex in Ransom
The most common commute times in Ransom are 5 to 9 minutes (20 commuters, 35.7%) for males and 15 to 19 minutes (16 commuters, 22.2%) for females.
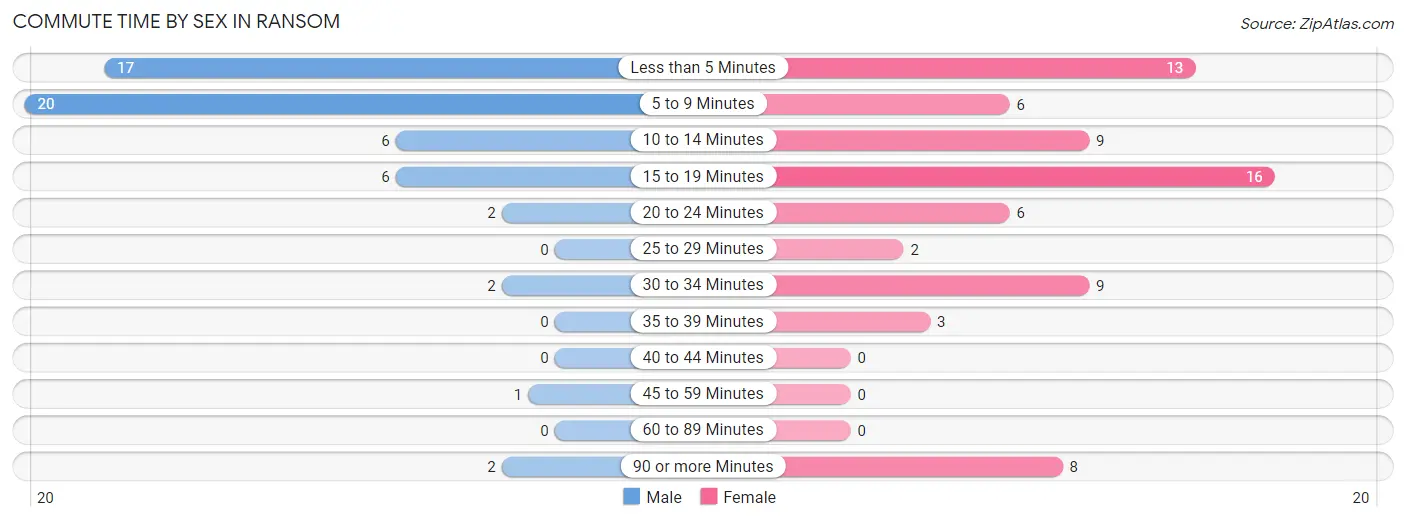
| Commute Time | Male | Female |
| Less than 5 Minutes | 17 (30.4%) | 13 (18.1%) |
| 5 to 9 Minutes | 20 (35.7%) | 6 (8.3%) |
| 10 to 14 Minutes | 6 (10.7%) | 9 (12.5%) |
| 15 to 19 Minutes | 6 (10.7%) | 16 (22.2%) |
| 20 to 24 Minutes | 2 (3.6%) | 6 (8.3%) |
| 25 to 29 Minutes | 0 (0.0%) | 2 (2.8%) |
| 30 to 34 Minutes | 2 (3.6%) | 9 (12.5%) |
| 35 to 39 Minutes | 0 (0.0%) | 3 (4.2%) |
| 40 to 44 Minutes | 0 (0.0%) | 0 (0.0%) |
| 45 to 59 Minutes | 1 (1.8%) | 0 (0.0%) |
| 60 to 89 Minutes | 0 (0.0%) | 0 (0.0%) |
| 90 or more Minutes | 2 (3.6%) | 8 (11.1%) |
Time of Departure to Work by Sex in Ransom
The most frequent times of departure to work in Ransom are 6:30 AM to 6:59 AM (16, 28.6%) for males and 7:00 AM to 7:29 AM (13, 18.1%) for females.
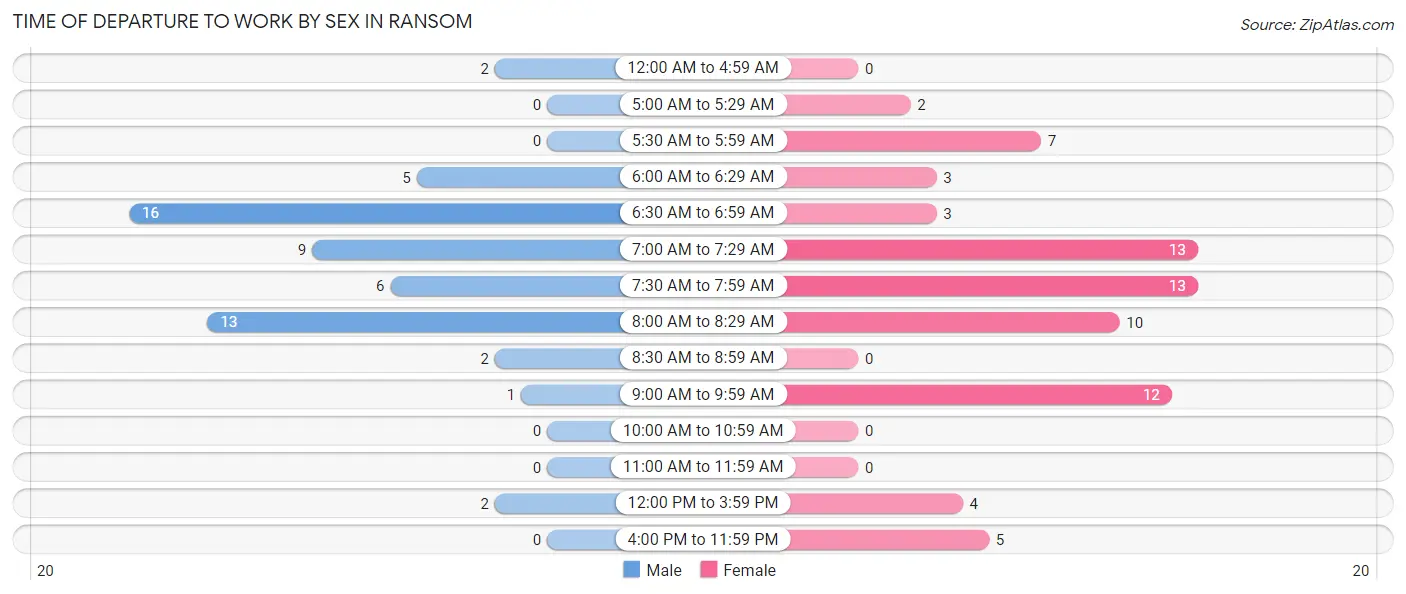
| Time of Departure | Male | Female |
| 12:00 AM to 4:59 AM | 2 (3.6%) | 0 (0.0%) |
| 5:00 AM to 5:29 AM | 0 (0.0%) | 2 (2.8%) |
| 5:30 AM to 5:59 AM | 0 (0.0%) | 7 (9.7%) |
| 6:00 AM to 6:29 AM | 5 (8.9%) | 3 (4.2%) |
| 6:30 AM to 6:59 AM | 16 (28.6%) | 3 (4.2%) |
| 7:00 AM to 7:29 AM | 9 (16.1%) | 13 (18.1%) |
| 7:30 AM to 7:59 AM | 6 (10.7%) | 13 (18.1%) |
| 8:00 AM to 8:29 AM | 13 (23.2%) | 10 (13.9%) |
| 8:30 AM to 8:59 AM | 2 (3.6%) | 0 (0.0%) |
| 9:00 AM to 9:59 AM | 1 (1.8%) | 12 (16.7%) |
| 10:00 AM to 10:59 AM | 0 (0.0%) | 0 (0.0%) |
| 11:00 AM to 11:59 AM | 0 (0.0%) | 0 (0.0%) |
| 12:00 PM to 3:59 PM | 2 (3.6%) | 4 (5.6%) |
| 4:00 PM to 11:59 PM | 0 (0.0%) | 5 (6.9%) |
| Total | 56 (100.0%) | 72 (100.0%) |
Housing Occupancy in Ransom
Occupancy by Ownership in Ransom
Of the total 116 dwellings in Ransom, owner-occupied units account for 101 (87.1%), while renter-occupied units make up 15 (12.9%).
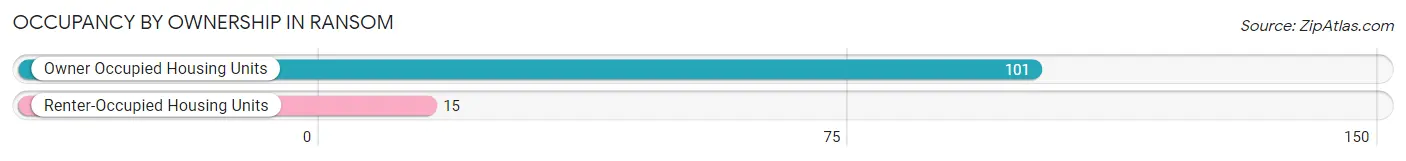
| Occupancy | # Housing Units | % Housing Units |
| Owner Occupied Housing Units | 101 | 87.1% |
| Renter-Occupied Housing Units | 15 | 12.9% |
| Total Occupied Housing Units | 116 | 100.0% |
Occupancy by Household Size in Ransom
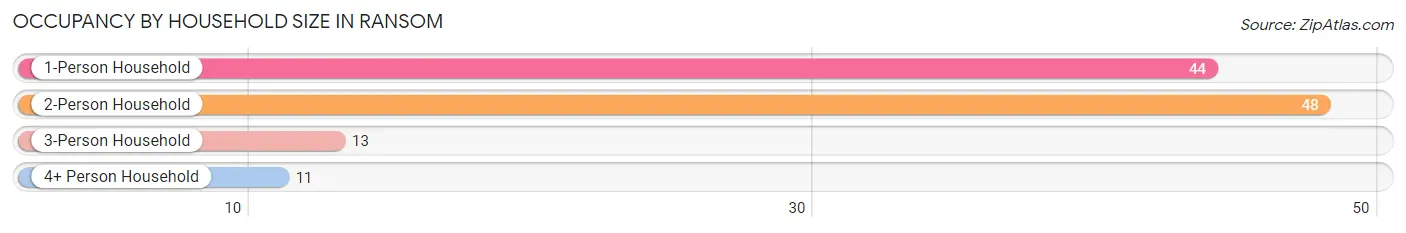
| Household Size | # Housing Units | % Housing Units |
| 1-Person Household | 44 | 37.9% |
| 2-Person Household | 48 | 41.4% |
| 3-Person Household | 13 | 11.2% |
| 4+ Person Household | 11 | 9.5% |
| Total Housing Units | 116 | 100.0% |
Occupancy by Ownership by Household Size in Ransom
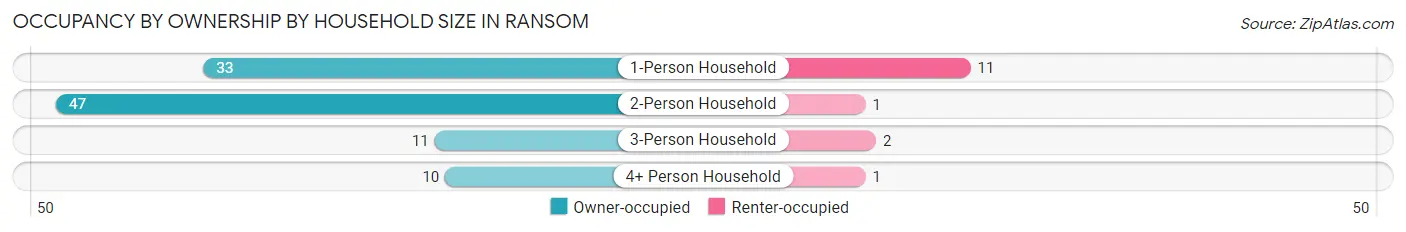
| Household Size | Owner-occupied | Renter-occupied |
| 1-Person Household | 33 (75.0%) | 11 (25.0%) |
| 2-Person Household | 47 (97.9%) | 1 (2.1%) |
| 3-Person Household | 11 (84.6%) | 2 (15.4%) |
| 4+ Person Household | 10 (90.9%) | 1 (9.1%) |
| Total Housing Units | 101 (87.1%) | 15 (12.9%) |
Occupancy by Educational Attainment in Ransom
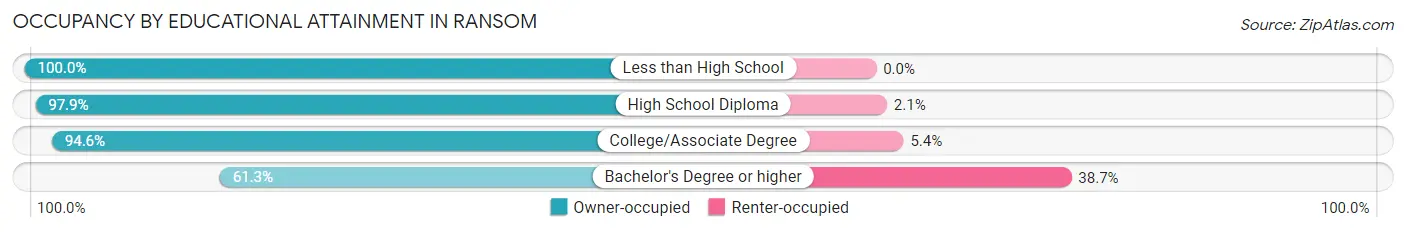
| Household Size | Owner-occupied | Renter-occupied |
| Less than High School | 1 (100.0%) | 0 (0.0%) |
| High School Diploma | 46 (97.9%) | 1 (2.1%) |
| College/Associate Degree | 35 (94.6%) | 2 (5.4%) |
| Bachelor's Degree or higher | 19 (61.3%) | 12 (38.7%) |
Occupancy by Age of Householder in Ransom
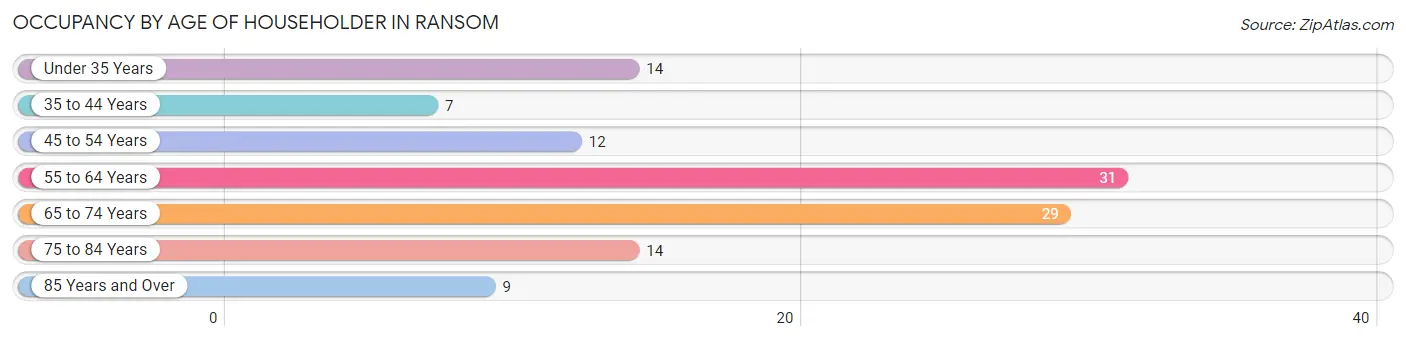
| Age Bracket | # Households | % Households |
| Under 35 Years | 14 | 12.1% |
| 35 to 44 Years | 7 | 6.0% |
| 45 to 54 Years | 12 | 10.3% |
| 55 to 64 Years | 31 | 26.7% |
| 65 to 74 Years | 29 | 25.0% |
| 75 to 84 Years | 14 | 12.1% |
| 85 Years and Over | 9 | 7.8% |
| Total | 116 | 100.0% |
Housing Finances in Ransom
Median Income by Occupancy in Ransom
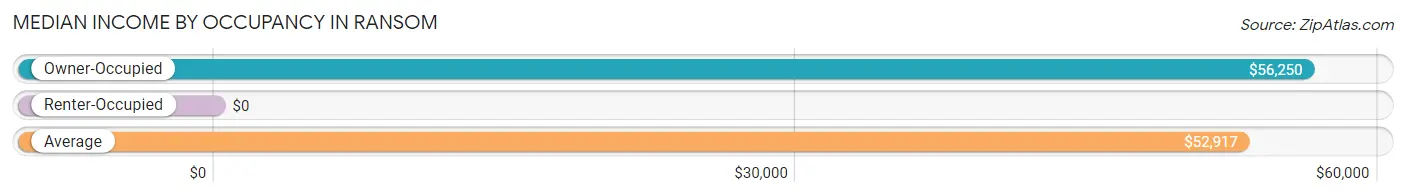
| Occupancy Type | # Households | Median Income |
| Owner-Occupied | 101 (87.1%) | $56,250 |
| Renter-Occupied | 15 (12.9%) | $0 |
| Average | 116 (100.0%) | $52,917 |
Occupancy by Householder Income Bracket in Ransom
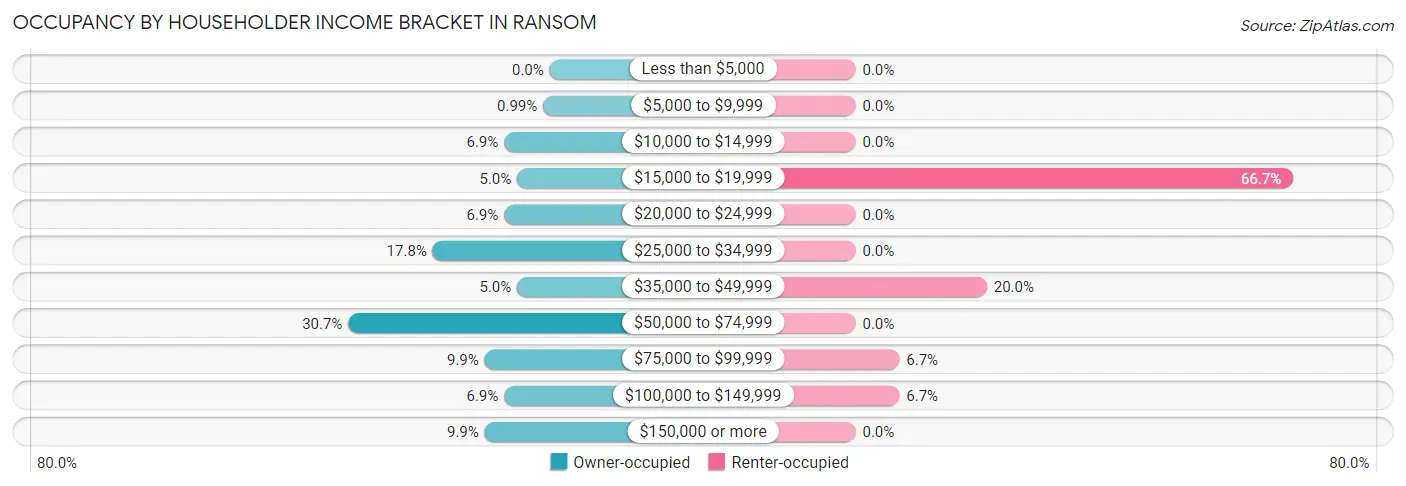
| Income Bracket | Owner-occupied | Renter-occupied |
| Less than $5,000 | 0 (0.0%) | 0 (0.0%) |
| $5,000 to $9,999 | 1 (1.0%) | 0 (0.0%) |
| $10,000 to $14,999 | 7 (6.9%) | 0 (0.0%) |
| $15,000 to $19,999 | 5 (5.0%) | 10 (66.7%) |
| $20,000 to $24,999 | 7 (6.9%) | 0 (0.0%) |
| $25,000 to $34,999 | 18 (17.8%) | 0 (0.0%) |
| $35,000 to $49,999 | 5 (5.0%) | 3 (20.0%) |
| $50,000 to $74,999 | 31 (30.7%) | 0 (0.0%) |
| $75,000 to $99,999 | 10 (9.9%) | 1 (6.7%) |
| $100,000 to $149,999 | 7 (6.9%) | 1 (6.7%) |
| $150,000 or more | 10 (9.9%) | 0 (0.0%) |
| Total | 101 (100.0%) | 15 (100.0%) |
Monthly Housing Cost Tiers in Ransom
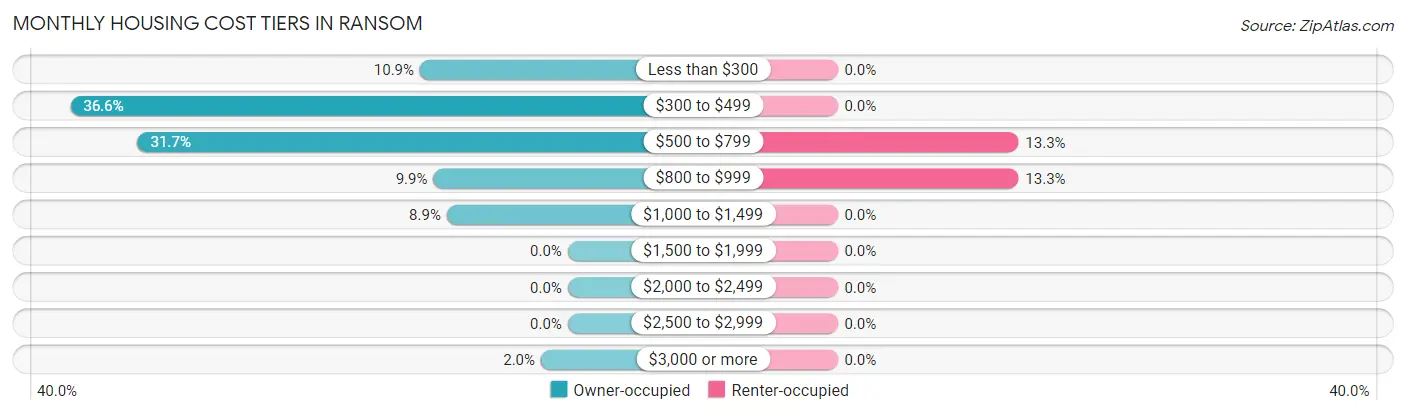
| Monthly Cost | Owner-occupied | Renter-occupied |
| Less than $300 | 11 (10.9%) | 0 (0.0%) |
| $300 to $499 | 37 (36.6%) | 0 (0.0%) |
| $500 to $799 | 32 (31.7%) | 2 (13.3%) |
| $800 to $999 | 10 (9.9%) | 2 (13.3%) |
| $1,000 to $1,499 | 9 (8.9%) | 0 (0.0%) |
| $1,500 to $1,999 | 0 (0.0%) | 0 (0.0%) |
| $2,000 to $2,499 | 0 (0.0%) | 0 (0.0%) |
| $2,500 to $2,999 | 0 (0.0%) | 0 (0.0%) |
| $3,000 or more | 2 (2.0%) | 0 (0.0%) |
| Total | 101 (100.0%) | 15 (100.0%) |
Physical Housing Characteristics in Ransom
Housing Structures in Ransom
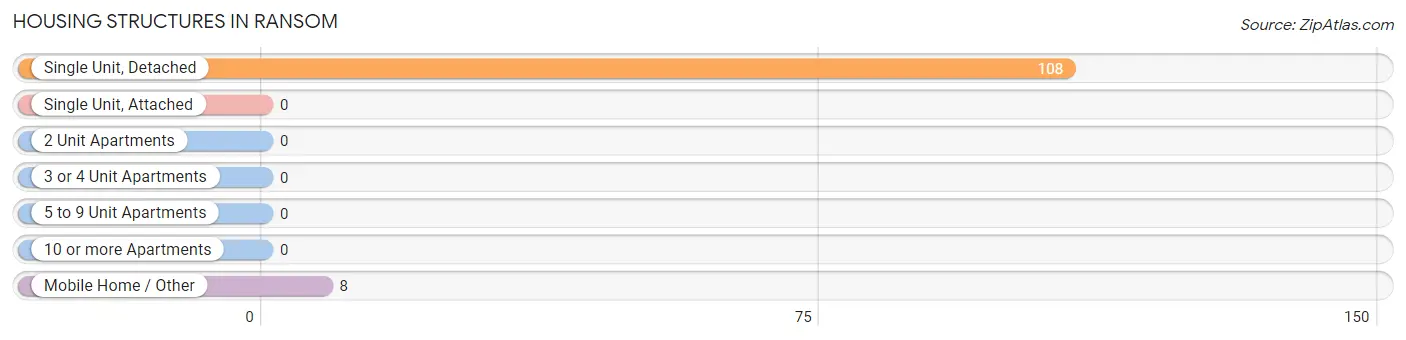
| Structure Type | # Housing Units | % Housing Units |
| Single Unit, Detached | 108 | 93.1% |
| Single Unit, Attached | 0 | 0.0% |
| 2 Unit Apartments | 0 | 0.0% |
| 3 or 4 Unit Apartments | 0 | 0.0% |
| 5 to 9 Unit Apartments | 0 | 0.0% |
| 10 or more Apartments | 0 | 0.0% |
| Mobile Home / Other | 8 | 6.9% |
| Total | 116 | 100.0% |
Housing Structures by Occupancy in Ransom
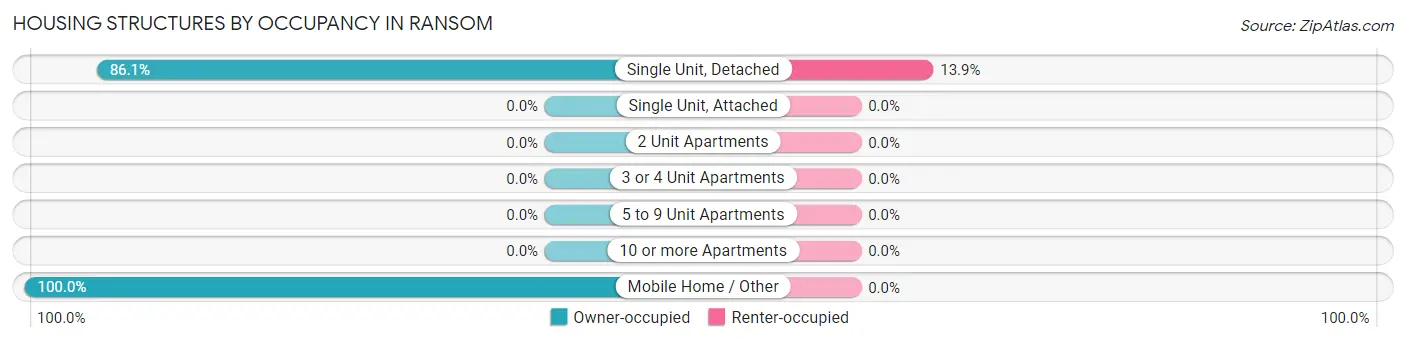
| Structure Type | Owner-occupied | Renter-occupied |
| Single Unit, Detached | 93 (86.1%) | 15 (13.9%) |
| Single Unit, Attached | 0 (0.0%) | 0 (0.0%) |
| 2 Unit Apartments | 0 (0.0%) | 0 (0.0%) |
| 3 or 4 Unit Apartments | 0 (0.0%) | 0 (0.0%) |
| 5 to 9 Unit Apartments | 0 (0.0%) | 0 (0.0%) |
| 10 or more Apartments | 0 (0.0%) | 0 (0.0%) |
| Mobile Home / Other | 8 (100.0%) | 0 (0.0%) |
| Total | 101 (87.1%) | 15 (12.9%) |
Housing Structures by Number of Rooms in Ransom
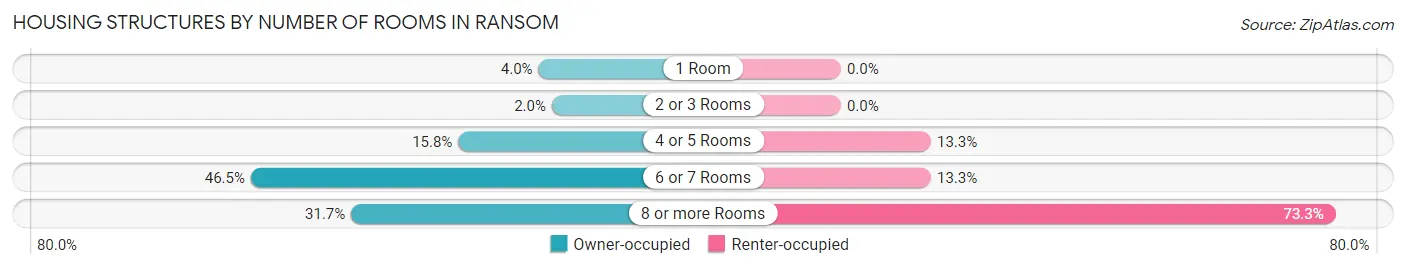
| Number of Rooms | Owner-occupied | Renter-occupied |
| 1 Room | 4 (4.0%) | 0 (0.0%) |
| 2 or 3 Rooms | 2 (2.0%) | 0 (0.0%) |
| 4 or 5 Rooms | 16 (15.8%) | 2 (13.3%) |
| 6 or 7 Rooms | 47 (46.5%) | 2 (13.3%) |
| 8 or more Rooms | 32 (31.7%) | 11 (73.3%) |
| Total | 101 (100.0%) | 15 (100.0%) |
Housing Structure by Heating Type in Ransom
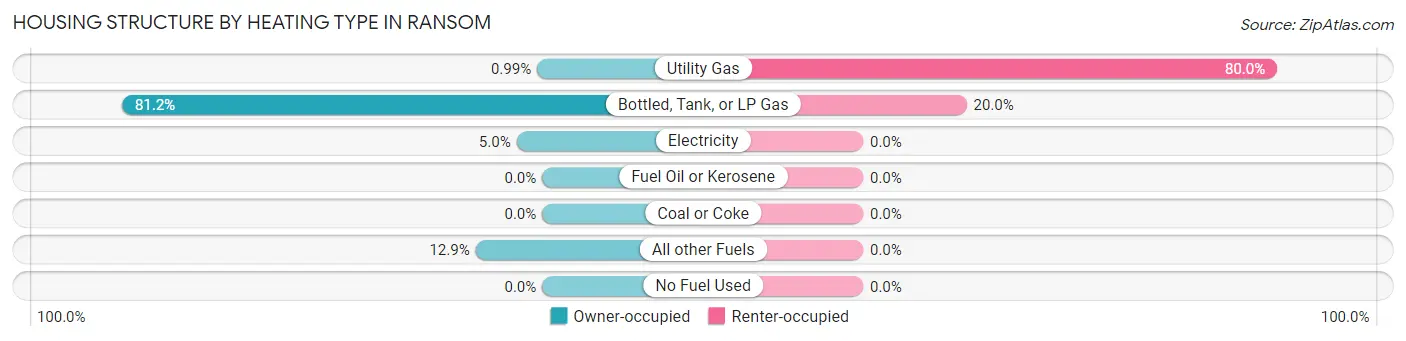
| Heating Type | Owner-occupied | Renter-occupied |
| Utility Gas | 1 (1.0%) | 12 (80.0%) |
| Bottled, Tank, or LP Gas | 82 (81.2%) | 3 (20.0%) |
| Electricity | 5 (5.0%) | 0 (0.0%) |
| Fuel Oil or Kerosene | 0 (0.0%) | 0 (0.0%) |
| Coal or Coke | 0 (0.0%) | 0 (0.0%) |
| All other Fuels | 13 (12.9%) | 0 (0.0%) |
| No Fuel Used | 0 (0.0%) | 0 (0.0%) |
| Total | 101 (100.0%) | 15 (100.0%) |
Household Vehicle Usage in Ransom
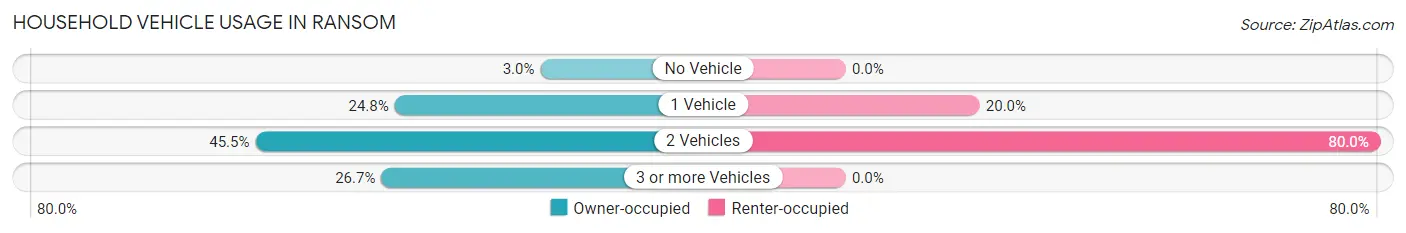
| Vehicles per Household | Owner-occupied | Renter-occupied |
| No Vehicle | 3 (3.0%) | 0 (0.0%) |
| 1 Vehicle | 25 (24.7%) | 3 (20.0%) |
| 2 Vehicles | 46 (45.5%) | 12 (80.0%) |
| 3 or more Vehicles | 27 (26.7%) | 0 (0.0%) |
| Total | 101 (100.0%) | 15 (100.0%) |
Real Estate & Mortgages in Ransom
Real Estate and Mortgage Overview in Ransom
| Characteristic | Without Mortgage | With Mortgage |
| Housing Units | 83 | 18 |
| Median Property Value | $51,900 | $60,000 |
| Median Household Income | $58,125 | $2 |
| Monthly Housing Costs | $468 | $2 |
| Real Estate Taxes | $1,318 | $0 |
Property Value by Mortgage Status in Ransom
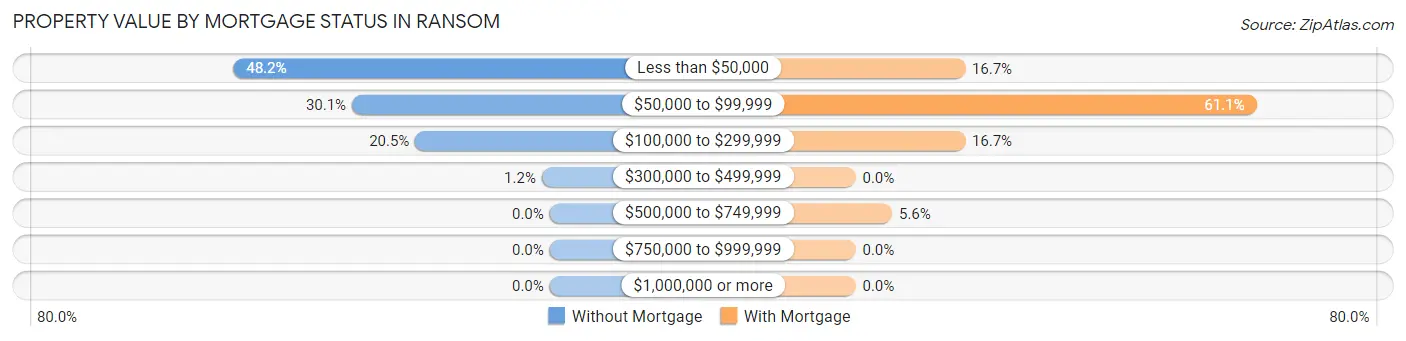
| Property Value | Without Mortgage | With Mortgage |
| Less than $50,000 | 40 (48.2%) | 3 (16.7%) |
| $50,000 to $99,999 | 25 (30.1%) | 11 (61.1%) |
| $100,000 to $299,999 | 17 (20.5%) | 3 (16.7%) |
| $300,000 to $499,999 | 1 (1.2%) | 0 (0.0%) |
| $500,000 to $749,999 | 0 (0.0%) | 1 (5.6%) |
| $750,000 to $999,999 | 0 (0.0%) | 0 (0.0%) |
| $1,000,000 or more | 0 (0.0%) | 0 (0.0%) |
| Total | 83 (100.0%) | 18 (100.0%) |
Household Income by Mortgage Status in Ransom
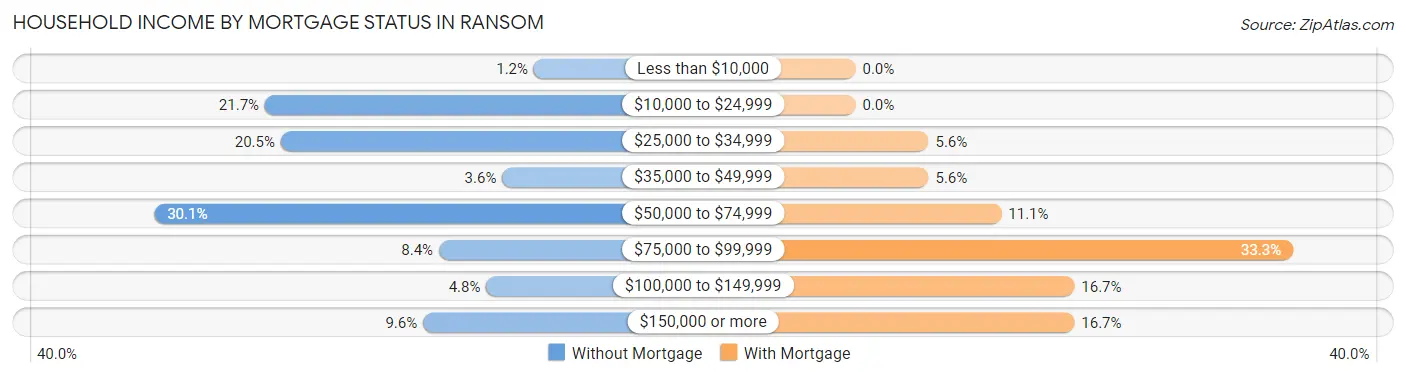
| Household Income | Without Mortgage | With Mortgage |
| Less than $10,000 | 1 (1.2%) | 0 (0.0%) |
| $10,000 to $24,999 | 18 (21.7%) | 0 (0.0%) |
| $25,000 to $34,999 | 17 (20.5%) | 1 (5.6%) |
| $35,000 to $49,999 | 3 (3.6%) | 1 (5.6%) |
| $50,000 to $74,999 | 25 (30.1%) | 2 (11.1%) |
| $75,000 to $99,999 | 7 (8.4%) | 6 (33.3%) |
| $100,000 to $149,999 | 4 (4.8%) | 3 (16.7%) |
| $150,000 or more | 8 (9.6%) | 3 (16.7%) |
| Total | 83 (100.0%) | 18 (100.0%) |
Property Value to Household Income Ratio in Ransom
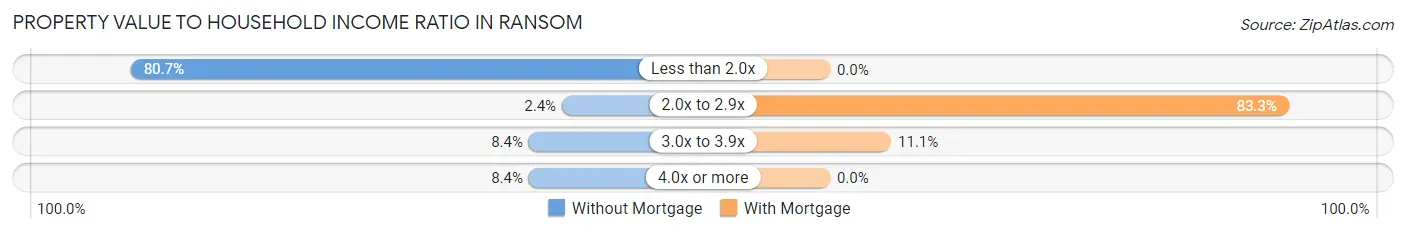
| Value-to-Income Ratio | Without Mortgage | With Mortgage |
| Less than 2.0x | 67 (80.7%) | 0 (0.0%) |
| 2.0x to 2.9x | 2 (2.4%) | 15 (83.3%) |
| 3.0x to 3.9x | 7 (8.4%) | 2 (11.1%) |
| 4.0x or more | 7 (8.4%) | 0 (0.0%) |
| Total | 83 (100.0%) | 18 (100.0%) |
Real Estate Taxes by Mortgage Status in Ransom
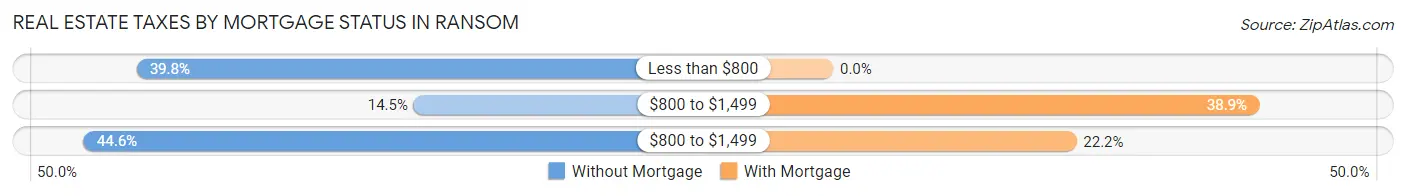
| Property Taxes | Without Mortgage | With Mortgage |
| Less than $800 | 33 (39.8%) | 0 (0.0%) |
| $800 to $1,499 | 12 (14.5%) | 7 (38.9%) |
| $800 to $1,499 | 37 (44.6%) | 4 (22.2%) |
| Total | 83 (100.0%) | 18 (100.0%) |
Health & Disability in Ransom
Health Insurance Coverage by Age in Ransom
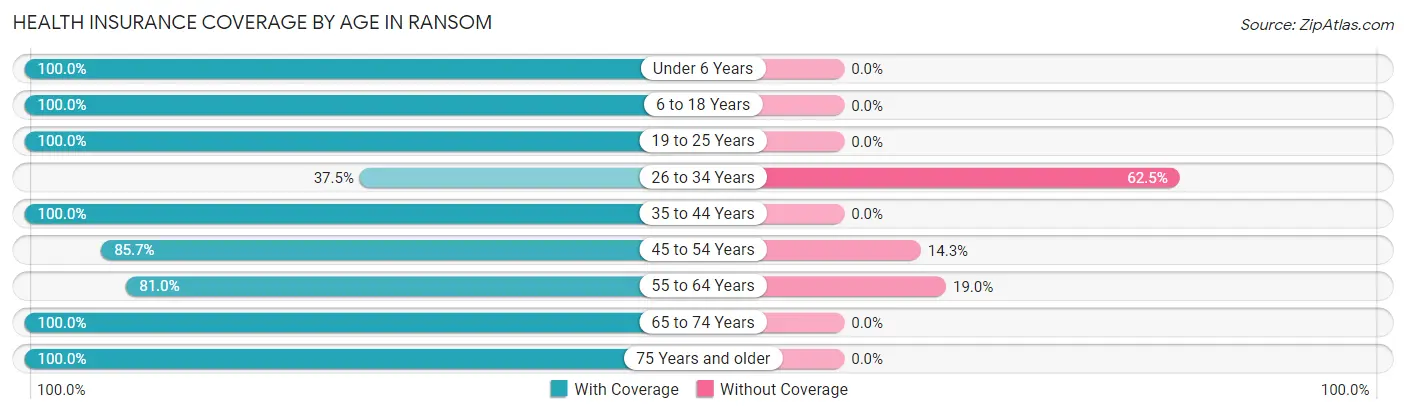
| Age Bracket | With Coverage | Without Coverage |
| Under 6 Years | 8 (100.0%) | 0 (0.0%) |
| 6 to 18 Years | 44 (100.0%) | 0 (0.0%) |
| 19 to 25 Years | 11 (100.0%) | 0 (0.0%) |
| 26 to 34 Years | 6 (37.5%) | 10 (62.5%) |
| 35 to 44 Years | 15 (100.0%) | 0 (0.0%) |
| 45 to 54 Years | 18 (85.7%) | 3 (14.3%) |
| 55 to 64 Years | 47 (81.0%) | 11 (19.0%) |
| 65 to 74 Years | 41 (100.0%) | 0 (0.0%) |
| 75 Years and older | 34 (100.0%) | 0 (0.0%) |
| Total | 224 (90.3%) | 24 (9.7%) |
Health Insurance Coverage by Citizenship Status in Ransom
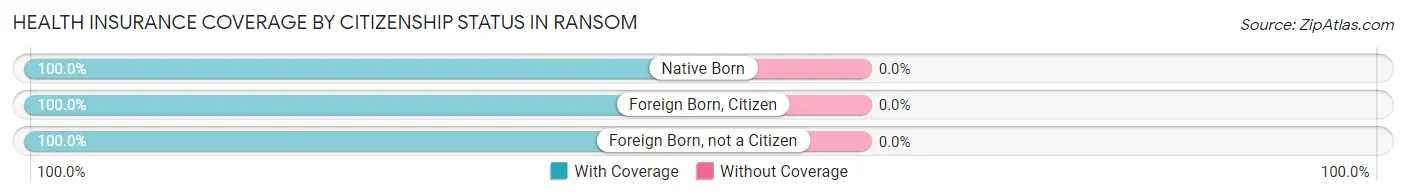
| Citizenship Status | With Coverage | Without Coverage |
| Native Born | 8 (100.0%) | 0 (0.0%) |
| Foreign Born, Citizen | 44 (100.0%) | 0 (0.0%) |
| Foreign Born, not a Citizen | 11 (100.0%) | 0 (0.0%) |
Health Insurance Coverage by Household Income in Ransom
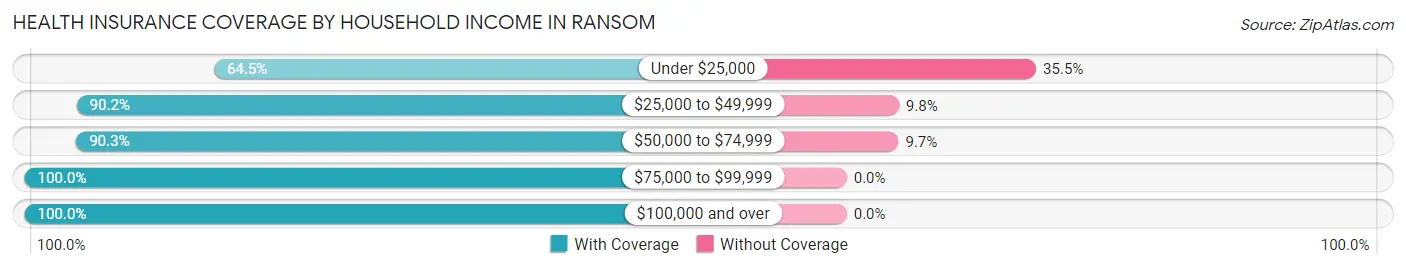
| Household Income | With Coverage | Without Coverage |
| Under $25,000 | 20 (64.5%) | 11 (35.5%) |
| $25,000 to $49,999 | 37 (90.2%) | 4 (9.8%) |
| $50,000 to $74,999 | 84 (90.3%) | 9 (9.7%) |
| $75,000 to $99,999 | 34 (100.0%) | 0 (0.0%) |
| $100,000 and over | 49 (100.0%) | 0 (0.0%) |
Public vs Private Health Insurance Coverage by Age in Ransom
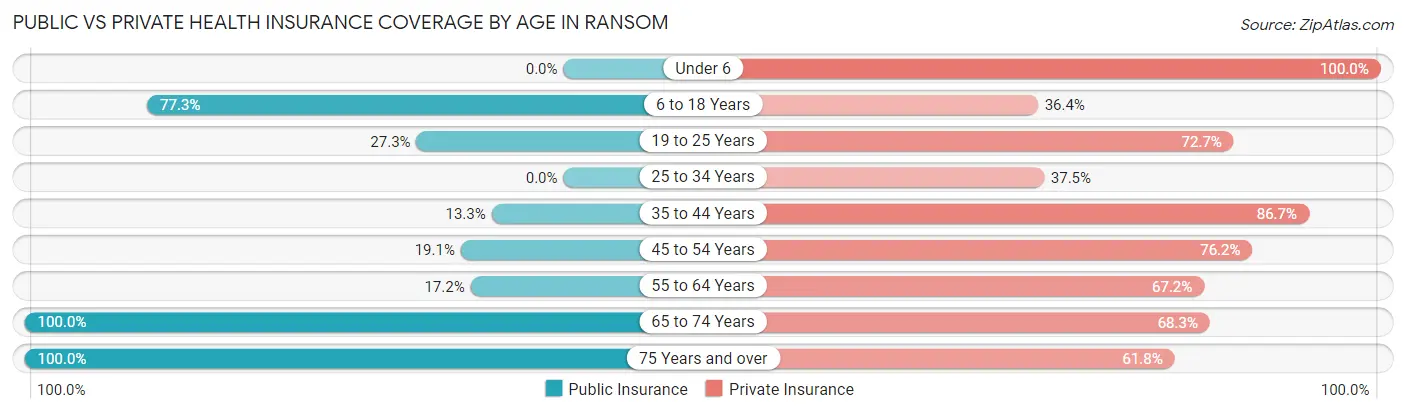
| Age Bracket | Public Insurance | Private Insurance |
| Under 6 | 0 (0.0%) | 8 (100.0%) |
| 6 to 18 Years | 34 (77.3%) | 16 (36.4%) |
| 19 to 25 Years | 3 (27.3%) | 8 (72.7%) |
| 25 to 34 Years | 0 (0.0%) | 6 (37.5%) |
| 35 to 44 Years | 2 (13.3%) | 13 (86.7%) |
| 45 to 54 Years | 4 (19.1%) | 16 (76.2%) |
| 55 to 64 Years | 10 (17.2%) | 39 (67.2%) |
| 65 to 74 Years | 41 (100.0%) | 28 (68.3%) |
| 75 Years and over | 34 (100.0%) | 21 (61.8%) |
| Total | 128 (51.6%) | 155 (62.5%) |
Disability Status by Sex by Age in Ransom
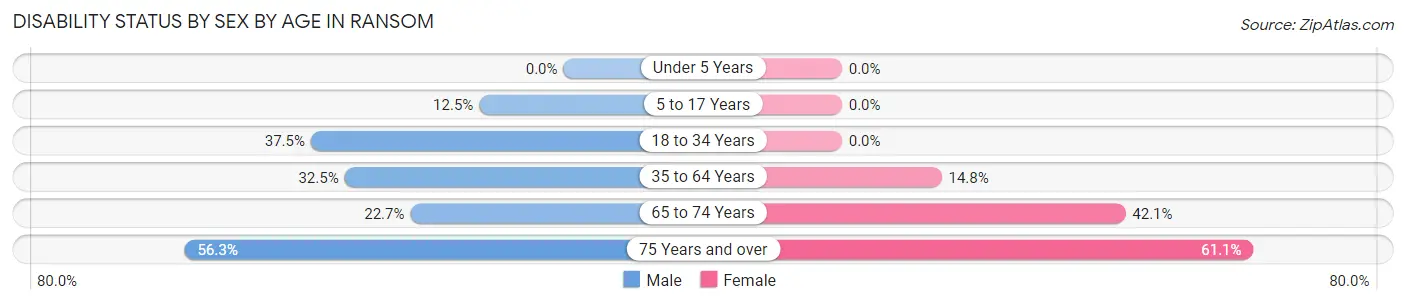
| Age Bracket | Male | Female |
| Under 5 Years | 0 (0.0%) | 0 (0.0%) |
| 5 to 17 Years | 1 (12.5%) | 0 (0.0%) |
| 18 to 34 Years | 9 (37.5%) | 0 (0.0%) |
| 35 to 64 Years | 13 (32.5%) | 8 (14.8%) |
| 65 to 74 Years | 5 (22.7%) | 8 (42.1%) |
| 75 Years and over | 9 (56.2%) | 11 (61.1%) |
Disability Class by Sex by Age in Ransom
Disability Class: Hearing Difficulty
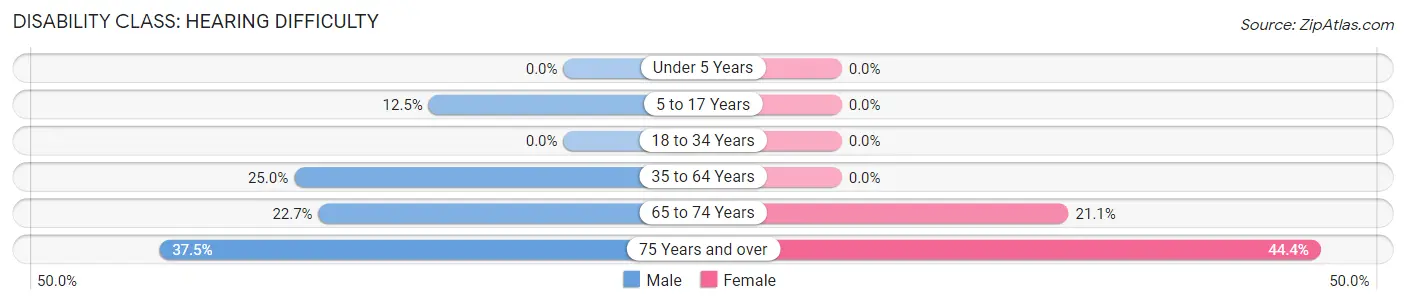
| Age Bracket | Male | Female |
| Under 5 Years | 0 (0.0%) | 0 (0.0%) |
| 5 to 17 Years | 1 (12.5%) | 0 (0.0%) |
| 18 to 34 Years | 0 (0.0%) | 0 (0.0%) |
| 35 to 64 Years | 10 (25.0%) | 0 (0.0%) |
| 65 to 74 Years | 5 (22.7%) | 4 (21.0%) |
| 75 Years and over | 6 (37.5%) | 8 (44.4%) |
Disability Class: Vision Difficulty
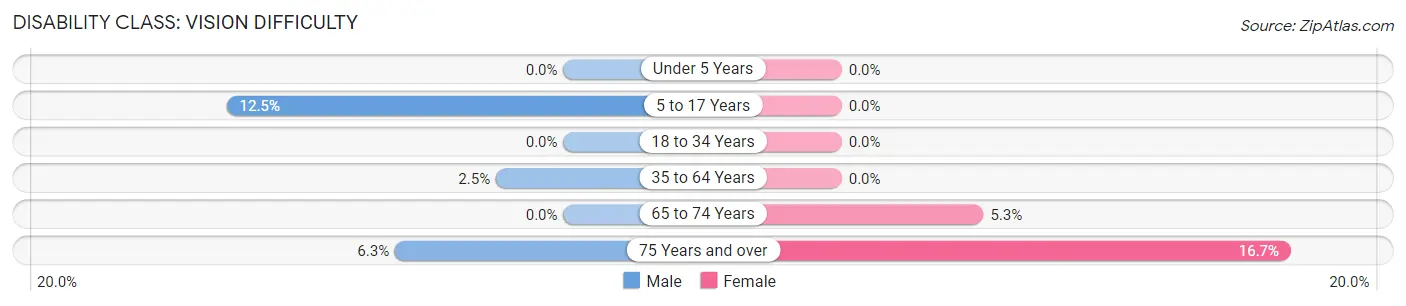
| Age Bracket | Male | Female |
| Under 5 Years | 0 (0.0%) | 0 (0.0%) |
| 5 to 17 Years | 1 (12.5%) | 0 (0.0%) |
| 18 to 34 Years | 0 (0.0%) | 0 (0.0%) |
| 35 to 64 Years | 1 (2.5%) | 0 (0.0%) |
| 65 to 74 Years | 0 (0.0%) | 1 (5.3%) |
| 75 Years and over | 1 (6.2%) | 3 (16.7%) |
Disability Class: Cognitive Difficulty
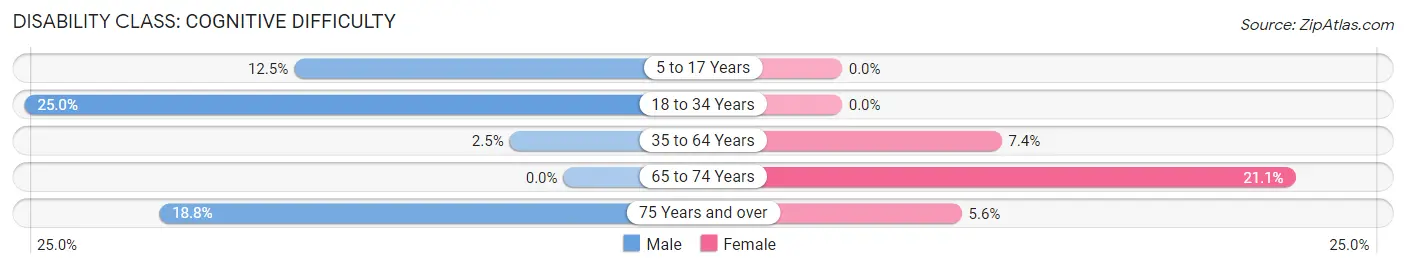
| Age Bracket | Male | Female |
| 5 to 17 Years | 1 (12.5%) | 0 (0.0%) |
| 18 to 34 Years | 6 (25.0%) | 0 (0.0%) |
| 35 to 64 Years | 1 (2.5%) | 4 (7.4%) |
| 65 to 74 Years | 0 (0.0%) | 4 (21.0%) |
| 75 Years and over | 3 (18.8%) | 1 (5.6%) |
Disability Class: Ambulatory Difficulty
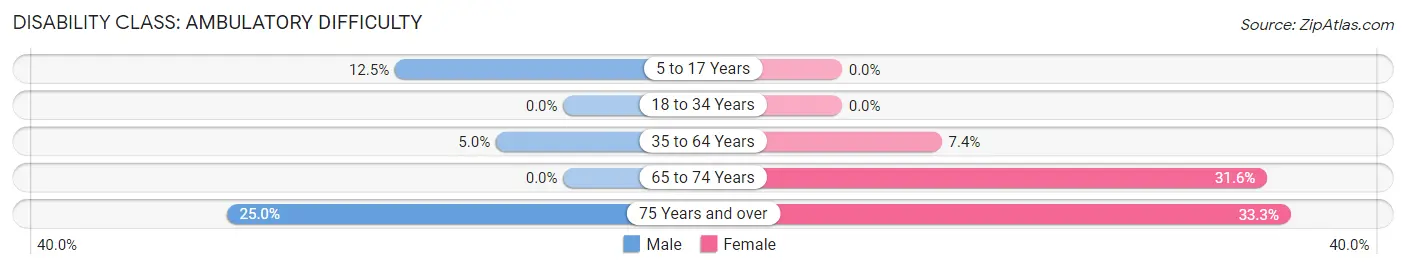
| Age Bracket | Male | Female |
| 5 to 17 Years | 1 (12.5%) | 0 (0.0%) |
| 18 to 34 Years | 0 (0.0%) | 0 (0.0%) |
| 35 to 64 Years | 2 (5.0%) | 4 (7.4%) |
| 65 to 74 Years | 0 (0.0%) | 6 (31.6%) |
| 75 Years and over | 4 (25.0%) | 6 (33.3%) |
Disability Class: Self-Care Difficulty
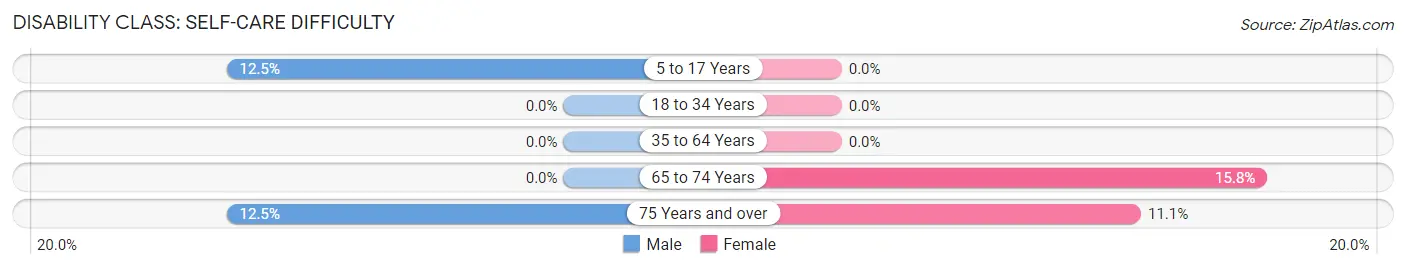
| Age Bracket | Male | Female |
| 5 to 17 Years | 1 (12.5%) | 0 (0.0%) |
| 18 to 34 Years | 0 (0.0%) | 0 (0.0%) |
| 35 to 64 Years | 0 (0.0%) | 0 (0.0%) |
| 65 to 74 Years | 0 (0.0%) | 3 (15.8%) |
| 75 Years and over | 2 (12.5%) | 2 (11.1%) |
Technology Access in Ransom
Computing Device Access in Ransom
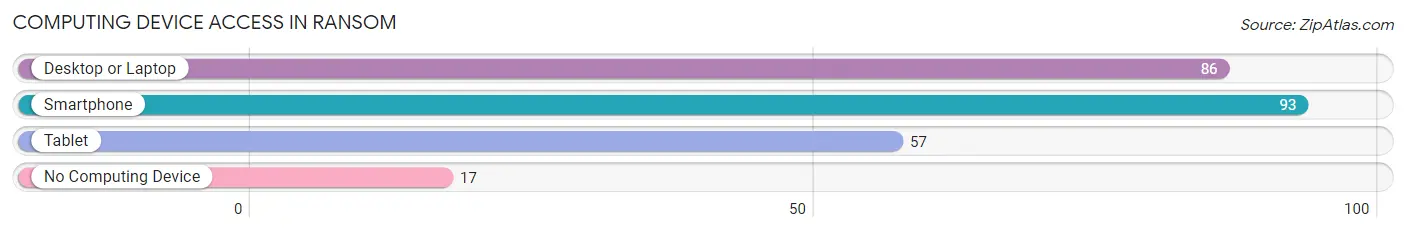
| Device Type | # Households | % Households |
| Desktop or Laptop | 86 | 74.1% |
| Smartphone | 93 | 80.2% |
| Tablet | 57 | 49.1% |
| No Computing Device | 17 | 14.7% |
| Total | 116 | 100.0% |
Internet Access in Ransom
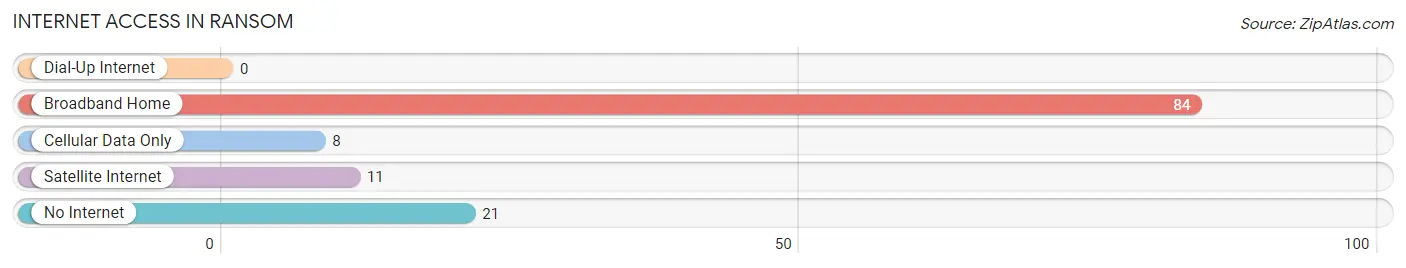
| Internet Type | # Households | % Households |
| Dial-Up Internet | 0 | 0.0% |
| Broadband Home | 84 | 72.4% |
| Cellular Data Only | 8 | 6.9% |
| Satellite Internet | 11 | 9.5% |
| No Internet | 21 | 18.1% |
| Total | 116 | 100.0% |
Ransom Summary
Ransom, Kansas is a small town located in Ness County, in the northwest corner of the state. It is situated on the banks of the Arkansas River, and is home to a population of just over 500 people. The town was founded in 1887, and has a rich history of farming, ranching, and small business.
Geography
Ransom is located in the High Plains region of Kansas, and is surrounded by rolling hills and flat plains. The town is situated on the banks of the Arkansas River, and is bordered by the towns of Ness City and Utica. The town is located at an elevation of 2,845 feet, and has a total area of 0.6 square miles.
Climate
Ransom has a semi-arid climate, with hot summers and cold winters. The average temperature in the summer is around 85 degrees Fahrenheit, and the average temperature in the winter is around 25 degrees Fahrenheit. The town receives an average of 16 inches of precipitation per year, with most of it falling in the spring and summer months.
Economy
Ransom’s economy is largely based on agriculture and ranching. The town is home to several farms and ranches, which produce a variety of crops and livestock. The town also has a few small businesses, including a grocery store, a hardware store, and a few restaurants.
Demographics
As of the 2010 census, the population of Ransom was 514 people. The racial makeup of the town was 97.3% White, 0.6% African American, 0.2% Native American, 0.2% Asian, 0.2% from other races, and 1.5% from two or more races. The median household income was $37,500, and the median family income was $45,000.
Conclusion
Ransom, Kansas is a small town located in Ness County, in the northwest corner of the state. It is situated on the banks of the Arkansas River, and is home to a population of just over 500 people. The town was founded in 1887, and has a rich history of farming, ranching, and small business. The town has a semi-arid climate, with hot summers and cold winters. The economy of Ransom is largely based on agriculture and ranching, and the town is home to several farms and ranches. The population of Ransom is 97.3% White, 0.6% African American, 0.2% Native American, 0.2% Asian, 0.2% from other races, and 1.5% from two or more races. The median household income was $37,500, and the median family income was $45,000.
Common Questions
What is Per Capita Income in Ransom?
Per Capita income in Ransom is $35,378.
What is the Median Family Income in Ransom?
Median Family Income in Ransom is $66,000.
What is the Median Household income in Ransom?
Median Household Income in Ransom is $52,917.
What is Inequality or Gini Index in Ransom?
Inequality or Gini Index in Ransom is 0.50.
What is the Total Population of Ransom?
Total Population of Ransom is 265.
What is the Total Male Population of Ransom?
Total Male Population of Ransom is 114.
What is the Total Female Population of Ransom?
Total Female Population of Ransom is 151.
What is the Ratio of Males per 100 Females in Ransom?
There are 75.50 Males per 100 Females in Ransom.
What is the Ratio of Females per 100 Males in Ransom?
There are 132.46 Females per 100 Males in Ransom.
What is the Median Population Age in Ransom?
Median Population Age in Ransom is 59.7 Years.
What is the Average Family Size in Ransom
Average Family Size in Ransom is 2.8 People.
What is the Average Household Size in Ransom
Average Household Size in Ransom is 2.1 People.
How Large is the Labor Force in Ransom?
There are 130 People in the Labor Forcein in Ransom.
What is the Percentage of People in the Labor Force in Ransom?
55.6% of People are in the Labor Force in Ransom.