McCracken, KS Map & Demographics
McCracken Map
McCracken Overview
$26,304
PER CAPITA INCOME
$43,250
AVG FAMILY INCOME
$41,667
AVG HOUSEHOLD INCOME
42.7%
WAGE / INCOME GAP [ % ]
57.3¢/ $1
WAGE / INCOME GAP [ $ ]
0.35
INEQUALITY / GINI INDEX
101
TOTAL POPULATION
53
MALE POPULATION
48
FEMALE POPULATION
110.42
MALES / 100 FEMALES
90.57
FEMALES / 100 MALES
50.9
MEDIAN AGE
2.6
AVG FAMILY SIZE
1.9
AVG HOUSEHOLD SIZE
46
LABOR FORCE [ PEOPLE ]
47.4%
PERCENT IN LABOR FORCE
Income in McCracken
Income Overview in McCracken
Per Capita Income in McCracken is $26,304, while median incomes of families and households are $43,250 and $41,667 respectively.
| Characteristic | Number | Measure |
| Per Capita Income | 101 | $26,304 |
| Median Family Income | 25 | $43,250 |
| Mean Family Income | 25 | $60,724 |
| Median Household Income | 54 | $41,667 |
| Mean Household Income | 54 | $45,124 |
| Income Deficit | 25 | $0 |
| Wage / Income Gap (%) | 101 | 42.74% |
| Wage / Income Gap ($) | 101 | 57.26¢ per $1 |
| Gini / Inequality Index | 101 | 0.35 |
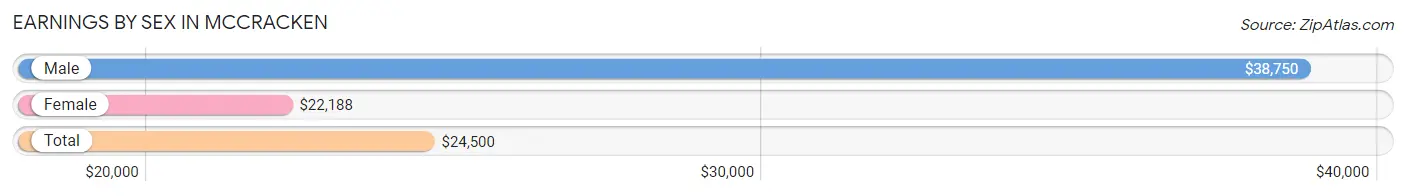
Earnings by Sex in McCracken
Average Earnings in McCracken are $24,500, $38,750 for men and $22,188 for women, a difference of 42.7%.
| Sex | Number | Average Earnings |
| Male | 31 (57.4%) | $38,750 |
| Female | 23 (42.6%) | $22,188 |
| Total | 54 (100.0%) | $24,500 |
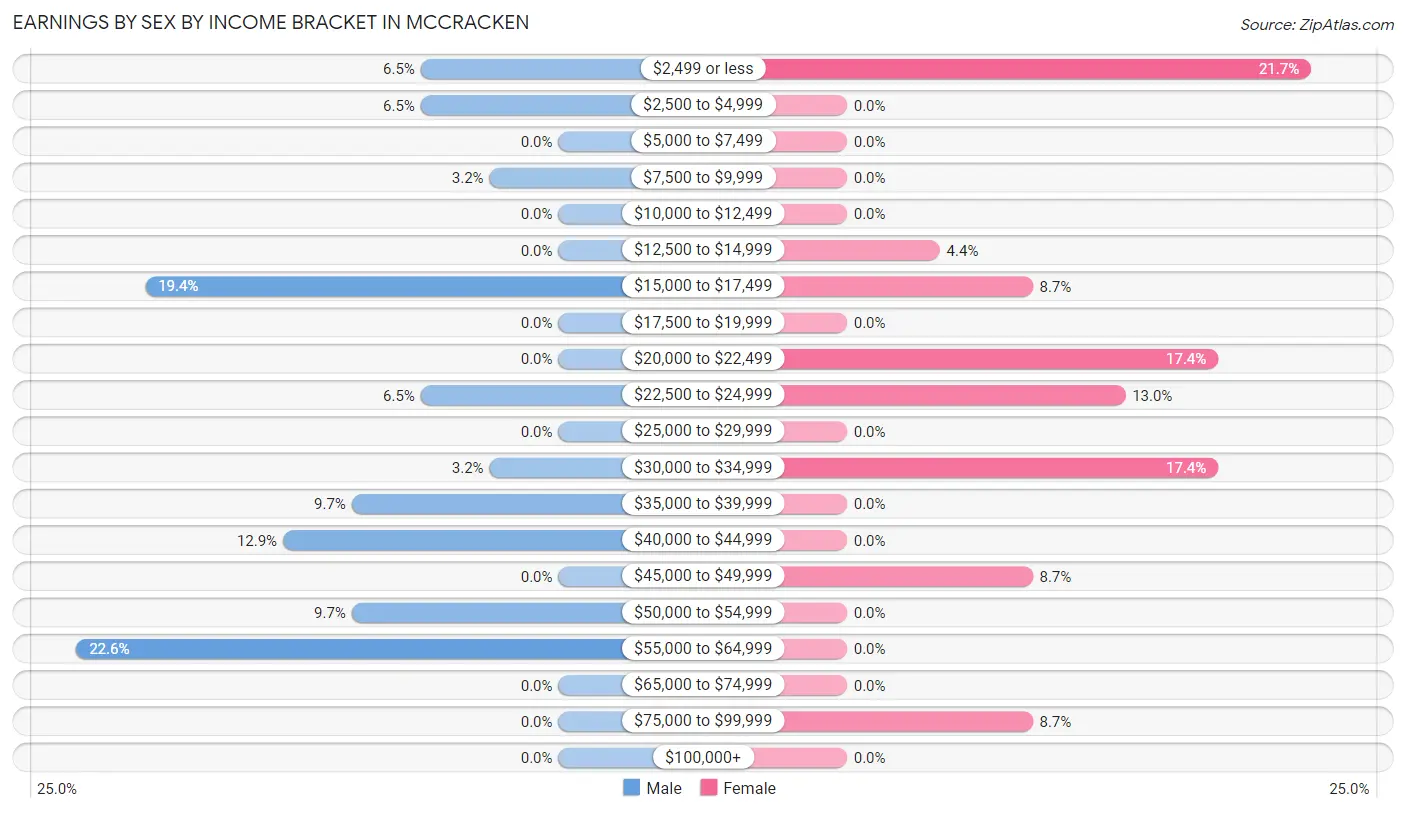
Earnings by Sex by Income Bracket in McCracken
The most common earnings brackets in McCracken are $55,000 to $64,999 for men (7 | 22.6%) and $2,499 or less for women (5 | 21.7%).
| Income | Male | Female |
| $2,499 or less | 2 (6.5%) | 5 (21.7%) |
| $2,500 to $4,999 | 2 (6.5%) | 0 (0.0%) |
| $5,000 to $7,499 | 0 (0.0%) | 0 (0.0%) |
| $7,500 to $9,999 | 1 (3.2%) | 0 (0.0%) |
| $10,000 to $12,499 | 0 (0.0%) | 0 (0.0%) |
| $12,500 to $14,999 | 0 (0.0%) | 1 (4.3%) |
| $15,000 to $17,499 | 6 (19.4%) | 2 (8.7%) |
| $17,500 to $19,999 | 0 (0.0%) | 0 (0.0%) |
| $20,000 to $22,499 | 0 (0.0%) | 4 (17.4%) |
| $22,500 to $24,999 | 2 (6.5%) | 3 (13.0%) |
| $25,000 to $29,999 | 0 (0.0%) | 0 (0.0%) |
| $30,000 to $34,999 | 1 (3.2%) | 4 (17.4%) |
| $35,000 to $39,999 | 3 (9.7%) | 0 (0.0%) |
| $40,000 to $44,999 | 4 (12.9%) | 0 (0.0%) |
| $45,000 to $49,999 | 0 (0.0%) | 2 (8.7%) |
| $50,000 to $54,999 | 3 (9.7%) | 0 (0.0%) |
| $55,000 to $64,999 | 7 (22.6%) | 0 (0.0%) |
| $65,000 to $74,999 | 0 (0.0%) | 0 (0.0%) |
| $75,000 to $99,999 | 0 (0.0%) | 2 (8.7%) |
| $100,000+ | 0 (0.0%) | 0 (0.0%) |
| Total | 31 (100.0%) | 23 (100.0%) |
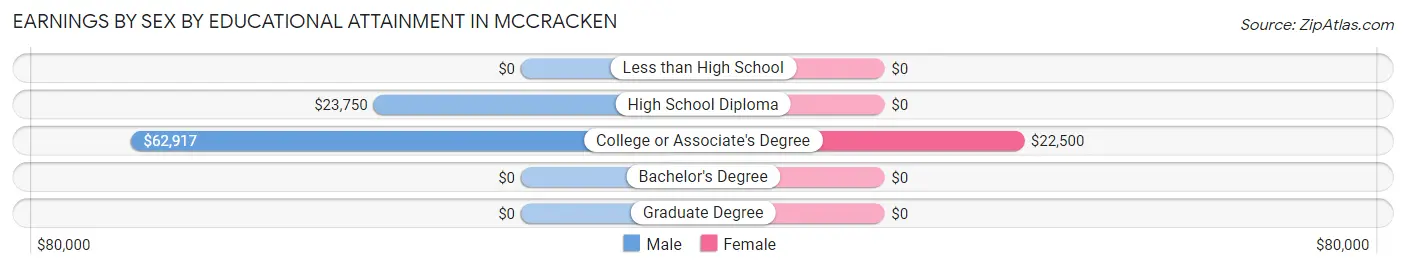
Earnings by Sex by Educational Attainment in McCracken
Average earnings in McCracken are $40,938 for men and $22,188 for women, a difference of 45.8%. Men with an educational attainment of college or associate's degree enjoy the highest average annual earnings of $62,917, while those with high school diploma education earn the least with $23,750. Women with an educational attainment of college or associate's degree earn the most with the average annual earnings of $22,500, while those with college or associate's degree education have the smallest earnings of $22,500.
| Educational Attainment | Male Income | Female Income |
| Less than High School | - | - |
| High School Diploma | $23,750 | $0 |
| College or Associate's Degree | $62,917 | $22,500 |
| Bachelor's Degree | - | - |
| Graduate Degree | - | - |
| Total | $40,938 | $22,188 |
Family Income in McCracken
Family Income Brackets in McCracken
According to the McCracken family income data, there are 17 families falling into the $35,000 to $49,999 income range, which is the most common income bracket and makes up 68.0% of all families.
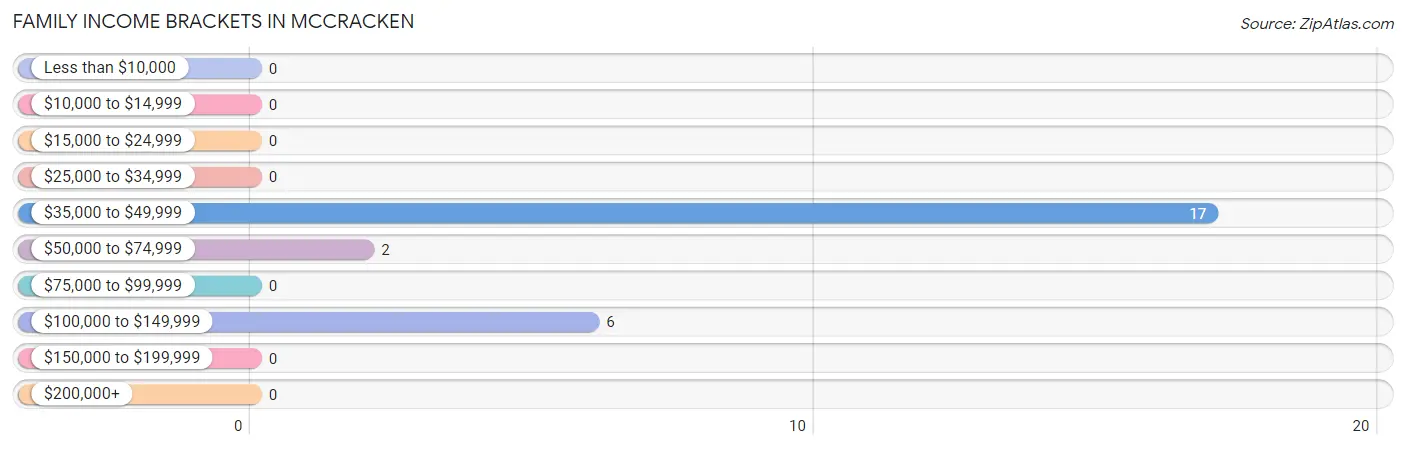
| Income Bracket | # Families | % Families |
| Less than $10,000 | 0 | 0.0% |
| $10,000 to $14,999 | 0 | 0.0% |
| $15,000 to $24,999 | 0 | 0.0% |
| $25,000 to $34,999 | 0 | 0.0% |
| $35,000 to $49,999 | 17 | 68.0% |
| $50,000 to $74,999 | 2 | 8.0% |
| $75,000 to $99,999 | 0 | 0.0% |
| $100,000 to $149,999 | 6 | 24.0% |
| $150,000 to $199,999 | 0 | 0.0% |
| $200,000+ | 0 | 0.0% |
Family Income by Famaliy Size in McCracken
3-person families (11 | 44.0%) account for the highest median family income in McCracken with $36,964 per family, while 3-person families (11 | 44.0%) have the highest median income of $12,321 per family member.
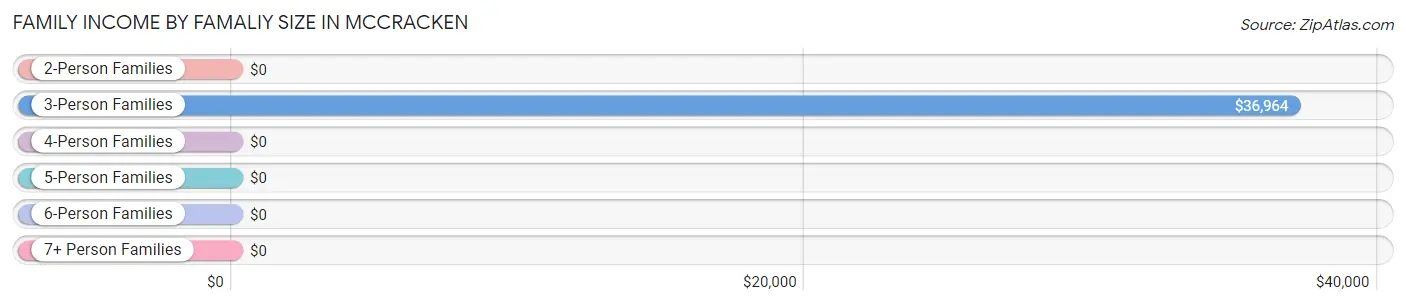
| Income Bracket | # Families | Median Income |
| 2-Person Families | 14 (56.0%) | $0 |
| 3-Person Families | 11 (44.0%) | $36,964 |
| 4-Person Families | 0 (0.0%) | $0 |
| 5-Person Families | 0 (0.0%) | $0 |
| 6-Person Families | 0 (0.0%) | $0 |
| 7+ Person Families | 0 (0.0%) | $0 |
| Total | 25 (100.0%) | $43,250 |
Family Income by Number of Earners in McCracken
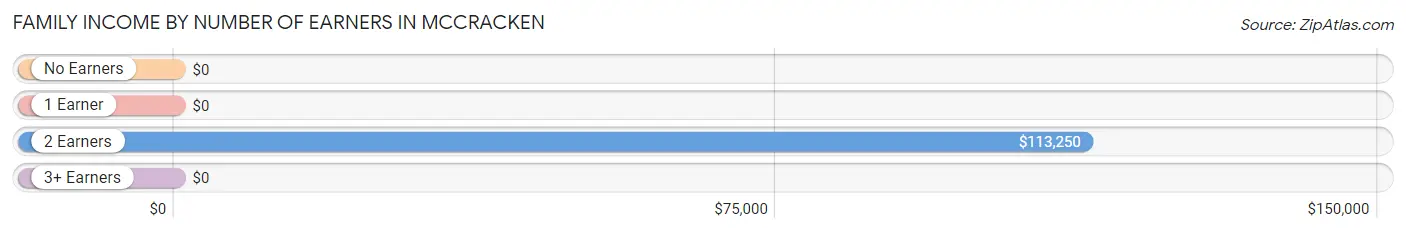
| Number of Earners | # Families | Median Income |
| No Earners | 12 (48.0%) | $0 |
| 1 Earner | 4 (16.0%) | $0 |
| 2 Earners | 9 (36.0%) | $113,250 |
| 3+ Earners | 0 (0.0%) | $0 |
| Total | 25 (100.0%) | $43,250 |
Household Income in McCracken
Household Income Brackets in McCracken
With 24 households falling in the category, the $35,000 to $49,999 income range is the most frequent in McCracken, accounting for 44.4% of all households.
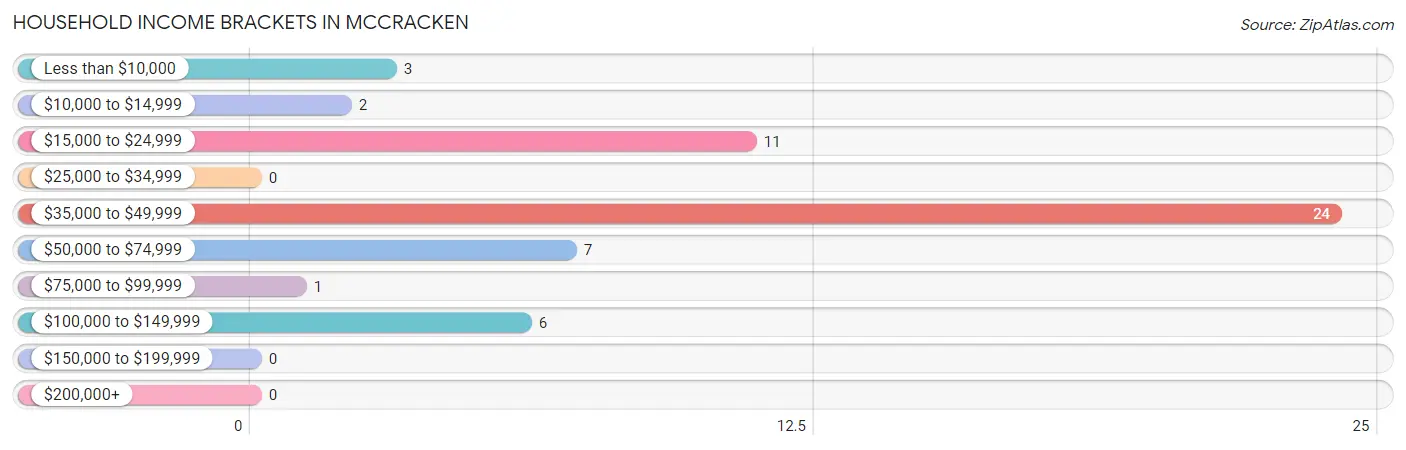
| Income Bracket | # Households | % Households |
| Less than $10,000 | 3 | 5.6% |
| $10,000 to $14,999 | 2 | 3.7% |
| $15,000 to $24,999 | 11 | 20.4% |
| $25,000 to $34,999 | 0 | 0.0% |
| $35,000 to $49,999 | 24 | 44.4% |
| $50,000 to $74,999 | 7 | 13.0% |
| $75,000 to $99,999 | 1 | 1.9% |
| $100,000 to $149,999 | 6 | 11.1% |
| $150,000 to $199,999 | 0 | 0.0% |
| $200,000+ | 0 | 0.0% |
Household Income by Householder Age in McCracken
The median household income in McCracken is $41,667, with the highest median household income of $42,500 found in the 45 to 64 years age bracket for the primary householder. A total of 26 households (48.1%) fall into this category.
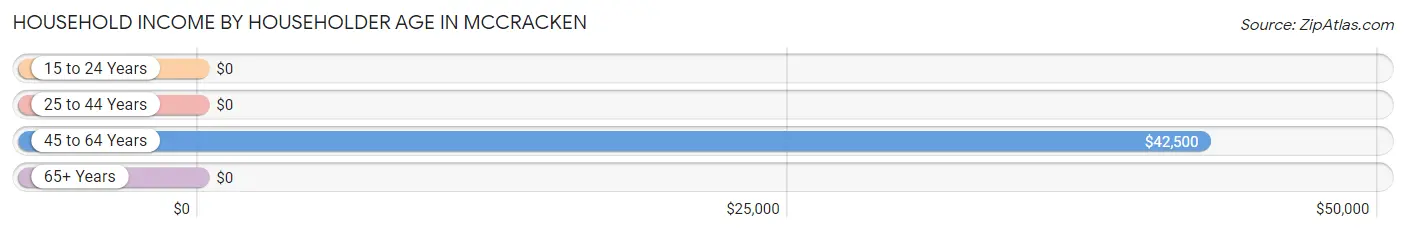
| Income Bracket | # Households | Median Income |
| 15 to 24 Years | 0 (0.0%) | $0 |
| 25 to 44 Years | 5 (9.3%) | $0 |
| 45 to 64 Years | 26 (48.1%) | $42,500 |
| 65+ Years | 23 (42.6%) | $0 |
| Total | 54 (100.0%) | $41,667 |
Poverty in McCracken
Income Below Poverty by Sex and Age in McCracken
With 3.8% poverty level for males and 4.2% for females among the residents of McCracken, 45 to 54 year old males and 65 to 74 year old females are the most vulnerable to poverty, with 2 males (20.0%) and 1 females (10.0%) in their respective age groups living below the poverty level.
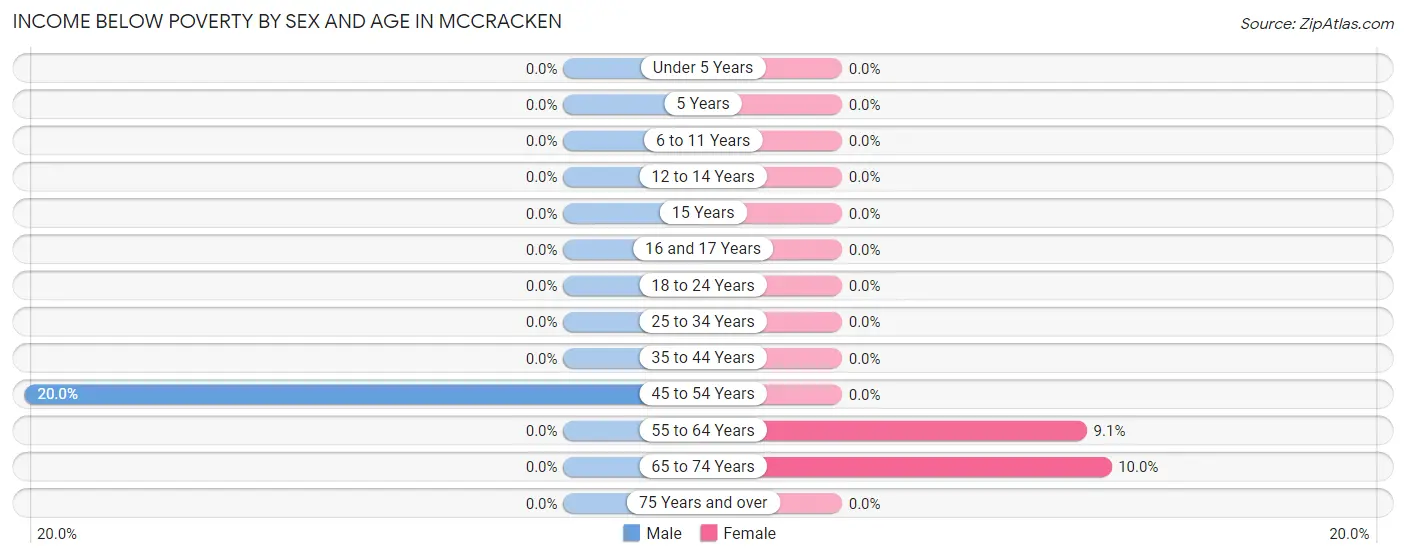
| Age Bracket | Male | Female |
| Under 5 Years | 0 (0.0%) | 0 (0.0%) |
| 5 Years | 0 (0.0%) | 0 (0.0%) |
| 6 to 11 Years | 0 (0.0%) | 0 (0.0%) |
| 12 to 14 Years | 0 (0.0%) | 0 (0.0%) |
| 15 Years | 0 (0.0%) | 0 (0.0%) |
| 16 and 17 Years | 0 (0.0%) | 0 (0.0%) |
| 18 to 24 Years | 0 (0.0%) | 0 (0.0%) |
| 25 to 34 Years | 0 (0.0%) | 0 (0.0%) |
| 35 to 44 Years | 0 (0.0%) | 0 (0.0%) |
| 45 to 54 Years | 2 (20.0%) | 0 (0.0%) |
| 55 to 64 Years | 0 (0.0%) | 1 (9.1%) |
| 65 to 74 Years | 0 (0.0%) | 1 (10.0%) |
| 75 Years and over | 0 (0.0%) | 0 (0.0%) |
| Total | 2 (3.8%) | 2 (4.2%) |
Income Above Poverty by Sex and Age in McCracken
According to the poverty statistics in McCracken, males aged 6 to 11 years and females aged 18 to 24 years are the age groups that are most secure financially, with 100.0% of males and 100.0% of females in these age groups living above the poverty line.
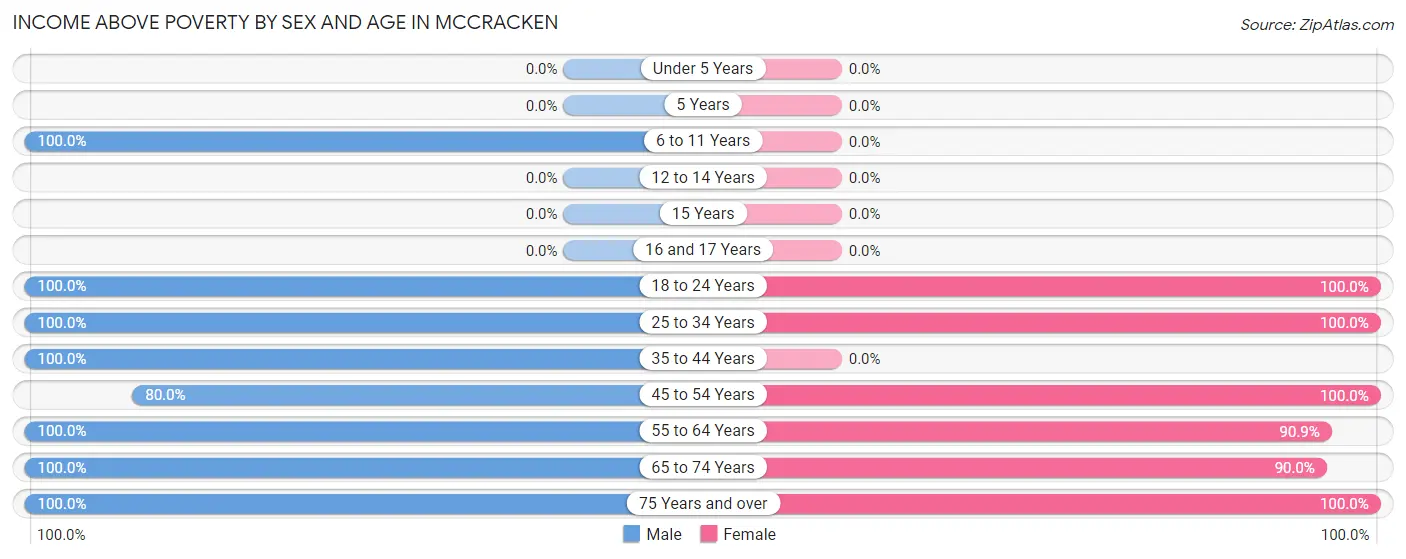
| Age Bracket | Male | Female |
| Under 5 Years | 0 (0.0%) | 0 (0.0%) |
| 5 Years | 0 (0.0%) | 0 (0.0%) |
| 6 to 11 Years | 4 (100.0%) | 0 (0.0%) |
| 12 to 14 Years | 0 (0.0%) | 0 (0.0%) |
| 15 Years | 0 (0.0%) | 0 (0.0%) |
| 16 and 17 Years | 0 (0.0%) | 0 (0.0%) |
| 18 to 24 Years | 6 (100.0%) | 2 (100.0%) |
| 25 to 34 Years | 5 (100.0%) | 8 (100.0%) |
| 35 to 44 Years | 4 (100.0%) | 0 (0.0%) |
| 45 to 54 Years | 8 (80.0%) | 16 (100.0%) |
| 55 to 64 Years | 7 (100.0%) | 10 (90.9%) |
| 65 to 74 Years | 16 (100.0%) | 9 (90.0%) |
| 75 Years and over | 1 (100.0%) | 1 (100.0%) |
| Total | 51 (96.2%) | 46 (95.8%) |
Income Below Poverty Among Married-Couple Families in McCracken
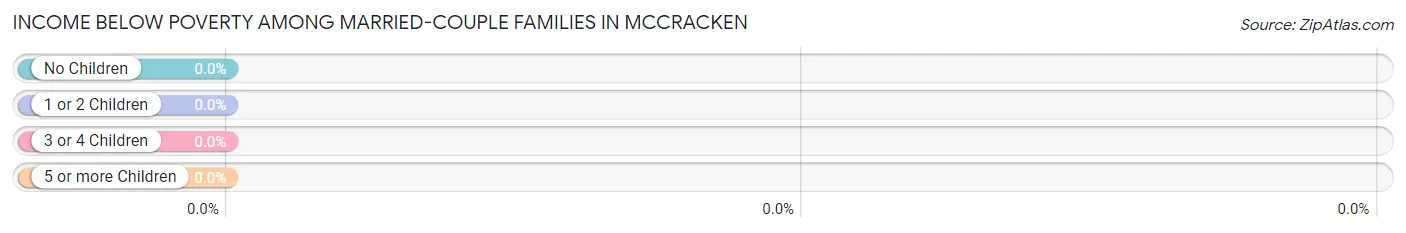
| Children | Above Poverty | Below Poverty |
| No Children | 22 (100.0%) | 0 (0.0%) |
| 1 or 2 Children | 3 (100.0%) | 0 (0.0%) |
| 3 or 4 Children | 0 (0.0%) | 0 (0.0%) |
| 5 or more Children | 0 (0.0%) | 0 (0.0%) |
| Total | 25 (100.0%) | 0 (0.0%) |
Income Below Poverty Among Single-Parent Households in McCracken
| Children | Single Father | Single Mother |
| No Children | 0 (0.0%) | 0 (0.0%) |
| 1 or 2 Children | 0 (0.0%) | 0 (0.0%) |
| 3 or 4 Children | 0 (0.0%) | 0 (0.0%) |
| 5 or more Children | 0 (0.0%) | 0 (0.0%) |
| Total | 0 (0.0%) | 0 (0.0%) |
Income Below Poverty Among Married-Couple vs Single-Parent Households in McCracken
| Children | Married-Couple Families | Single-Parent Households |
| No Children | 0 (0.0%) | 0 (0.0%) |
| 1 or 2 Children | 0 (0.0%) | 0 (0.0%) |
| 3 or 4 Children | 0 (0.0%) | 0 (0.0%) |
| 5 or more Children | 0 (0.0%) | 0 (0.0%) |
| Total | 0 (0.0%) | 0 (0.0%) |
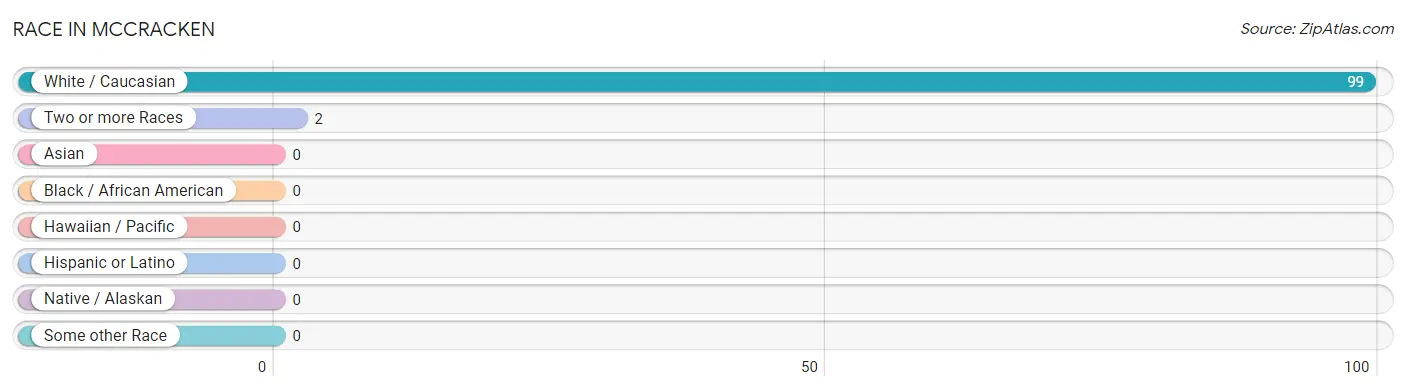
Race in McCracken
The most populous races in McCracken are White / Caucasian (99 | 98.0%), and Two or more Races (2 | 2.0%).
| Race | # Population | % Population |
| Asian | 0 | 0.0% |
| Black / African American | 0 | 0.0% |
| Hawaiian / Pacific | 0 | 0.0% |
| Hispanic or Latino | 0 | 0.0% |
| Native / Alaskan | 0 | 0.0% |
| White / Caucasian | 99 | 98.0% |
| Two or more Races | 2 | 2.0% |
| Some other Race | 0 | 0.0% |
| Total | 101 | 100.0% |
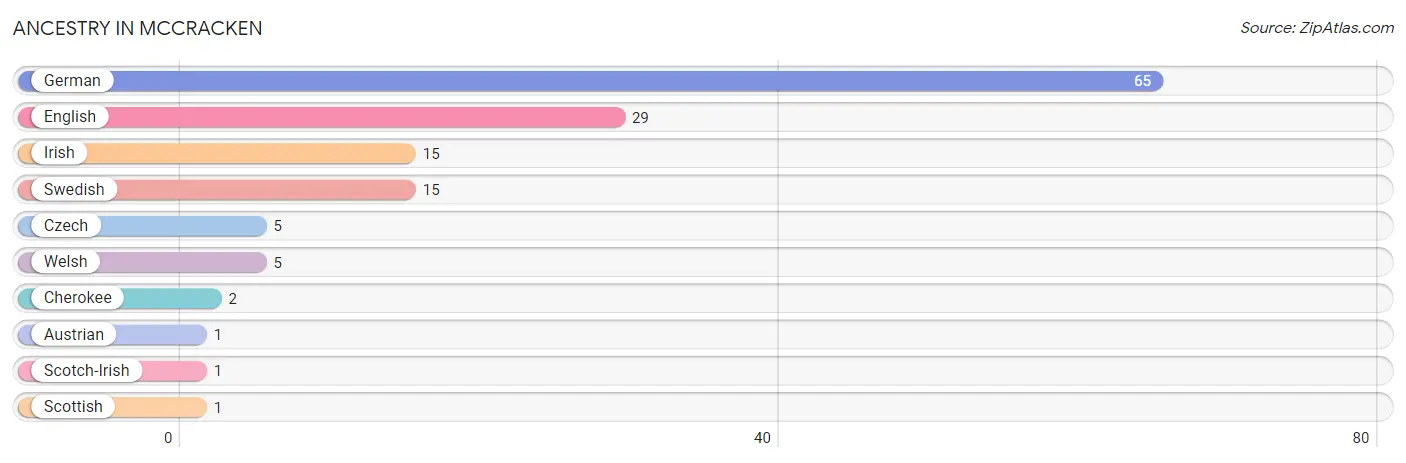
Ancestry in McCracken
The most populous ancestries reported in McCracken are German (65 | 64.4%), English (29 | 28.7%), Irish (15 | 14.8%), Swedish (15 | 14.8%), and Czech (5 | 5.0%), together accounting for 127.7% of all McCracken residents.
| Ancestry | # Population | % Population |
| Austrian | 1 | 1.0% |
| Cherokee | 2 | 2.0% |
| Czech | 5 | 5.0% |
| English | 29 | 28.7% |
| German | 65 | 64.4% |
| Irish | 15 | 14.8% |
| Scotch-Irish | 1 | 1.0% |
| Scottish | 1 | 1.0% |
| Swedish | 15 | 14.8% |
| Welsh | 5 | 5.0% | View All 10 Rows |
Immigrants in McCracken

| Immigration Origin | # Population | % Population | View All 0 Rows |
Sex and Age in McCracken
Sex and Age in McCracken
The most populous age groups in McCracken are 65 to 69 Years (11 | 20.7%) for men and 45 to 49 Years (14 | 29.2%) for women.
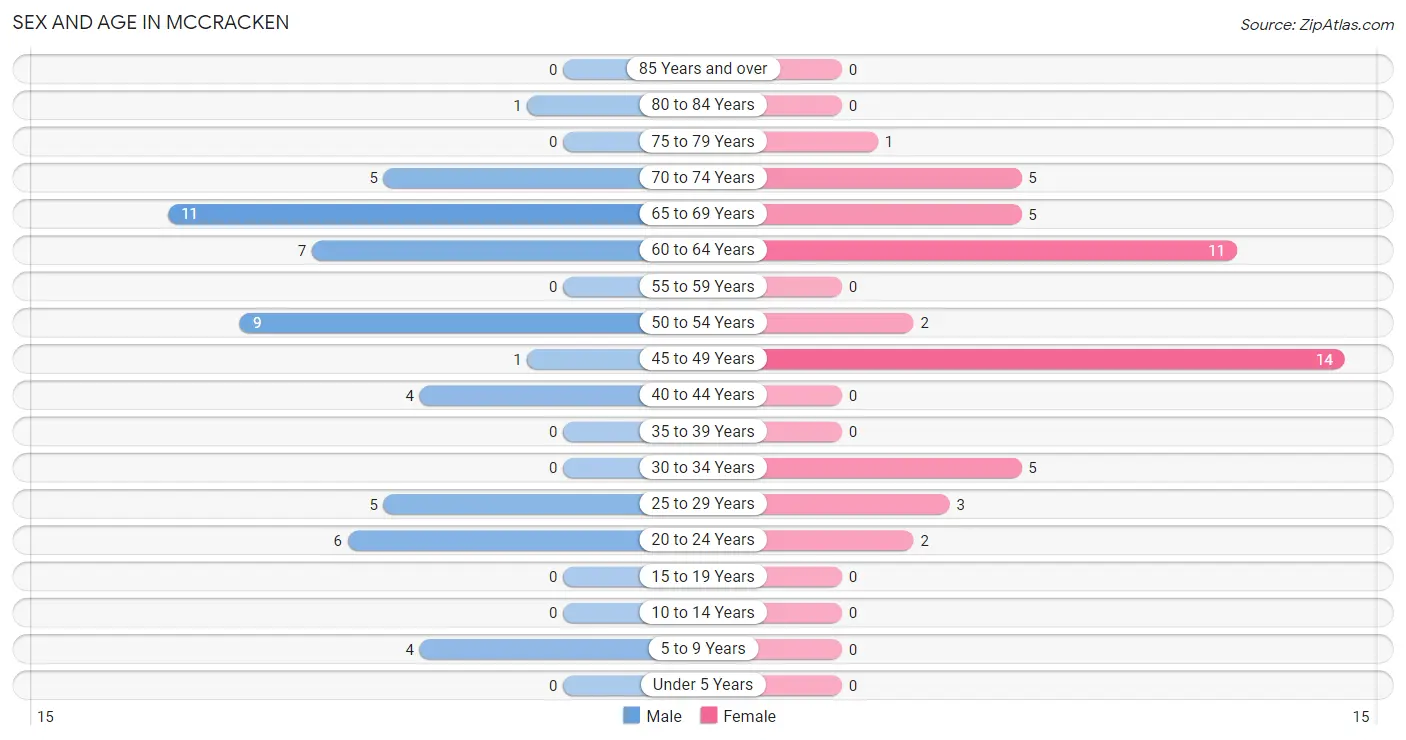
| Age Bracket | Male | Female |
| Under 5 Years | 0 (0.0%) | 0 (0.0%) |
| 5 to 9 Years | 4 (7.5%) | 0 (0.0%) |
| 10 to 14 Years | 0 (0.0%) | 0 (0.0%) |
| 15 to 19 Years | 0 (0.0%) | 0 (0.0%) |
| 20 to 24 Years | 6 (11.3%) | 2 (4.2%) |
| 25 to 29 Years | 5 (9.4%) | 3 (6.2%) |
| 30 to 34 Years | 0 (0.0%) | 5 (10.4%) |
| 35 to 39 Years | 0 (0.0%) | 0 (0.0%) |
| 40 to 44 Years | 4 (7.5%) | 0 (0.0%) |
| 45 to 49 Years | 1 (1.9%) | 14 (29.2%) |
| 50 to 54 Years | 9 (17.0%) | 2 (4.2%) |
| 55 to 59 Years | 0 (0.0%) | 0 (0.0%) |
| 60 to 64 Years | 7 (13.2%) | 11 (22.9%) |
| 65 to 69 Years | 11 (20.7%) | 5 (10.4%) |
| 70 to 74 Years | 5 (9.4%) | 5 (10.4%) |
| 75 to 79 Years | 0 (0.0%) | 1 (2.1%) |
| 80 to 84 Years | 1 (1.9%) | 0 (0.0%) |
| 85 Years and over | 0 (0.0%) | 0 (0.0%) |
| Total | 53 (100.0%) | 48 (100.0%) |
Families and Households in McCracken
Median Family Size in McCracken
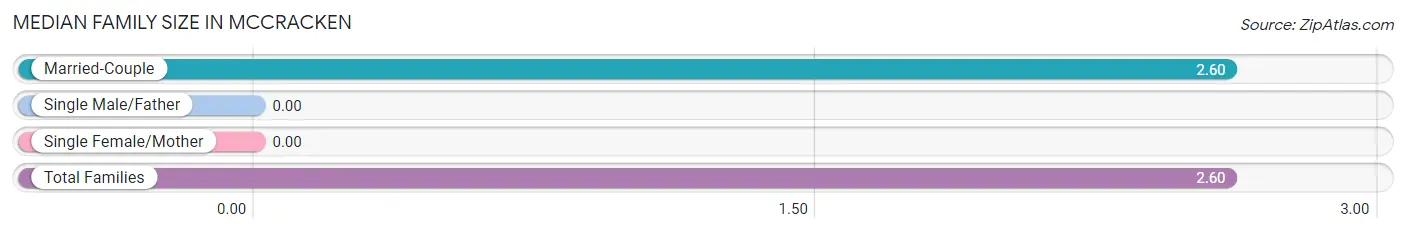
| Family Type | # Families | Family Size |
| Married-Couple | 25 (100.0%) | 2.60 |
| Single Male/Father | 0 (0.0%) | - |
| Single Female/Mother | 0 (0.0%) | - |
| Total Families | 25 (100.0%) | 2.60 |
Median Household Size in McCracken
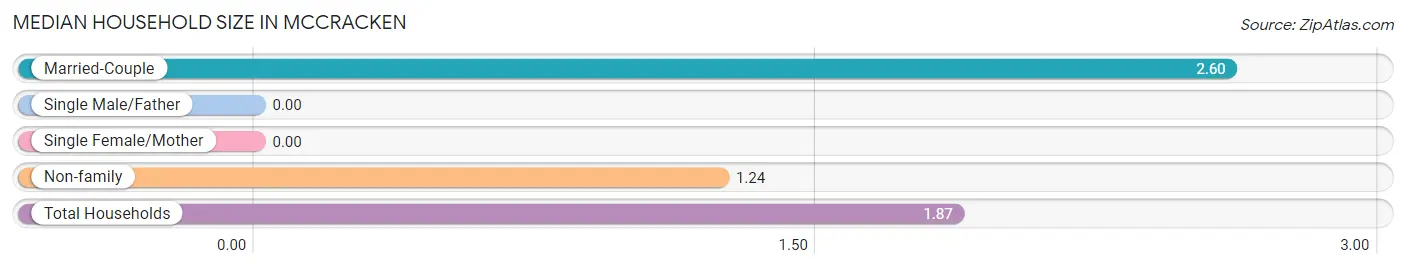
| Household Type | # Households | Household Size |
| Married-Couple | 25 (46.3%) | 2.60 |
| Single Male/Father | 0 (0.0%) | - |
| Single Female/Mother | 0 (0.0%) | - |
| Non-family | 29 (53.7%) | 1.24 |
| Total Households | 54 (100.0%) | 1.87 |
Household Size by Marriage Status in McCracken
Out of a total of 54 households in McCracken, 25 (46.3%) are family households, while 29 (53.7%) are nonfamily households. The most numerous type of family households are 2-person households, comprising 14, and the most common type of nonfamily households are 1-person households, comprising 26.
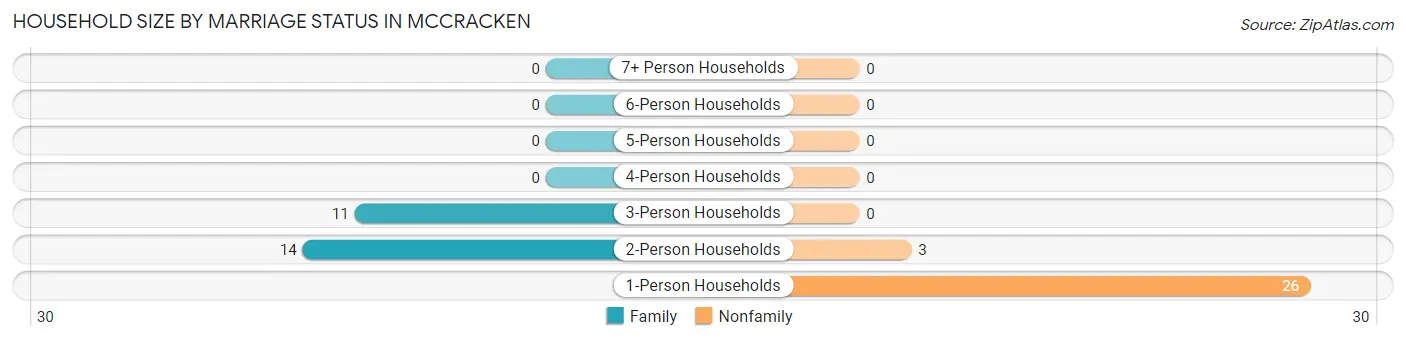
| Household Size | Family Households | Nonfamily Households |
| 1-Person Households | - | 26 (48.1%) |
| 2-Person Households | 14 (25.9%) | 3 (5.6%) |
| 3-Person Households | 11 (20.4%) | 0 (0.0%) |
| 4-Person Households | 0 (0.0%) | 0 (0.0%) |
| 5-Person Households | 0 (0.0%) | 0 (0.0%) |
| 6-Person Households | 0 (0.0%) | 0 (0.0%) |
| 7+ Person Households | 0 (0.0%) | 0 (0.0%) |
| Total | 25 (46.3%) | 29 (53.7%) |
Female Fertility in McCracken
Fertility by Age in McCracken
| Age Bracket | Women with Births | Births / 1,000 Women |
| 15 to 19 years | 0 (0.0%) | 0.0 |
| 20 to 34 years | 0 (0.0%) | 0.0 |
| 35 to 50 years | 0 (0.0%) | 0.0 |
| Total | 0 (0.0%) | 0.0 |
Fertility by Age by Marriage Status in McCracken
| Age Bracket | Married | Unmarried |
| 15 to 19 years | 0 (0.0%) | 0 (0.0%) |
| 20 to 34 years | 0 (0.0%) | 0 (0.0%) |
| 35 to 50 years | 0 (0.0%) | 0 (0.0%) |
| Total | 0 (0.0%) | 0 (0.0%) |
Fertility by Education in McCracken
| Educational Attainment | Women with Births | Births / 1,000 Women |
| Less than High School | 0 (0.0%) | 0.0 |
| High School Diploma | 0 (0.0%) | 0.0 |
| College or Associate's Degree | 0 (0.0%) | 0.0 |
| Bachelor's Degree | 0 (0.0%) | 0.0 |
| Graduate Degree | 0 (0.0%) | 0.0 |
| Total | 0 (0.0%) | 0.0 |
Fertility by Education by Marriage Status in McCracken
| Educational Attainment | Married | Unmarried |
| Less than High School | 0 (0.0%) | 0 (0.0%) |
| High School Diploma | 0 (0.0%) | 0 (0.0%) |
| College or Associate's Degree | 0 (0.0%) | 0 (0.0%) |
| Bachelor's Degree | 0 (0.0%) | 0 (0.0%) |
| Graduate Degree | 0 (0.0%) | 0 (0.0%) |
| Total | 0 (0.0%) | 0 (0.0%) |
Employment Characteristics in McCracken
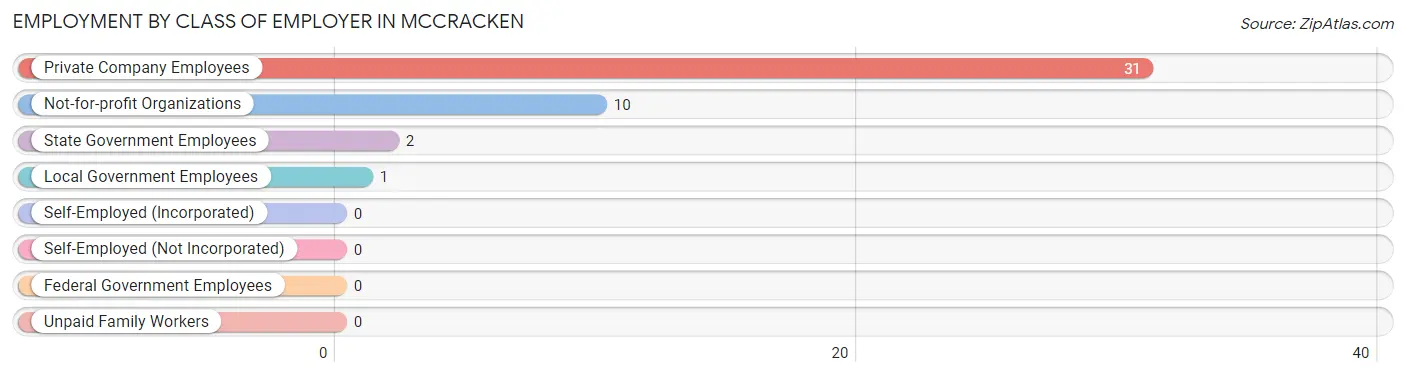
Employment by Class of Employer in McCracken
Among the 44 employed individuals in McCracken, private company employees (31 | 70.5%), not-for-profit organizations (10 | 22.7%), and state government employees (2 | 4.5%) make up the most common classes of employment.
| Employer Class | # Employees | % Employees |
| Private Company Employees | 31 | 70.5% |
| Self-Employed (Incorporated) | 0 | 0.0% |
| Self-Employed (Not Incorporated) | 0 | 0.0% |
| Not-for-profit Organizations | 10 | 22.7% |
| Local Government Employees | 1 | 2.3% |
| State Government Employees | 2 | 4.5% |
| Federal Government Employees | 0 | 0.0% |
| Unpaid Family Workers | 0 | 0.0% |
| Total | 44 | 100.0% |
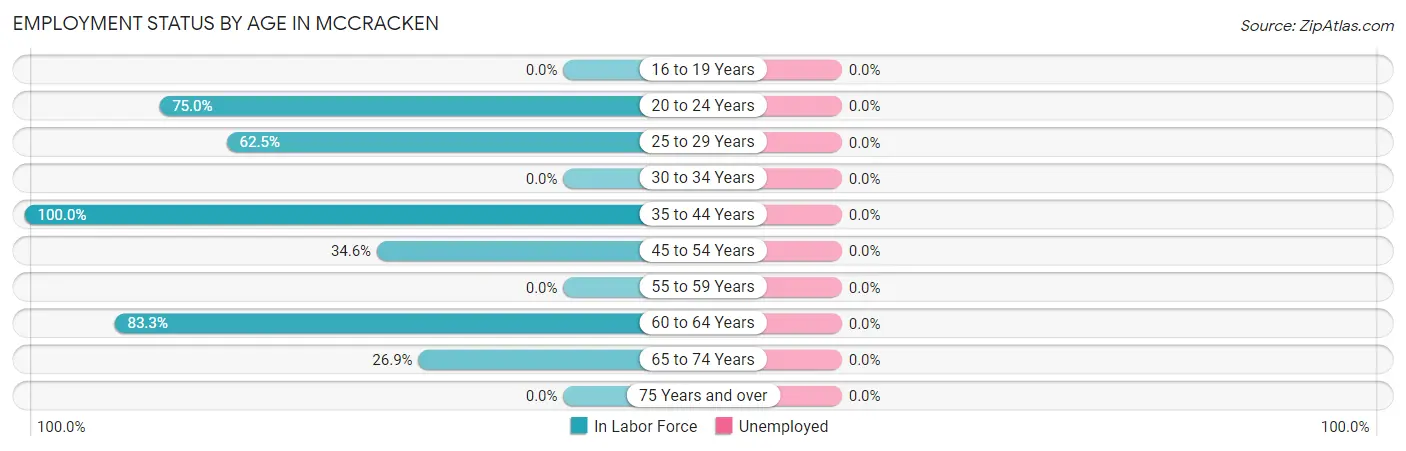
Employment Status by Age in McCracken
| Age Bracket | In Labor Force | Unemployed |
| 16 to 19 Years | 0 (0.0%) | 0 (0.0%) |
| 20 to 24 Years | 6 (75.0%) | 0 (0.0%) |
| 25 to 29 Years | 5 (62.5%) | 0 (0.0%) |
| 30 to 34 Years | 0 (0.0%) | 0 (0.0%) |
| 35 to 44 Years | 4 (100.0%) | 0 (0.0%) |
| 45 to 54 Years | 9 (34.6%) | 0 (0.0%) |
| 55 to 59 Years | 0 (0.0%) | 0 (0.0%) |
| 60 to 64 Years | 15 (83.3%) | 0 (0.0%) |
| 65 to 74 Years | 7 (26.9%) | 0 (0.0%) |
| 75 Years and over | 0 (0.0%) | 0 (0.0%) |
| Total | 46 (47.4%) | 0 (0.0%) |
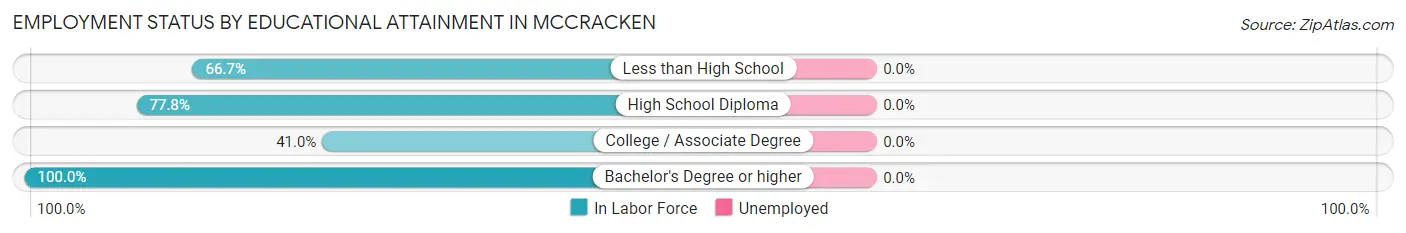
Employment Status by Educational Attainment in McCracken
| Educational Attainment | In Labor Force | Unemployed |
| Less than High School | 6 (66.7%) | 0 (0.0%) |
| High School Diploma | 7 (77.8%) | 0 (0.0%) |
| College / Associate Degree | 16 (41.0%) | 0 (0.0%) |
| Bachelor's Degree or higher | 4 (100.0%) | 0 (0.0%) |
| Total | 33 (54.1%) | 0 (0.0%) |
Employment Occupations by Sex in McCracken
Management, Business, Science and Arts Occupations
The most common Management, Business, Science and Arts occupations in McCracken are Management (4 | 8.7%), Community & Social Service (2 | 4.3%), Education Instruction & Library (2 | 4.3%), Health Diagnosing & Treating (2 | 4.3%), and Health Technologists (2 | 4.3%).
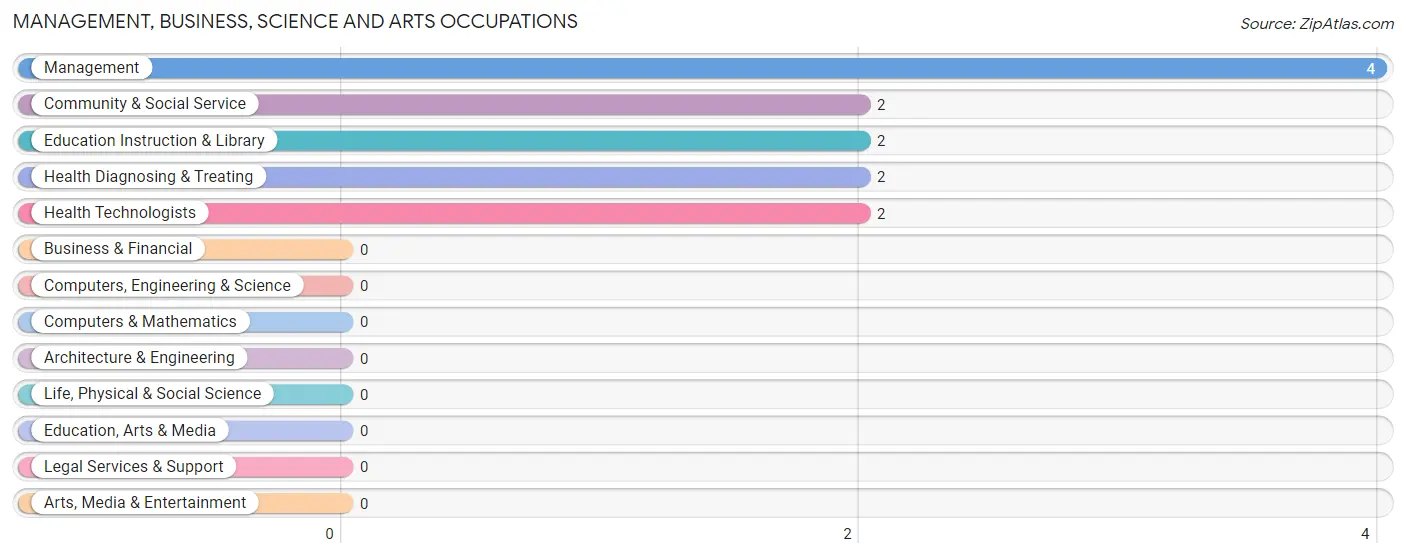
Management, Business, Science and Arts Occupations by Sex
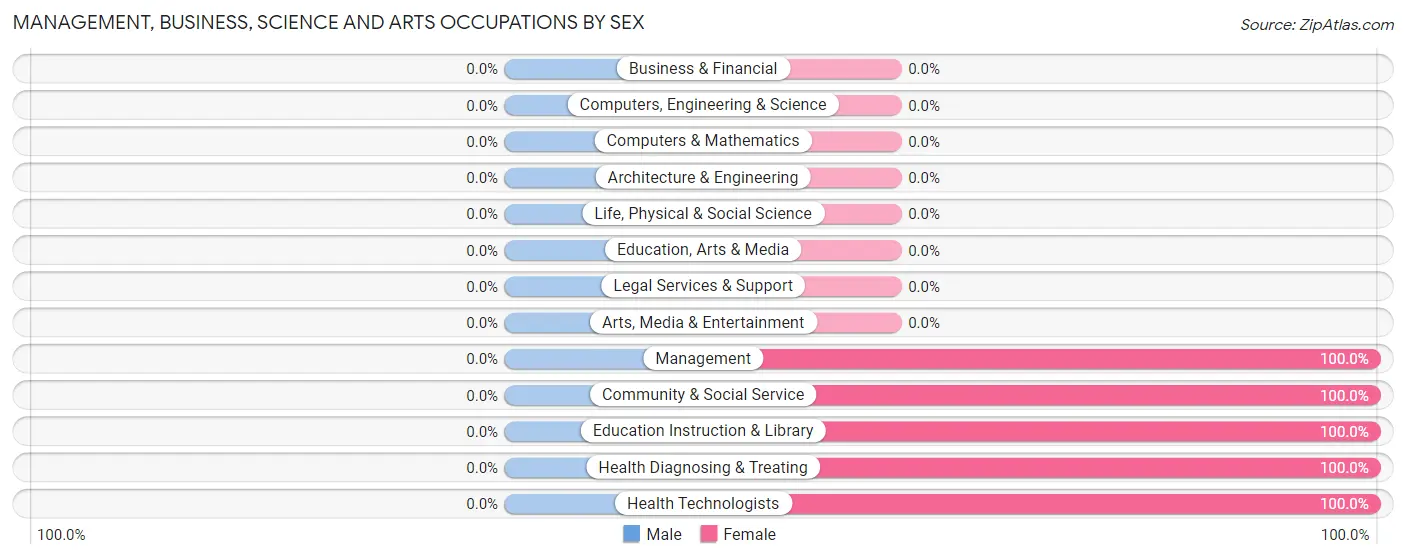
| Occupation | Male | Female |
| Management | 0 (0.0%) | 4 (100.0%) |
| Business & Financial | 0 (0.0%) | 0 (0.0%) |
| Computers, Engineering & Science | 0 (0.0%) | 0 (0.0%) |
| Computers & Mathematics | 0 (0.0%) | 0 (0.0%) |
| Architecture & Engineering | 0 (0.0%) | 0 (0.0%) |
| Life, Physical & Social Science | 0 (0.0%) | 0 (0.0%) |
| Community & Social Service | 0 (0.0%) | 2 (100.0%) |
| Education, Arts & Media | 0 (0.0%) | 0 (0.0%) |
| Legal Services & Support | 0 (0.0%) | 0 (0.0%) |
| Education Instruction & Library | 0 (0.0%) | 2 (100.0%) |
| Arts, Media & Entertainment | 0 (0.0%) | 0 (0.0%) |
| Health Diagnosing & Treating | 0 (0.0%) | 2 (100.0%) |
| Health Technologists | 0 (0.0%) | 2 (100.0%) |
| Total (Category) | 0 (0.0%) | 8 (100.0%) |
| Total (Overall) | 28 (60.9%) | 18 (39.1%) |
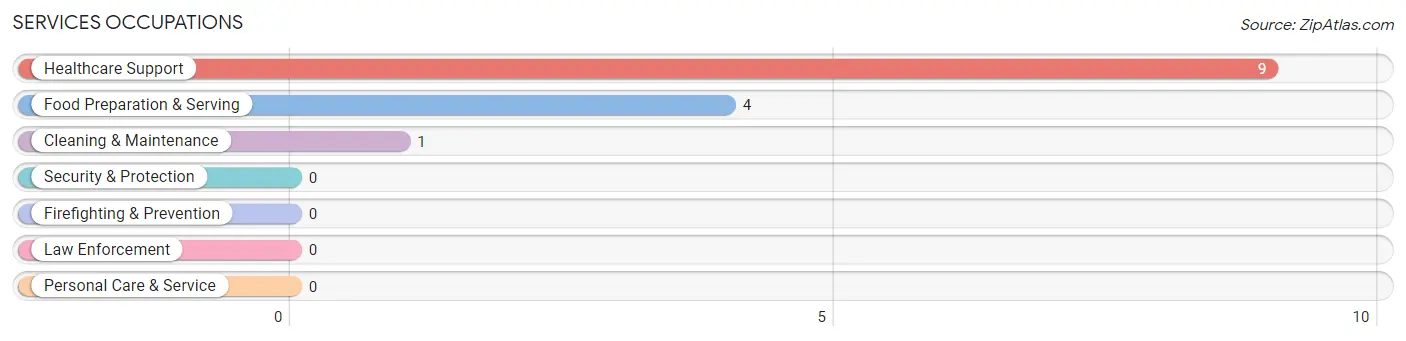
Services Occupations
The most common Services occupations in McCracken are Healthcare Support (9 | 19.6%), Food Preparation & Serving (4 | 8.7%), and Cleaning & Maintenance (1 | 2.2%).
Services Occupations by Sex
Within the Services occupations in McCracken, the most male-oriented occupations are Cleaning & Maintenance (100.0%), and Healthcare Support (66.7%), while the most female-oriented occupations are Food Preparation & Serving (100.0%), and Healthcare Support (33.3%).
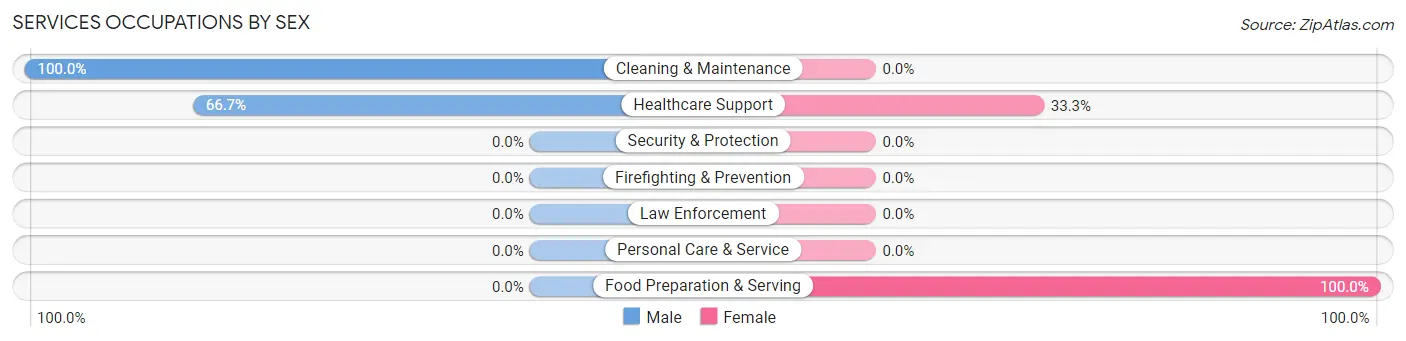
| Occupation | Male | Female |
| Healthcare Support | 6 (66.7%) | 3 (33.3%) |
| Security & Protection | 0 (0.0%) | 0 (0.0%) |
| Firefighting & Prevention | 0 (0.0%) | 0 (0.0%) |
| Law Enforcement | 0 (0.0%) | 0 (0.0%) |
| Food Preparation & Serving | 0 (0.0%) | 4 (100.0%) |
| Cleaning & Maintenance | 1 (100.0%) | 0 (0.0%) |
| Personal Care & Service | 0 (0.0%) | 0 (0.0%) |
| Total (Category) | 7 (50.0%) | 7 (50.0%) |
| Total (Overall) | 28 (60.9%) | 18 (39.1%) |
Sales and Office Occupations
The most common Sales and Office occupations in McCracken are Sales & Related (2 | 4.3%), and Office & Administration (1 | 2.2%).
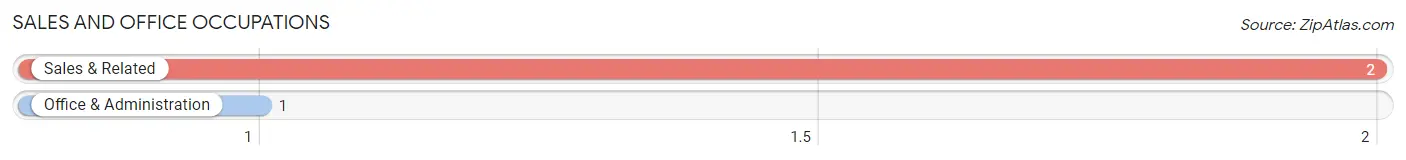
Sales and Office Occupations by Sex
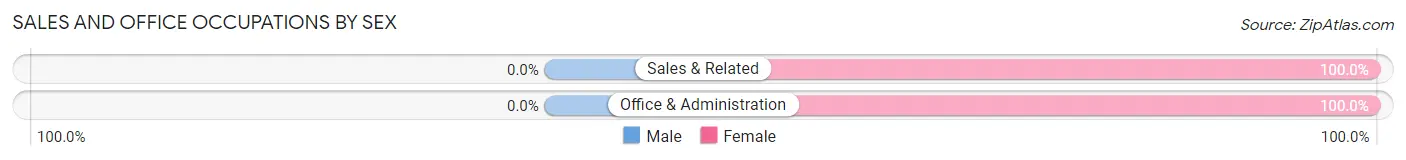
| Occupation | Male | Female |
| Sales & Related | 0 (0.0%) | 2 (100.0%) |
| Office & Administration | 0 (0.0%) | 1 (100.0%) |
| Total (Category) | 0 (0.0%) | 3 (100.0%) |
| Total (Overall) | 28 (60.9%) | 18 (39.1%) |
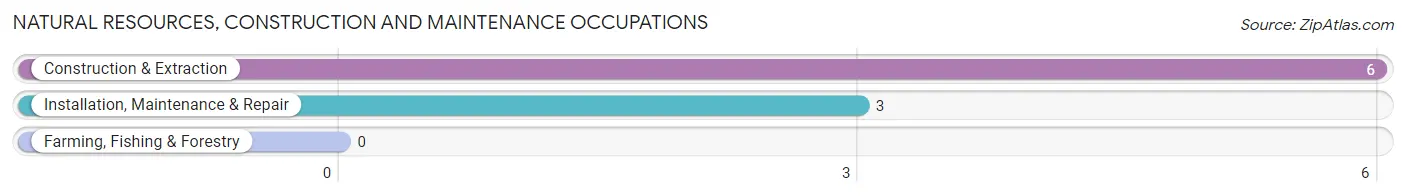
Natural Resources, Construction and Maintenance Occupations
The most common Natural Resources, Construction and Maintenance occupations in McCracken are Construction & Extraction (6 | 13.0%), and Installation, Maintenance & Repair (3 | 6.5%).
Natural Resources, Construction and Maintenance Occupations by Sex
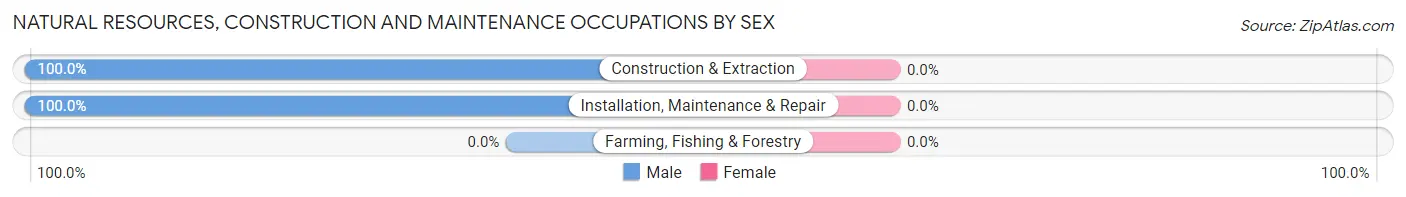
| Occupation | Male | Female |
| Farming, Fishing & Forestry | 0 (0.0%) | 0 (0.0%) |
| Construction & Extraction | 6 (100.0%) | 0 (0.0%) |
| Installation, Maintenance & Repair | 3 (100.0%) | 0 (0.0%) |
| Total (Category) | 9 (100.0%) | 0 (0.0%) |
| Total (Overall) | 28 (60.9%) | 18 (39.1%) |
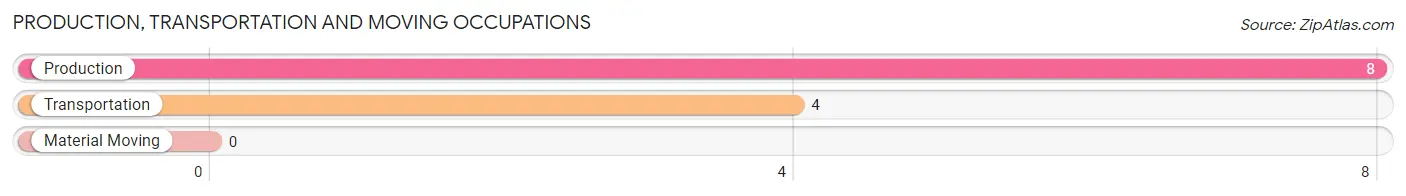
Production, Transportation and Moving Occupations
The most common Production, Transportation and Moving occupations in McCracken are Production (8 | 17.4%), and Transportation (4 | 8.7%).
Production, Transportation and Moving Occupations by Sex
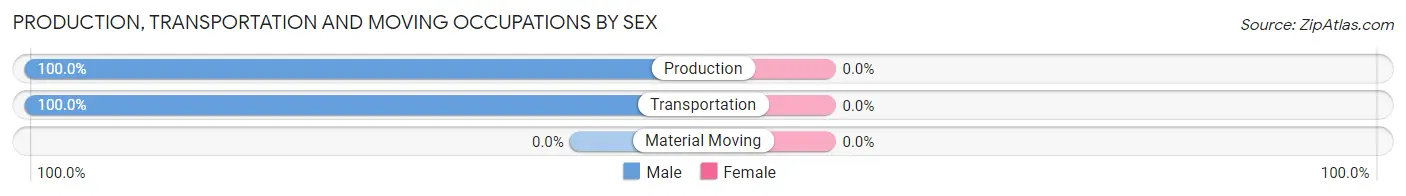
| Occupation | Male | Female |
| Production | 8 (100.0%) | 0 (0.0%) |
| Transportation | 4 (100.0%) | 0 (0.0%) |
| Material Moving | 0 (0.0%) | 0 (0.0%) |
| Total (Category) | 12 (100.0%) | 0 (0.0%) |
| Total (Overall) | 28 (60.9%) | 18 (39.1%) |
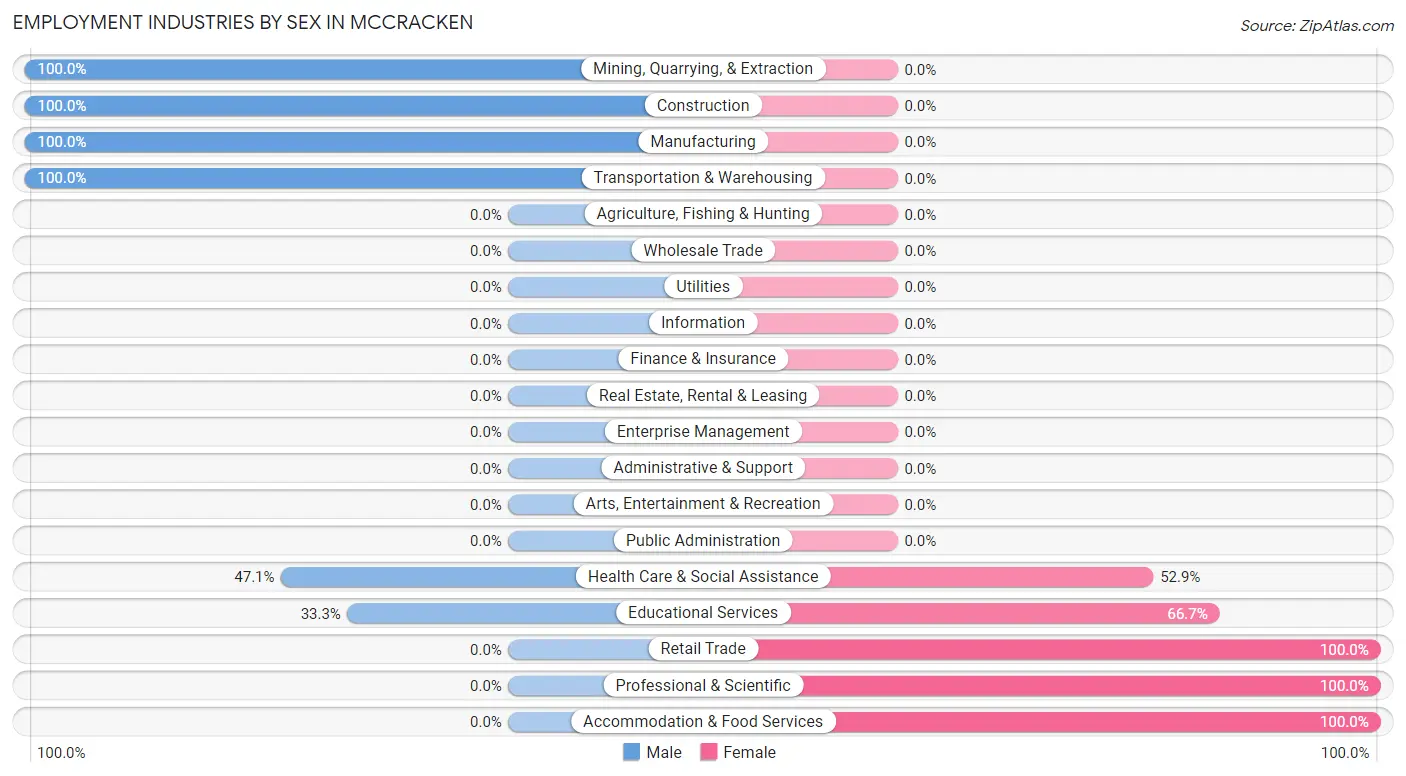
Employment Industries by Sex in McCracken
Employment Industries in McCracken
The major employment industries in McCracken include Health Care & Social Assistance (17 | 37.0%), Manufacturing (11 | 23.9%), Mining, Quarrying, & Extraction (4 | 8.7%), Construction (3 | 6.5%), and Retail Trade (3 | 6.5%).
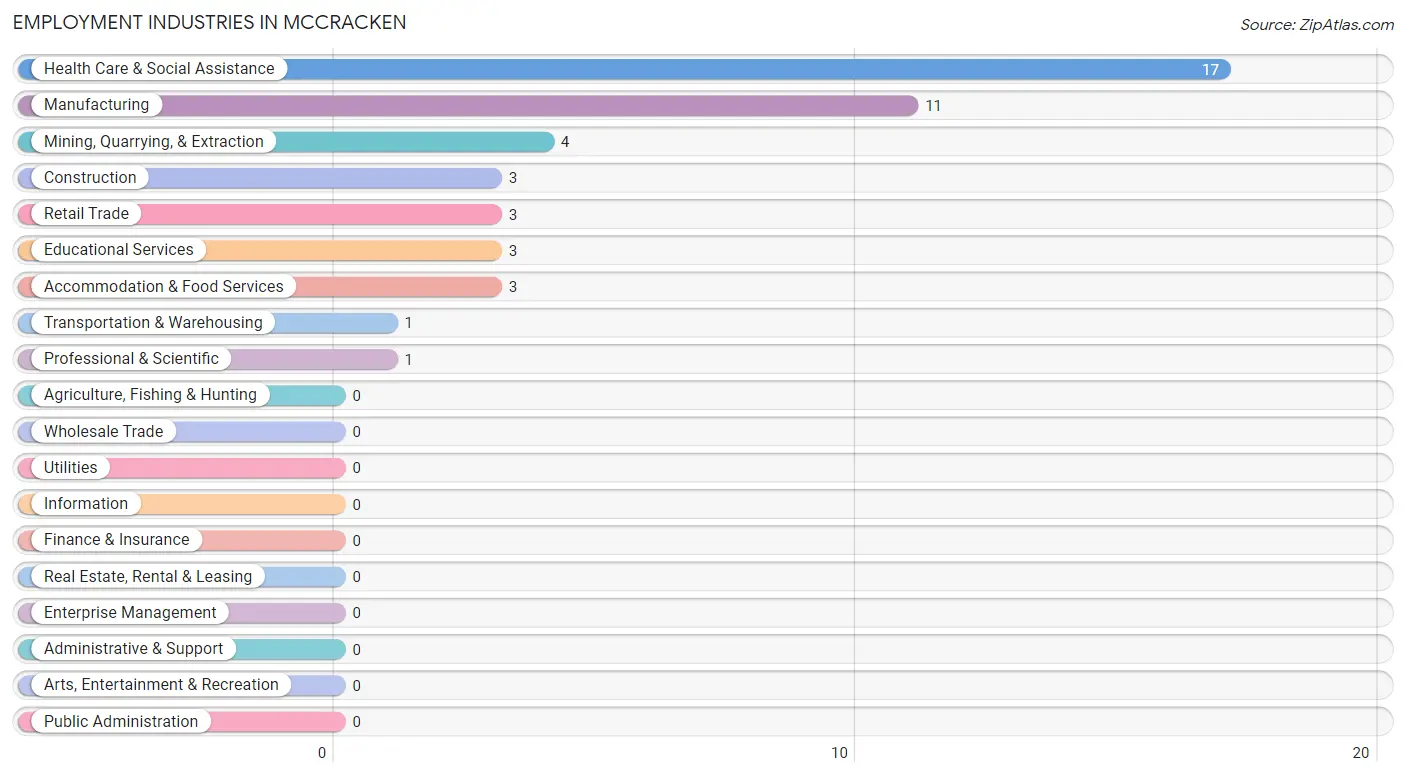
Employment Industries by Sex in McCracken
The McCracken industries that see more men than women are Mining, Quarrying, & Extraction (100.0%), Construction (100.0%), and Manufacturing (100.0%), whereas the industries that tend to have a higher number of women are Retail Trade (100.0%), Professional & Scientific (100.0%), and Accommodation & Food Services (100.0%).
| Industry | Male | Female |
| Agriculture, Fishing & Hunting | 0 (0.0%) | 0 (0.0%) |
| Mining, Quarrying, & Extraction | 4 (100.0%) | 0 (0.0%) |
| Construction | 3 (100.0%) | 0 (0.0%) |
| Manufacturing | 11 (100.0%) | 0 (0.0%) |
| Wholesale Trade | 0 (0.0%) | 0 (0.0%) |
| Retail Trade | 0 (0.0%) | 3 (100.0%) |
| Transportation & Warehousing | 1 (100.0%) | 0 (0.0%) |
| Utilities | 0 (0.0%) | 0 (0.0%) |
| Information | 0 (0.0%) | 0 (0.0%) |
| Finance & Insurance | 0 (0.0%) | 0 (0.0%) |
| Real Estate, Rental & Leasing | 0 (0.0%) | 0 (0.0%) |
| Professional & Scientific | 0 (0.0%) | 1 (100.0%) |
| Enterprise Management | 0 (0.0%) | 0 (0.0%) |
| Administrative & Support | 0 (0.0%) | 0 (0.0%) |
| Educational Services | 1 (33.3%) | 2 (66.7%) |
| Health Care & Social Assistance | 8 (47.1%) | 9 (52.9%) |
| Arts, Entertainment & Recreation | 0 (0.0%) | 0 (0.0%) |
| Accommodation & Food Services | 0 (0.0%) | 3 (100.0%) |
| Public Administration | 0 (0.0%) | 0 (0.0%) |
| Total | 28 (60.9%) | 18 (39.1%) |
Education in McCracken
School Enrollment in McCracken
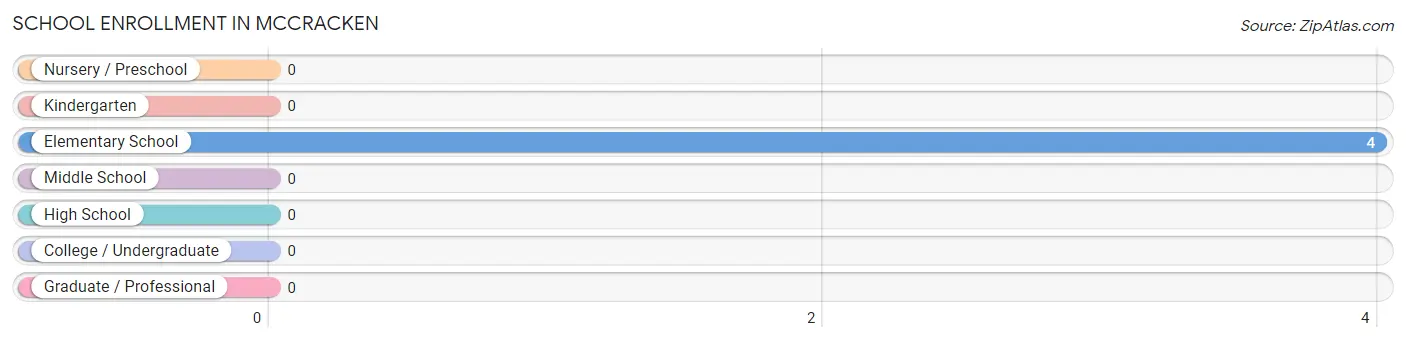
| School Level | # Students | % Students |
| Nursery / Preschool | 0 | 0.0% |
| Kindergarten | 0 | 0.0% |
| Elementary School | 4 | 100.0% |
| Middle School | 0 | 0.0% |
| High School | 0 | 0.0% |
| College / Undergraduate | 0 | 0.0% |
| Graduate / Professional | 0 | 0.0% |
| Total | 4 | 100.0% |
School Enrollment by Age by Funding Source in McCracken
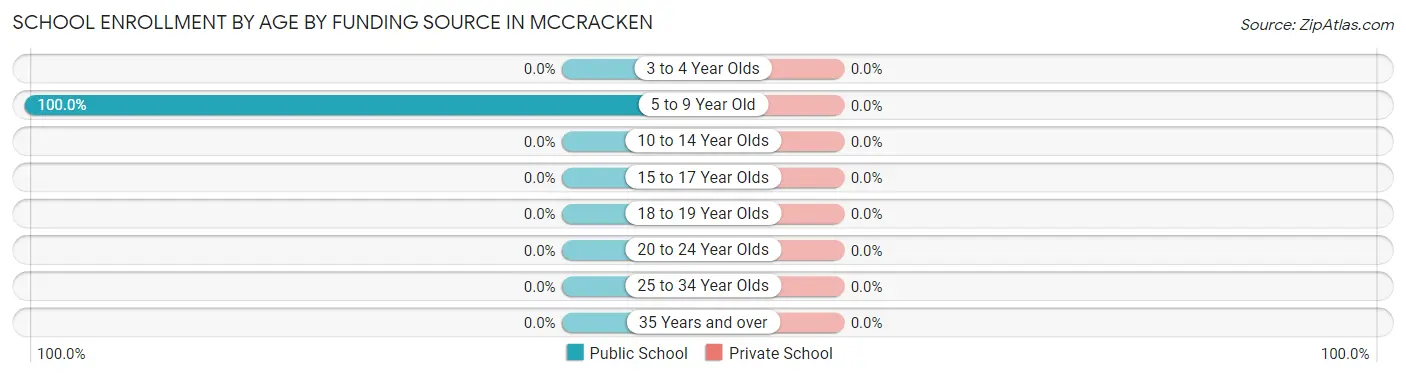
| Age Bracket | Public School | Private School |
| 3 to 4 Year Olds | 0 (0.0%) | 0 (0.0%) |
| 5 to 9 Year Old | 4 (100.0%) | 0 (0.0%) |
| 10 to 14 Year Olds | 0 (0.0%) | 0 (0.0%) |
| 15 to 17 Year Olds | 0 (0.0%) | 0 (0.0%) |
| 18 to 19 Year Olds | 0 (0.0%) | 0 (0.0%) |
| 20 to 24 Year Olds | 0 (0.0%) | 0 (0.0%) |
| 25 to 34 Year Olds | 0 (0.0%) | 0 (0.0%) |
| 35 Years and over | 0 (0.0%) | 0 (0.0%) |
| Total | 4 (100.0%) | 0 (0.0%) |
Educational Attainment by Field of Study in McCracken
Social sciences (5 | 45.5%), psychology (3 | 27.3%), science & technology (1 | 9.1%), literature & languages (1 | 9.1%), and visual & performing arts (1 | 9.1%) are the most common fields of study among 11 individuals in McCracken who have obtained a bachelor's degree or higher.
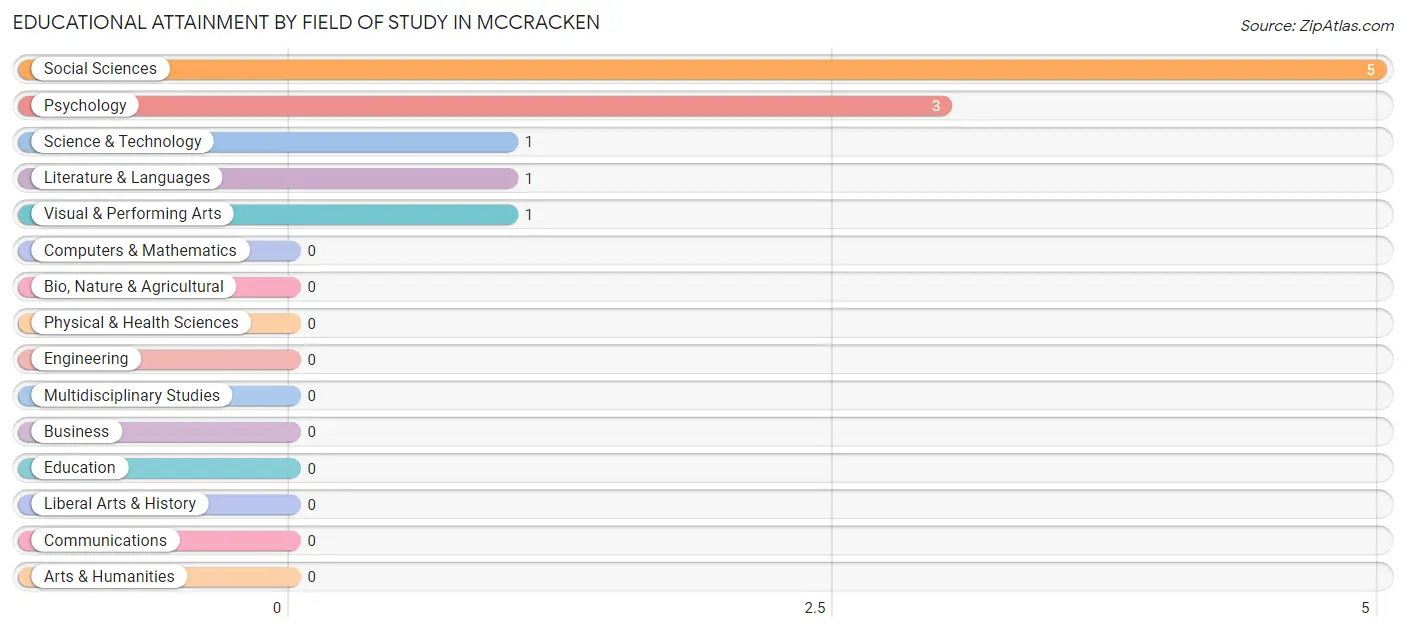
| Field of Study | # Graduates | % Graduates |
| Computers & Mathematics | 0 | 0.0% |
| Bio, Nature & Agricultural | 0 | 0.0% |
| Physical & Health Sciences | 0 | 0.0% |
| Psychology | 3 | 27.3% |
| Social Sciences | 5 | 45.5% |
| Engineering | 0 | 0.0% |
| Multidisciplinary Studies | 0 | 0.0% |
| Science & Technology | 1 | 9.1% |
| Business | 0 | 0.0% |
| Education | 0 | 0.0% |
| Literature & Languages | 1 | 9.1% |
| Liberal Arts & History | 0 | 0.0% |
| Visual & Performing Arts | 1 | 9.1% |
| Communications | 0 | 0.0% |
| Arts & Humanities | 0 | 0.0% |
| Total | 11 | 100.0% |
Transportation & Commute in McCracken
Vehicle Availability by Sex in McCracken
The most prevalent vehicle ownership categories in McCracken are males with 2 vehicles (16, accounting for 61.5%) and females with 2 vehicles (13, making up 88.9%).
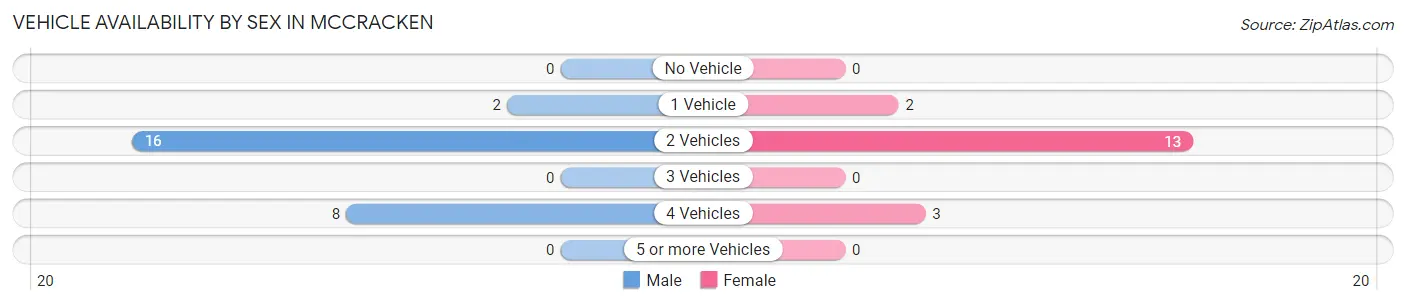
| Vehicles Available | Male | Female |
| No Vehicle | 0 (0.0%) | 0 (0.0%) |
| 1 Vehicle | 2 (7.7%) | 2 (11.1%) |
| 2 Vehicles | 16 (61.5%) | 13 (72.2%) |
| 3 Vehicles | 0 (0.0%) | 0 (0.0%) |
| 4 Vehicles | 8 (30.8%) | 3 (16.7%) |
| 5 or more Vehicles | 0 (0.0%) | 0 (0.0%) |
| Total | 26 (100.0%) | 18 (100.0%) |
Commute Time in McCracken
The most frequently occuring commute durations in McCracken are 30 to 34 minutes (12 commuters, 27.3%), 20 to 24 minutes (9 commuters, 20.4%), and 45 to 59 minutes (9 commuters, 20.4%).
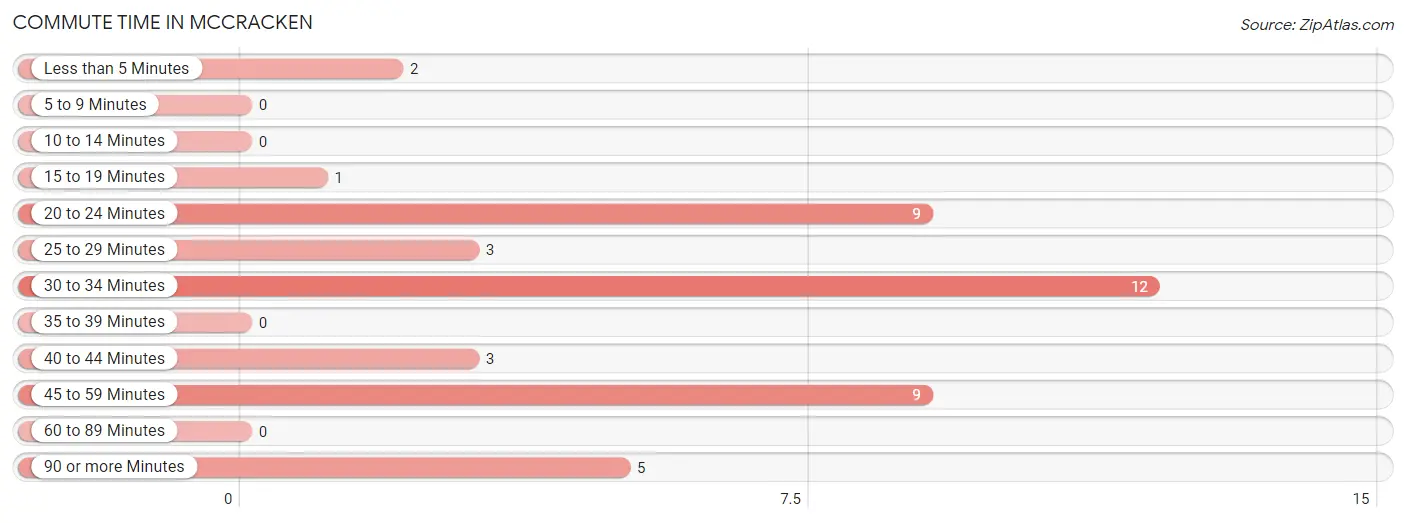
| Commute Time | # Commuters | % Commuters |
| Less than 5 Minutes | 2 | 4.5% |
| 5 to 9 Minutes | 0 | 0.0% |
| 10 to 14 Minutes | 0 | 0.0% |
| 15 to 19 Minutes | 1 | 2.3% |
| 20 to 24 Minutes | 9 | 20.4% |
| 25 to 29 Minutes | 3 | 6.8% |
| 30 to 34 Minutes | 12 | 27.3% |
| 35 to 39 Minutes | 0 | 0.0% |
| 40 to 44 Minutes | 3 | 6.8% |
| 45 to 59 Minutes | 9 | 20.4% |
| 60 to 89 Minutes | 0 | 0.0% |
| 90 or more Minutes | 5 | 11.4% |
Commute Time by Sex in McCracken
The most common commute times in McCracken are 30 to 34 minutes (12 commuters, 46.2%) for males and 45 to 59 minutes (9 commuters, 50.0%) for females.
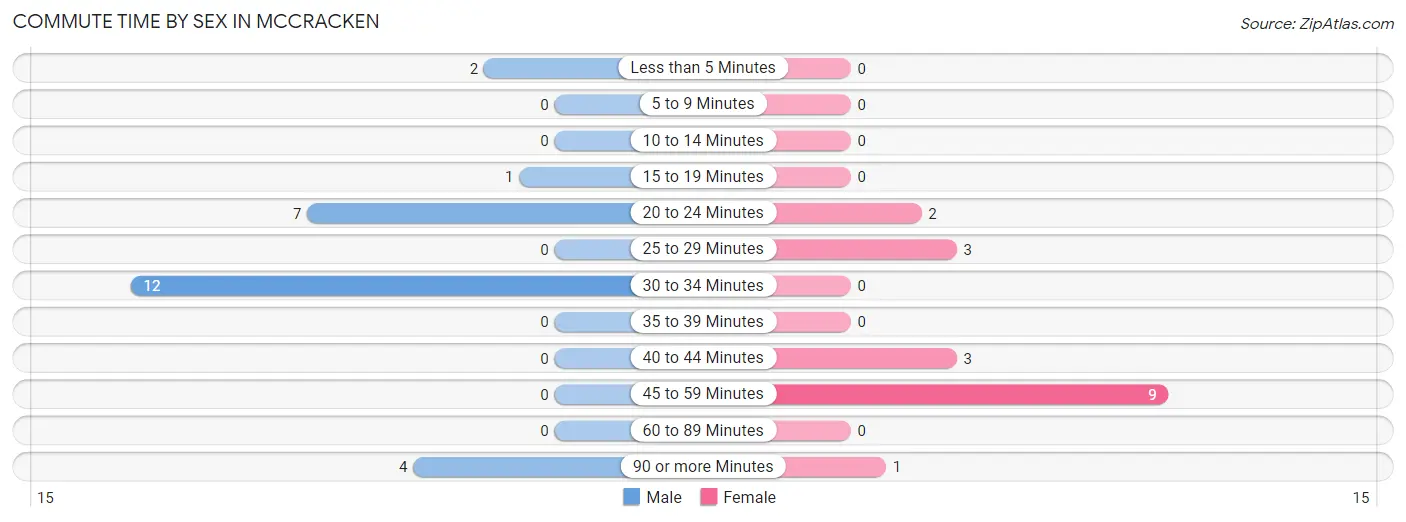
| Commute Time | Male | Female |
| Less than 5 Minutes | 2 (7.7%) | 0 (0.0%) |
| 5 to 9 Minutes | 0 (0.0%) | 0 (0.0%) |
| 10 to 14 Minutes | 0 (0.0%) | 0 (0.0%) |
| 15 to 19 Minutes | 1 (3.8%) | 0 (0.0%) |
| 20 to 24 Minutes | 7 (26.9%) | 2 (11.1%) |
| 25 to 29 Minutes | 0 (0.0%) | 3 (16.7%) |
| 30 to 34 Minutes | 12 (46.2%) | 0 (0.0%) |
| 35 to 39 Minutes | 0 (0.0%) | 0 (0.0%) |
| 40 to 44 Minutes | 0 (0.0%) | 3 (16.7%) |
| 45 to 59 Minutes | 0 (0.0%) | 9 (50.0%) |
| 60 to 89 Minutes | 0 (0.0%) | 0 (0.0%) |
| 90 or more Minutes | 4 (15.4%) | 1 (5.6%) |
Time of Departure to Work by Sex in McCracken
The most frequent times of departure to work in McCracken are 6:30 AM to 6:59 AM (8, 30.8%) for males and 5:00 AM to 5:29 AM (4, 22.2%) for females.
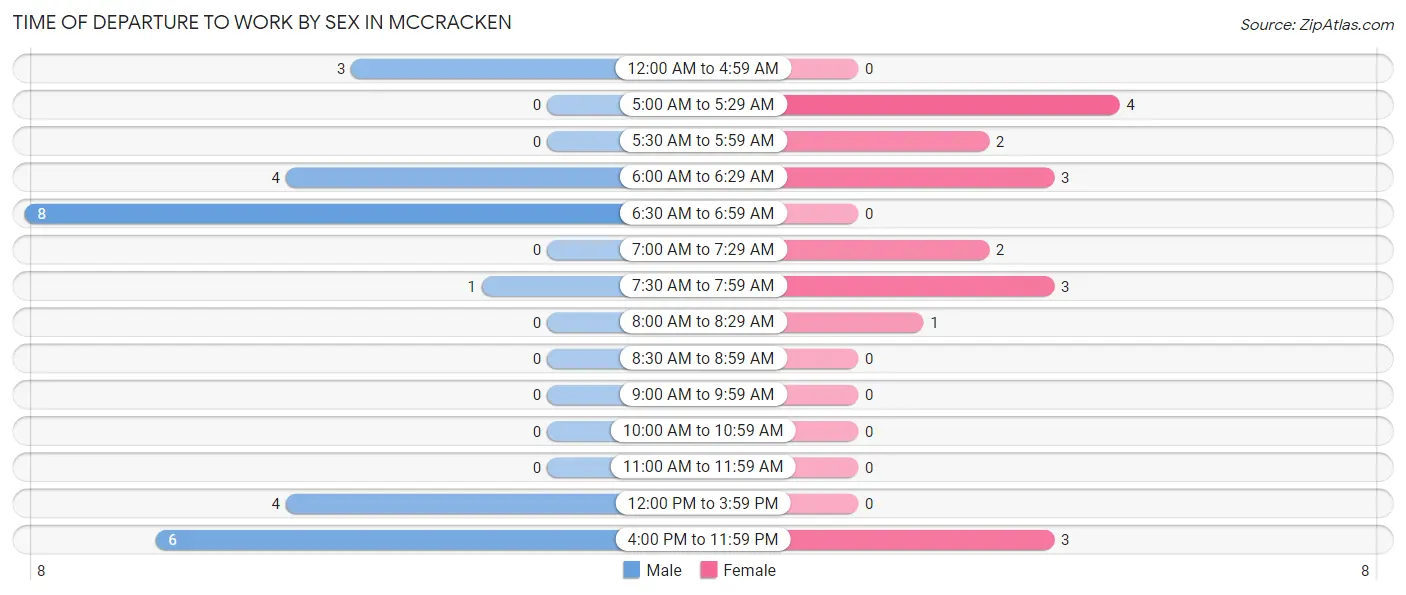
| Time of Departure | Male | Female |
| 12:00 AM to 4:59 AM | 3 (11.5%) | 0 (0.0%) |
| 5:00 AM to 5:29 AM | 0 (0.0%) | 4 (22.2%) |
| 5:30 AM to 5:59 AM | 0 (0.0%) | 2 (11.1%) |
| 6:00 AM to 6:29 AM | 4 (15.4%) | 3 (16.7%) |
| 6:30 AM to 6:59 AM | 8 (30.8%) | 0 (0.0%) |
| 7:00 AM to 7:29 AM | 0 (0.0%) | 2 (11.1%) |
| 7:30 AM to 7:59 AM | 1 (3.8%) | 3 (16.7%) |
| 8:00 AM to 8:29 AM | 0 (0.0%) | 1 (5.6%) |
| 8:30 AM to 8:59 AM | 0 (0.0%) | 0 (0.0%) |
| 9:00 AM to 9:59 AM | 0 (0.0%) | 0 (0.0%) |
| 10:00 AM to 10:59 AM | 0 (0.0%) | 0 (0.0%) |
| 11:00 AM to 11:59 AM | 0 (0.0%) | 0 (0.0%) |
| 12:00 PM to 3:59 PM | 4 (15.4%) | 0 (0.0%) |
| 4:00 PM to 11:59 PM | 6 (23.1%) | 3 (16.7%) |
| Total | 26 (100.0%) | 18 (100.0%) |
Housing Occupancy in McCracken
Occupancy by Ownership in McCracken
Of the total 54 dwellings in McCracken, owner-occupied units account for 51 (94.4%), while renter-occupied units make up 3 (5.6%).
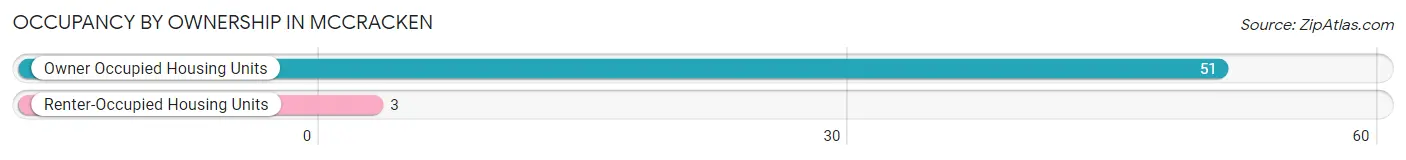
| Occupancy | # Housing Units | % Housing Units |
| Owner Occupied Housing Units | 51 | 94.4% |
| Renter-Occupied Housing Units | 3 | 5.6% |
| Total Occupied Housing Units | 54 | 100.0% |
Occupancy by Household Size in McCracken
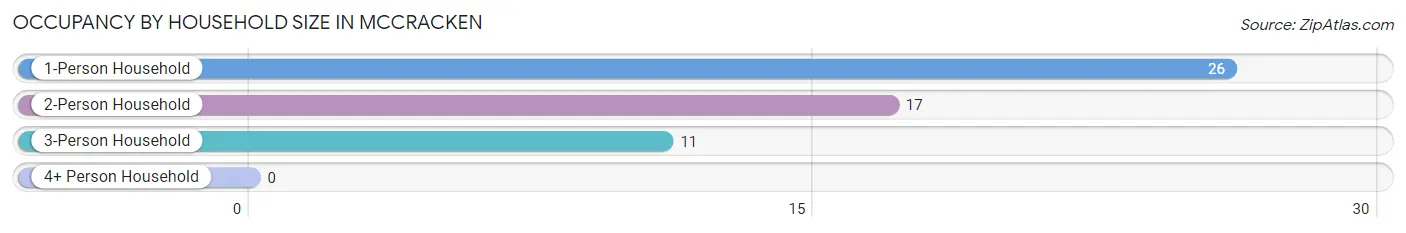
| Household Size | # Housing Units | % Housing Units |
| 1-Person Household | 26 | 48.1% |
| 2-Person Household | 17 | 31.5% |
| 3-Person Household | 11 | 20.4% |
| 4+ Person Household | 0 | 0.0% |
| Total Housing Units | 54 | 100.0% |
Occupancy by Ownership by Household Size in McCracken
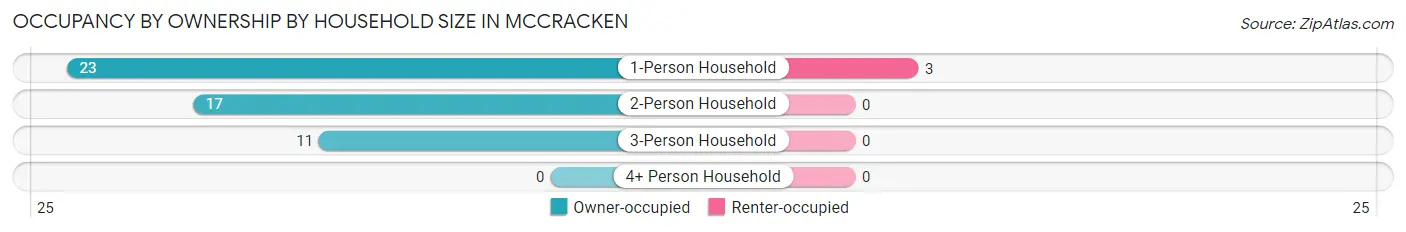
| Household Size | Owner-occupied | Renter-occupied |
| 1-Person Household | 23 (88.5%) | 3 (11.5%) |
| 2-Person Household | 17 (100.0%) | 0 (0.0%) |
| 3-Person Household | 11 (100.0%) | 0 (0.0%) |
| 4+ Person Household | 0 (0.0%) | 0 (0.0%) |
| Total Housing Units | 51 (94.4%) | 3 (5.6%) |
Occupancy by Educational Attainment in McCracken
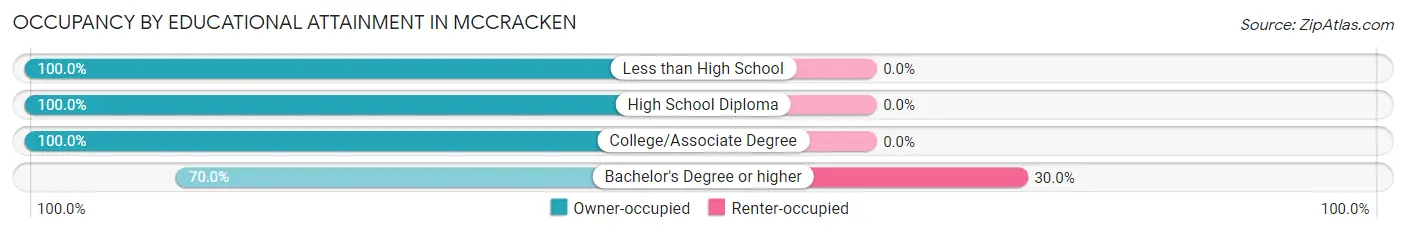
| Household Size | Owner-occupied | Renter-occupied |
| Less than High School | 2 (100.0%) | 0 (0.0%) |
| High School Diploma | 15 (100.0%) | 0 (0.0%) |
| College/Associate Degree | 27 (100.0%) | 0 (0.0%) |
| Bachelor's Degree or higher | 7 (70.0%) | 3 (30.0%) |
Occupancy by Age of Householder in McCracken
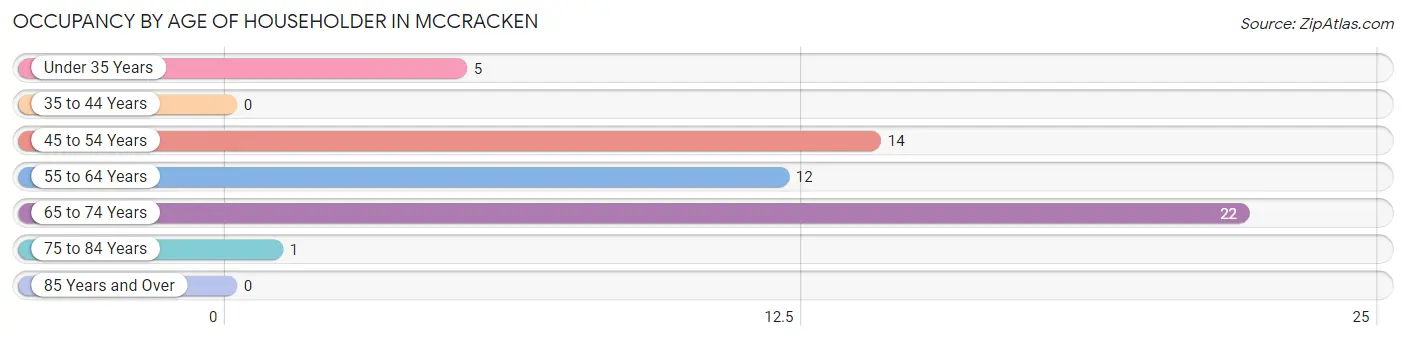
| Age Bracket | # Households | % Households |
| Under 35 Years | 5 | 9.3% |
| 35 to 44 Years | 0 | 0.0% |
| 45 to 54 Years | 14 | 25.9% |
| 55 to 64 Years | 12 | 22.2% |
| 65 to 74 Years | 22 | 40.7% |
| 75 to 84 Years | 1 | 1.8% |
| 85 Years and Over | 0 | 0.0% |
| Total | 54 | 100.0% |
Housing Finances in McCracken
Median Income by Occupancy in McCracken
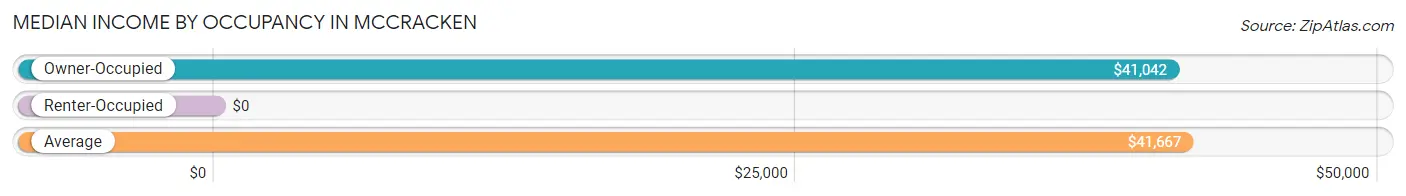
| Occupancy Type | # Households | Median Income |
| Owner-Occupied | 51 (94.4%) | $41,042 |
| Renter-Occupied | 3 (5.6%) | $0 |
| Average | 54 (100.0%) | $41,667 |
Occupancy by Householder Income Bracket in McCracken
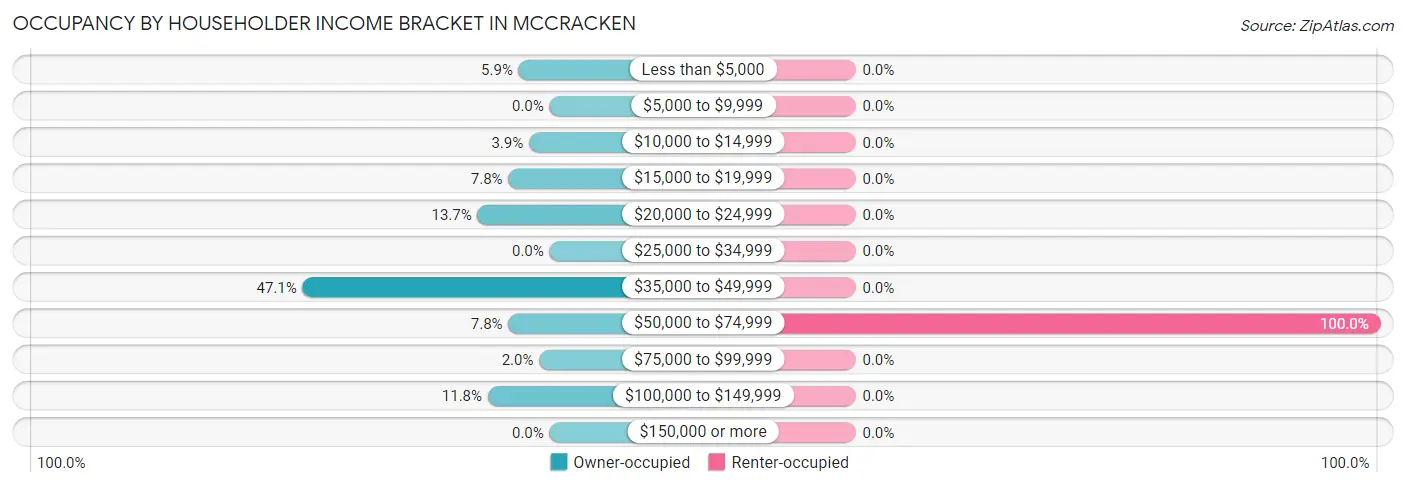
| Income Bracket | Owner-occupied | Renter-occupied |
| Less than $5,000 | 3 (5.9%) | 0 (0.0%) |
| $5,000 to $9,999 | 0 (0.0%) | 0 (0.0%) |
| $10,000 to $14,999 | 2 (3.9%) | 0 (0.0%) |
| $15,000 to $19,999 | 4 (7.8%) | 0 (0.0%) |
| $20,000 to $24,999 | 7 (13.7%) | 0 (0.0%) |
| $25,000 to $34,999 | 0 (0.0%) | 0 (0.0%) |
| $35,000 to $49,999 | 24 (47.1%) | 0 (0.0%) |
| $50,000 to $74,999 | 4 (7.8%) | 3 (100.0%) |
| $75,000 to $99,999 | 1 (2.0%) | 0 (0.0%) |
| $100,000 to $149,999 | 6 (11.8%) | 0 (0.0%) |
| $150,000 or more | 0 (0.0%) | 0 (0.0%) |
| Total | 51 (100.0%) | 3 (100.0%) |
Monthly Housing Cost Tiers in McCracken
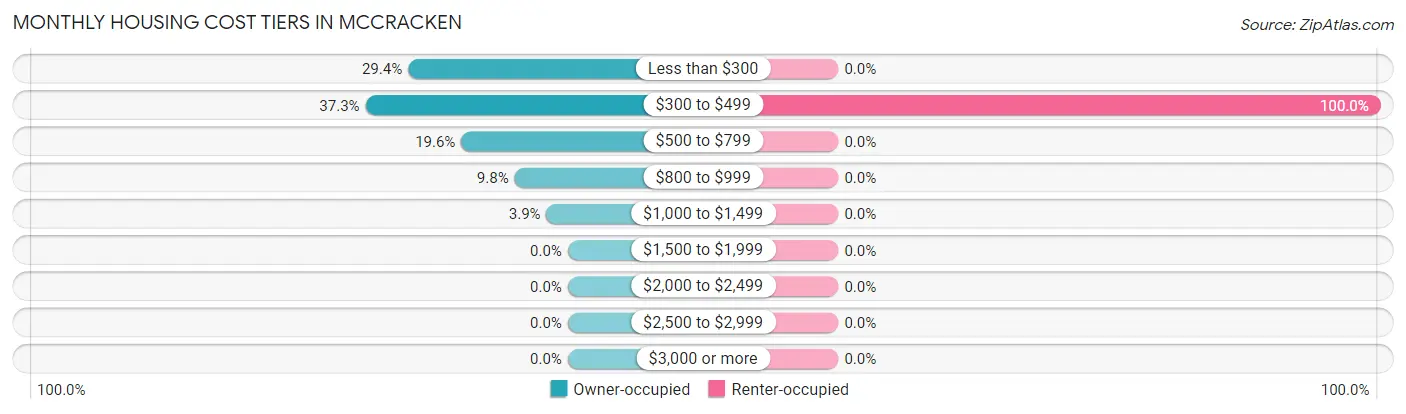
| Monthly Cost | Owner-occupied | Renter-occupied |
| Less than $300 | 15 (29.4%) | 0 (0.0%) |
| $300 to $499 | 19 (37.2%) | 3 (100.0%) |
| $500 to $799 | 10 (19.6%) | 0 (0.0%) |
| $800 to $999 | 5 (9.8%) | 0 (0.0%) |
| $1,000 to $1,499 | 2 (3.9%) | 0 (0.0%) |
| $1,500 to $1,999 | 0 (0.0%) | 0 (0.0%) |
| $2,000 to $2,499 | 0 (0.0%) | 0 (0.0%) |
| $2,500 to $2,999 | 0 (0.0%) | 0 (0.0%) |
| $3,000 or more | 0 (0.0%) | 0 (0.0%) |
| Total | 51 (100.0%) | 3 (100.0%) |
Physical Housing Characteristics in McCracken
Housing Structures in McCracken
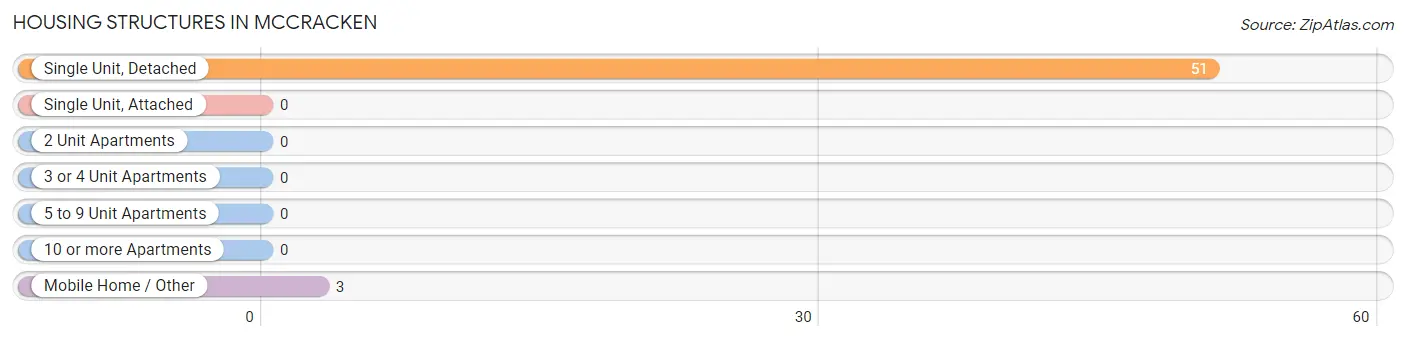
| Structure Type | # Housing Units | % Housing Units |
| Single Unit, Detached | 51 | 94.4% |
| Single Unit, Attached | 0 | 0.0% |
| 2 Unit Apartments | 0 | 0.0% |
| 3 or 4 Unit Apartments | 0 | 0.0% |
| 5 to 9 Unit Apartments | 0 | 0.0% |
| 10 or more Apartments | 0 | 0.0% |
| Mobile Home / Other | 3 | 5.6% |
| Total | 54 | 100.0% |
Housing Structures by Occupancy in McCracken
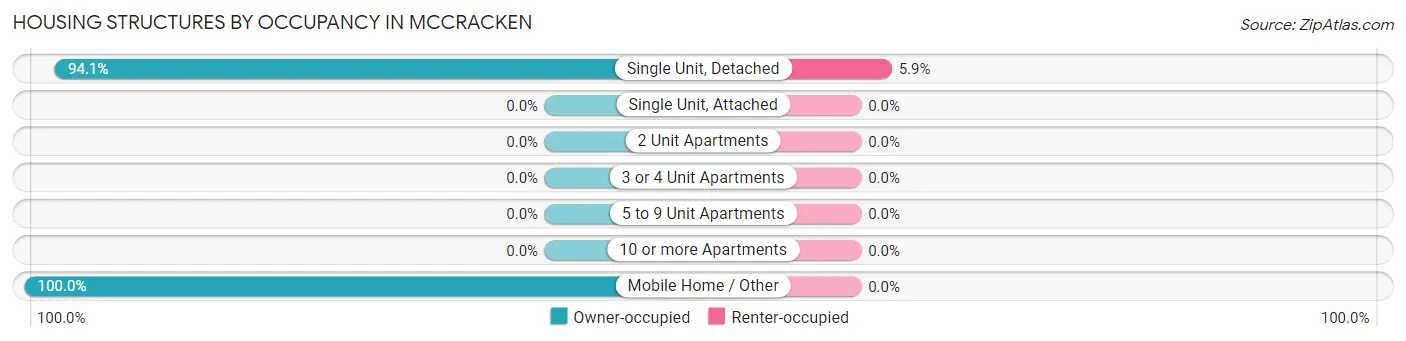
| Structure Type | Owner-occupied | Renter-occupied |
| Single Unit, Detached | 48 (94.1%) | 3 (5.9%) |
| Single Unit, Attached | 0 (0.0%) | 0 (0.0%) |
| 2 Unit Apartments | 0 (0.0%) | 0 (0.0%) |
| 3 or 4 Unit Apartments | 0 (0.0%) | 0 (0.0%) |
| 5 to 9 Unit Apartments | 0 (0.0%) | 0 (0.0%) |
| 10 or more Apartments | 0 (0.0%) | 0 (0.0%) |
| Mobile Home / Other | 3 (100.0%) | 0 (0.0%) |
| Total | 51 (94.4%) | 3 (5.6%) |
Housing Structures by Number of Rooms in McCracken
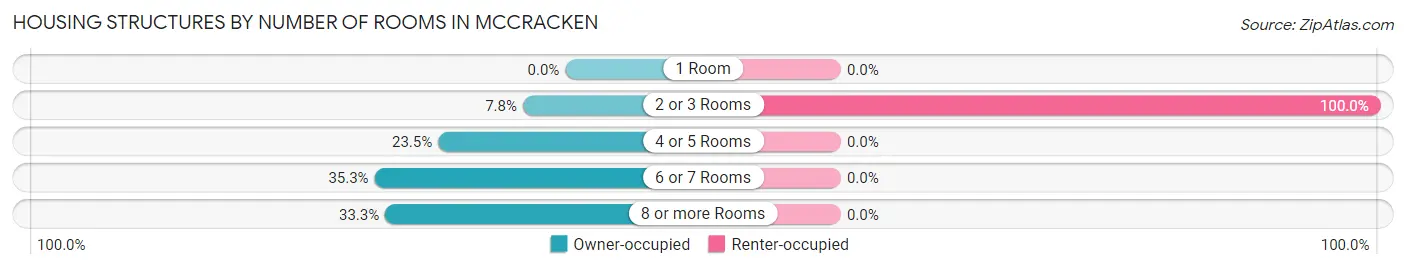
| Number of Rooms | Owner-occupied | Renter-occupied |
| 1 Room | 0 (0.0%) | 0 (0.0%) |
| 2 or 3 Rooms | 4 (7.8%) | 3 (100.0%) |
| 4 or 5 Rooms | 12 (23.5%) | 0 (0.0%) |
| 6 or 7 Rooms | 18 (35.3%) | 0 (0.0%) |
| 8 or more Rooms | 17 (33.3%) | 0 (0.0%) |
| Total | 51 (100.0%) | 3 (100.0%) |
Housing Structure by Heating Type in McCracken
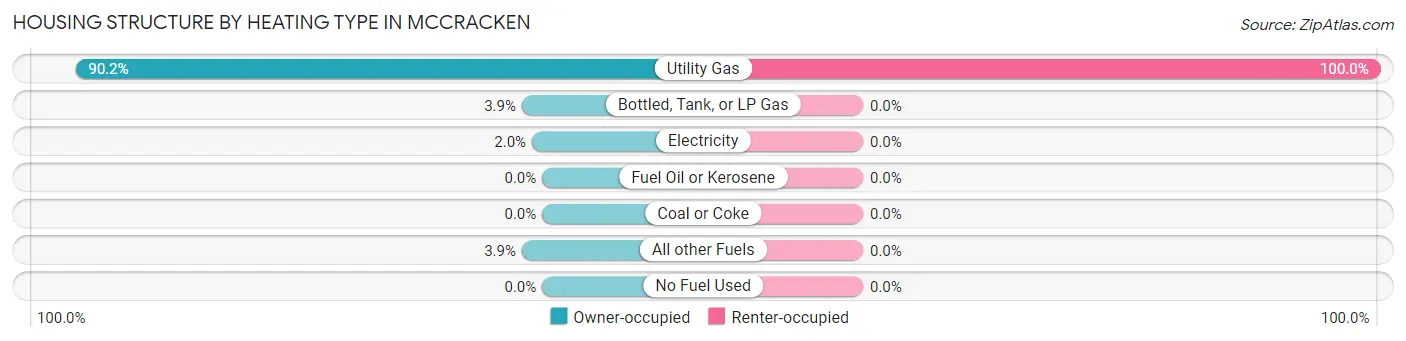
| Heating Type | Owner-occupied | Renter-occupied |
| Utility Gas | 46 (90.2%) | 3 (100.0%) |
| Bottled, Tank, or LP Gas | 2 (3.9%) | 0 (0.0%) |
| Electricity | 1 (2.0%) | 0 (0.0%) |
| Fuel Oil or Kerosene | 0 (0.0%) | 0 (0.0%) |
| Coal or Coke | 0 (0.0%) | 0 (0.0%) |
| All other Fuels | 2 (3.9%) | 0 (0.0%) |
| No Fuel Used | 0 (0.0%) | 0 (0.0%) |
| Total | 51 (100.0%) | 3 (100.0%) |
Household Vehicle Usage in McCracken
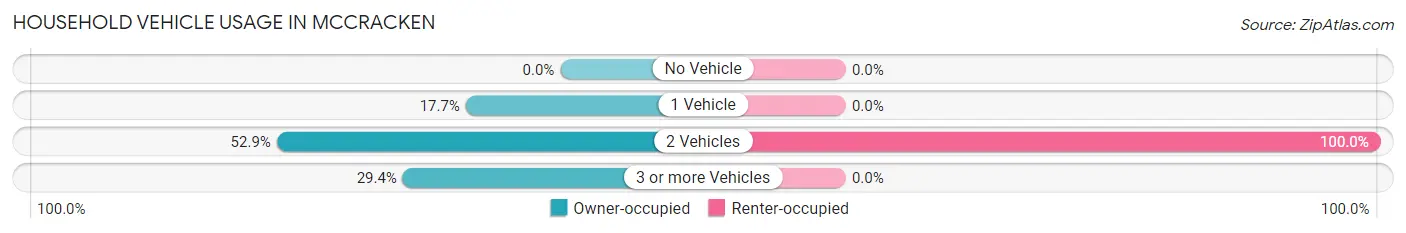
| Vehicles per Household | Owner-occupied | Renter-occupied |
| No Vehicle | 0 (0.0%) | 0 (0.0%) |
| 1 Vehicle | 9 (17.6%) | 0 (0.0%) |
| 2 Vehicles | 27 (52.9%) | 3 (100.0%) |
| 3 or more Vehicles | 15 (29.4%) | 0 (0.0%) |
| Total | 51 (100.0%) | 3 (100.0%) |
Real Estate & Mortgages in McCracken
Real Estate and Mortgage Overview in McCracken
| Characteristic | Without Mortgage | With Mortgage |
| Housing Units | 41 | 10 |
| Median Property Value | $45,000 | $60,000 |
| Median Household Income | $37,321 | $0 |
| Monthly Housing Costs | $363 | $0 |
| Real Estate Taxes | $900 | $0 |
Property Value by Mortgage Status in McCracken
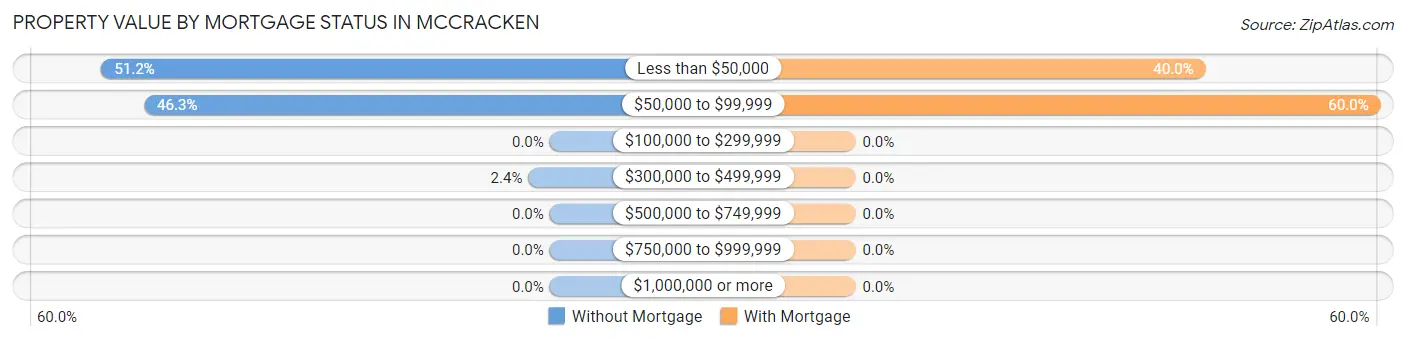
| Property Value | Without Mortgage | With Mortgage |
| Less than $50,000 | 21 (51.2%) | 4 (40.0%) |
| $50,000 to $99,999 | 19 (46.3%) | 6 (60.0%) |
| $100,000 to $299,999 | 0 (0.0%) | 0 (0.0%) |
| $300,000 to $499,999 | 1 (2.4%) | 0 (0.0%) |
| $500,000 to $749,999 | 0 (0.0%) | 0 (0.0%) |
| $750,000 to $999,999 | 0 (0.0%) | 0 (0.0%) |
| $1,000,000 or more | 0 (0.0%) | 0 (0.0%) |
| Total | 41 (100.0%) | 10 (100.0%) |
Household Income by Mortgage Status in McCracken
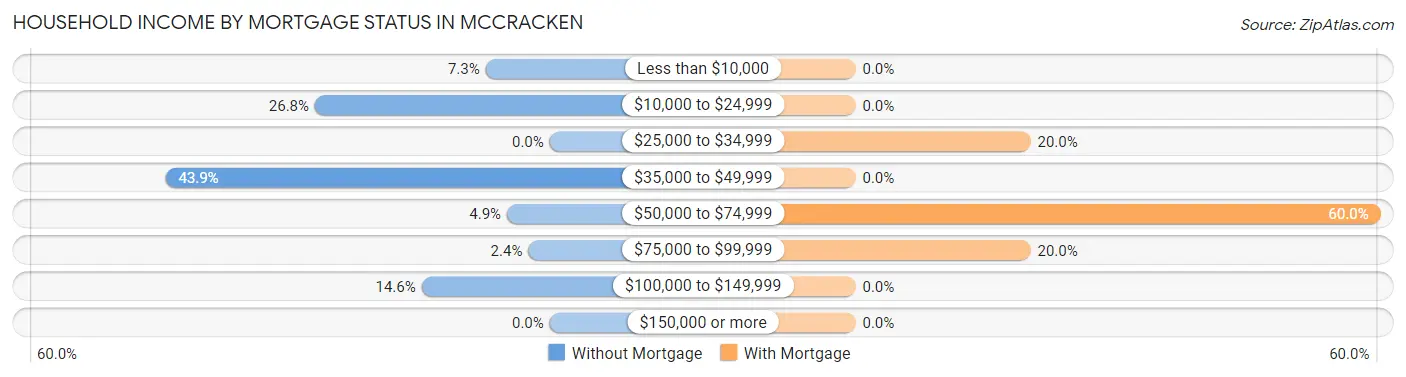
| Household Income | Without Mortgage | With Mortgage |
| Less than $10,000 | 3 (7.3%) | 0 (0.0%) |
| $10,000 to $24,999 | 11 (26.8%) | 0 (0.0%) |
| $25,000 to $34,999 | 0 (0.0%) | 2 (20.0%) |
| $35,000 to $49,999 | 18 (43.9%) | 0 (0.0%) |
| $50,000 to $74,999 | 2 (4.9%) | 6 (60.0%) |
| $75,000 to $99,999 | 1 (2.4%) | 2 (20.0%) |
| $100,000 to $149,999 | 6 (14.6%) | 0 (0.0%) |
| $150,000 or more | 0 (0.0%) | 0 (0.0%) |
| Total | 41 (100.0%) | 10 (100.0%) |
Property Value to Household Income Ratio in McCracken
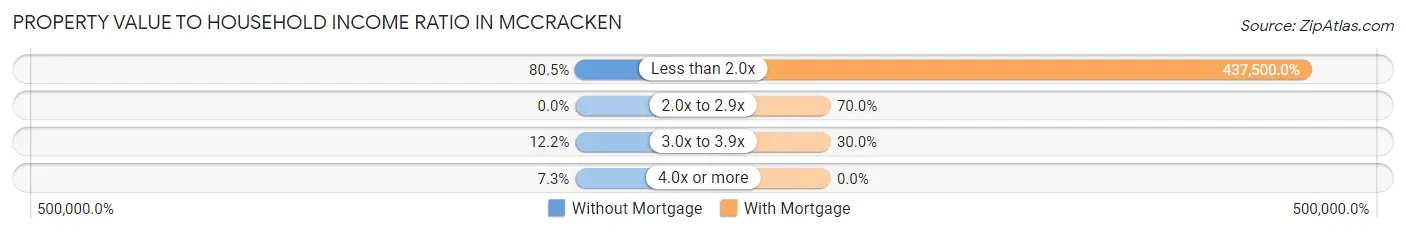
| Value-to-Income Ratio | Without Mortgage | With Mortgage |
| Less than 2.0x | 33 (80.5%) | 43,750 (437,500.0%) |
| 2.0x to 2.9x | 0 (0.0%) | 7 (70.0%) |
| 3.0x to 3.9x | 5 (12.2%) | 3 (30.0%) |
| 4.0x or more | 3 (7.3%) | 0 (0.0%) |
| Total | 41 (100.0%) | 10 (100.0%) |
Real Estate Taxes by Mortgage Status in McCracken
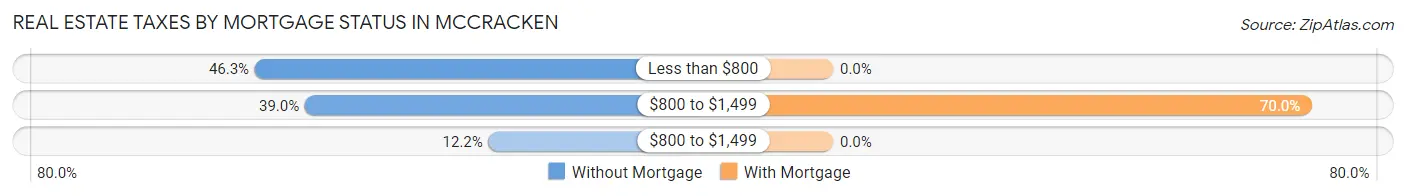
| Property Taxes | Without Mortgage | With Mortgage |
| Less than $800 | 19 (46.3%) | 0 (0.0%) |
| $800 to $1,499 | 16 (39.0%) | 7 (70.0%) |
| $800 to $1,499 | 5 (12.2%) | 0 (0.0%) |
| Total | 41 (100.0%) | 10 (100.0%) |
Health & Disability in McCracken
Health Insurance Coverage by Age in McCracken
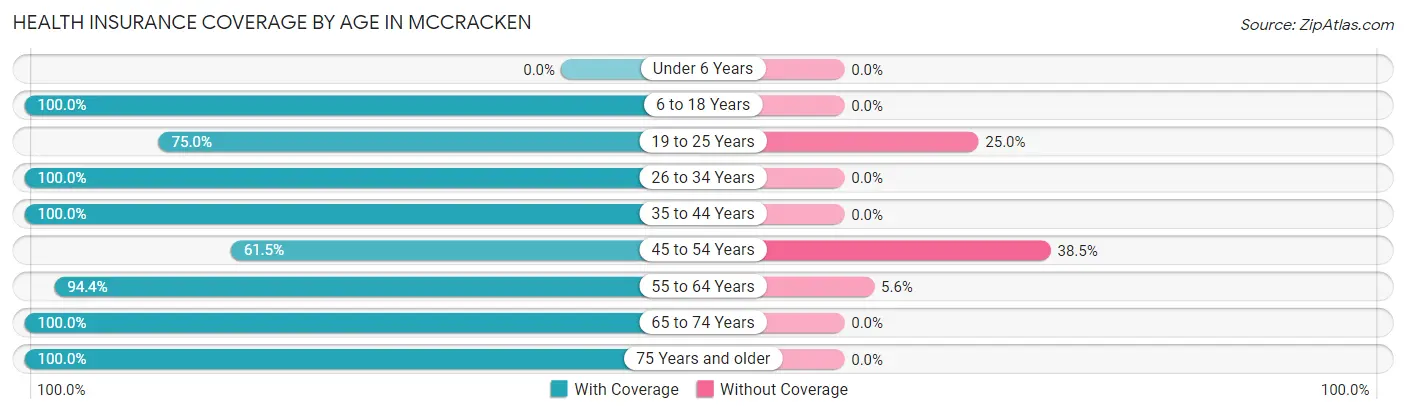
| Age Bracket | With Coverage | Without Coverage |
| Under 6 Years | 0 (0.0%) | 0 (0.0%) |
| 6 to 18 Years | 4 (100.0%) | 0 (0.0%) |
| 19 to 25 Years | 6 (75.0%) | 2 (25.0%) |
| 26 to 34 Years | 13 (100.0%) | 0 (0.0%) |
| 35 to 44 Years | 4 (100.0%) | 0 (0.0%) |
| 45 to 54 Years | 16 (61.5%) | 10 (38.5%) |
| 55 to 64 Years | 17 (94.4%) | 1 (5.6%) |
| 65 to 74 Years | 26 (100.0%) | 0 (0.0%) |
| 75 Years and older | 2 (100.0%) | 0 (0.0%) |
| Total | 88 (87.1%) | 13 (12.9%) |
Health Insurance Coverage by Citizenship Status in McCracken
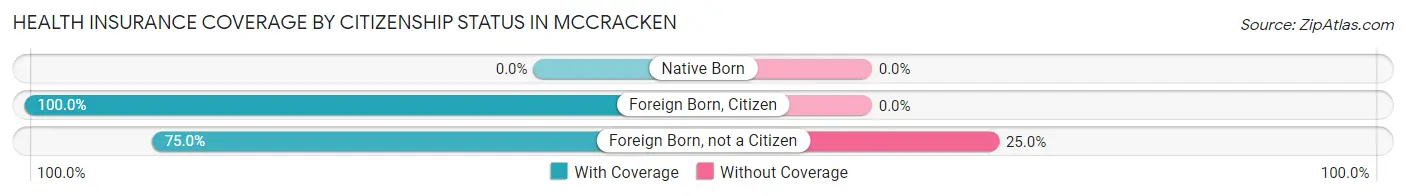
| Citizenship Status | With Coverage | Without Coverage |
| Native Born | 0 (0.0%) | 0 (0.0%) |
| Foreign Born, Citizen | 4 (100.0%) | 0 (0.0%) |
| Foreign Born, not a Citizen | 6 (75.0%) | 2 (25.0%) |
Health Insurance Coverage by Household Income in McCracken
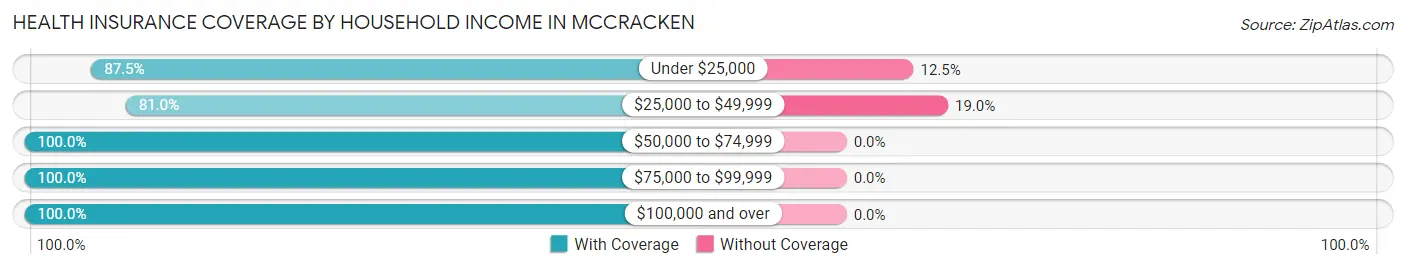
| Household Income | With Coverage | Without Coverage |
| Under $25,000 | 14 (87.5%) | 2 (12.5%) |
| $25,000 to $49,999 | 47 (81.0%) | 11 (19.0%) |
| $50,000 to $74,999 | 12 (100.0%) | 0 (0.0%) |
| $75,000 to $99,999 | 1 (100.0%) | 0 (0.0%) |
| $100,000 and over | 14 (100.0%) | 0 (0.0%) |
Public vs Private Health Insurance Coverage by Age in McCracken
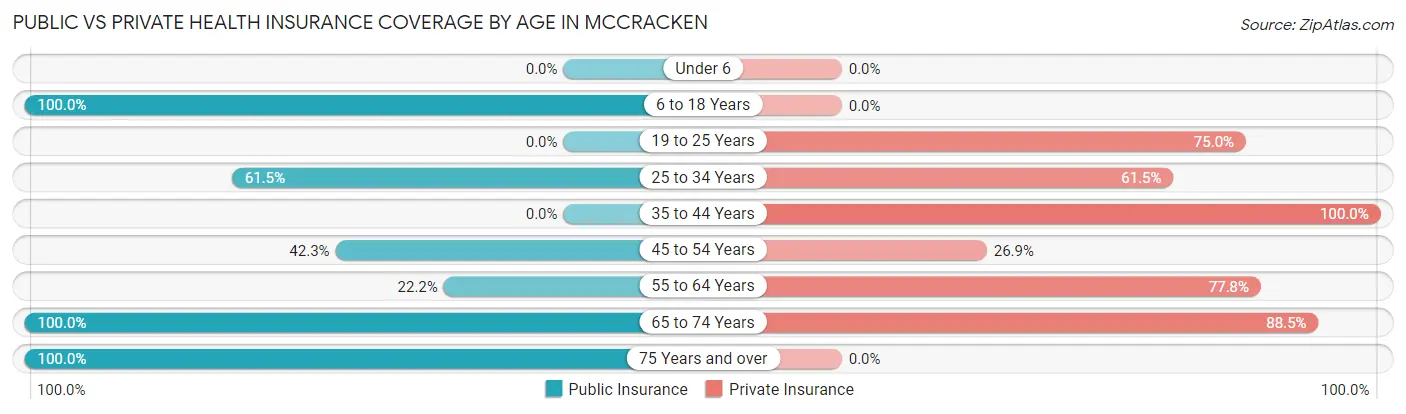
| Age Bracket | Public Insurance | Private Insurance |
| Under 6 | 0 (0.0%) | 0 (0.0%) |
| 6 to 18 Years | 4 (100.0%) | 0 (0.0%) |
| 19 to 25 Years | 0 (0.0%) | 6 (75.0%) |
| 25 to 34 Years | 8 (61.5%) | 8 (61.5%) |
| 35 to 44 Years | 0 (0.0%) | 4 (100.0%) |
| 45 to 54 Years | 11 (42.3%) | 7 (26.9%) |
| 55 to 64 Years | 4 (22.2%) | 14 (77.8%) |
| 65 to 74 Years | 26 (100.0%) | 23 (88.5%) |
| 75 Years and over | 2 (100.0%) | 0 (0.0%) |
| Total | 55 (54.5%) | 62 (61.4%) |
Disability Status by Sex by Age in McCracken
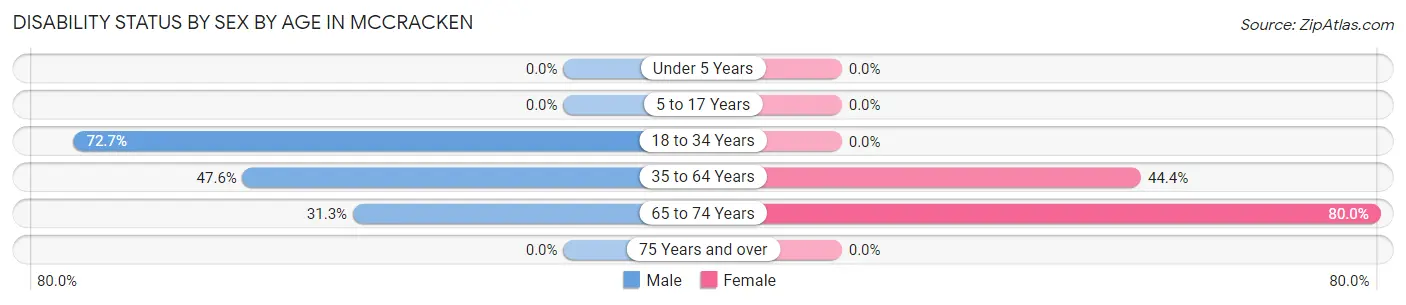
| Age Bracket | Male | Female |
| Under 5 Years | 0 (0.0%) | 0 (0.0%) |
| 5 to 17 Years | 0 (0.0%) | 0 (0.0%) |
| 18 to 34 Years | 8 (72.7%) | 0 (0.0%) |
| 35 to 64 Years | 10 (47.6%) | 12 (44.4%) |
| 65 to 74 Years | 5 (31.2%) | 8 (80.0%) |
| 75 Years and over | 0 (0.0%) | 0 (0.0%) |
Disability Class by Sex by Age in McCracken
Disability Class: Hearing Difficulty
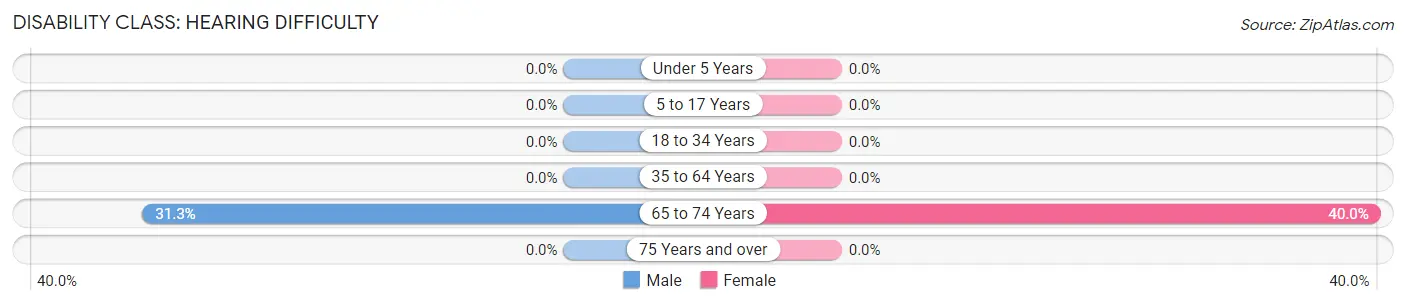
| Age Bracket | Male | Female |
| Under 5 Years | 0 (0.0%) | 0 (0.0%) |
| 5 to 17 Years | 0 (0.0%) | 0 (0.0%) |
| 18 to 34 Years | 0 (0.0%) | 0 (0.0%) |
| 35 to 64 Years | 0 (0.0%) | 0 (0.0%) |
| 65 to 74 Years | 5 (31.2%) | 4 (40.0%) |
| 75 Years and over | 0 (0.0%) | 0 (0.0%) |
Disability Class: Vision Difficulty
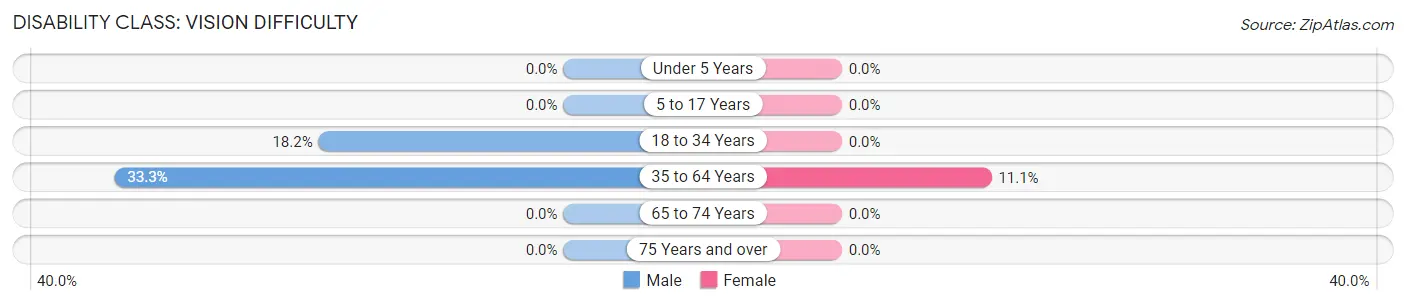
| Age Bracket | Male | Female |
| Under 5 Years | 0 (0.0%) | 0 (0.0%) |
| 5 to 17 Years | 0 (0.0%) | 0 (0.0%) |
| 18 to 34 Years | 2 (18.2%) | 0 (0.0%) |
| 35 to 64 Years | 7 (33.3%) | 3 (11.1%) |
| 65 to 74 Years | 0 (0.0%) | 0 (0.0%) |
| 75 Years and over | 0 (0.0%) | 0 (0.0%) |
Disability Class: Cognitive Difficulty
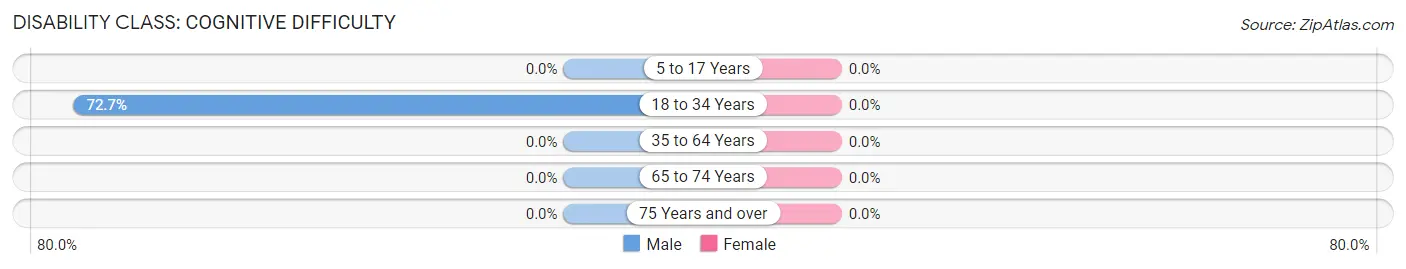
| Age Bracket | Male | Female |
| 5 to 17 Years | 0 (0.0%) | 0 (0.0%) |
| 18 to 34 Years | 8 (72.7%) | 0 (0.0%) |
| 35 to 64 Years | 0 (0.0%) | 0 (0.0%) |
| 65 to 74 Years | 0 (0.0%) | 0 (0.0%) |
| 75 Years and over | 0 (0.0%) | 0 (0.0%) |
Disability Class: Ambulatory Difficulty
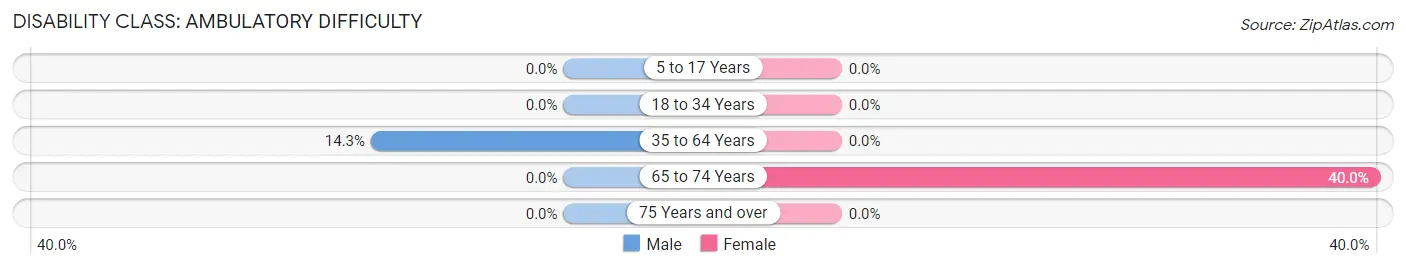
| Age Bracket | Male | Female |
| 5 to 17 Years | 0 (0.0%) | 0 (0.0%) |
| 18 to 34 Years | 0 (0.0%) | 0 (0.0%) |
| 35 to 64 Years | 3 (14.3%) | 0 (0.0%) |
| 65 to 74 Years | 0 (0.0%) | 4 (40.0%) |
| 75 Years and over | 0 (0.0%) | 0 (0.0%) |
Disability Class: Self-Care Difficulty
| Age Bracket | Male | Female |
| 5 to 17 Years | 0 (0.0%) | 0 (0.0%) |
| 18 to 34 Years | 0 (0.0%) | 0 (0.0%) |
| 35 to 64 Years | 0 (0.0%) | 0 (0.0%) |
| 65 to 74 Years | 0 (0.0%) | 0 (0.0%) |
| 75 Years and over | 0 (0.0%) | 0 (0.0%) |
Technology Access in McCracken
Computing Device Access in McCracken
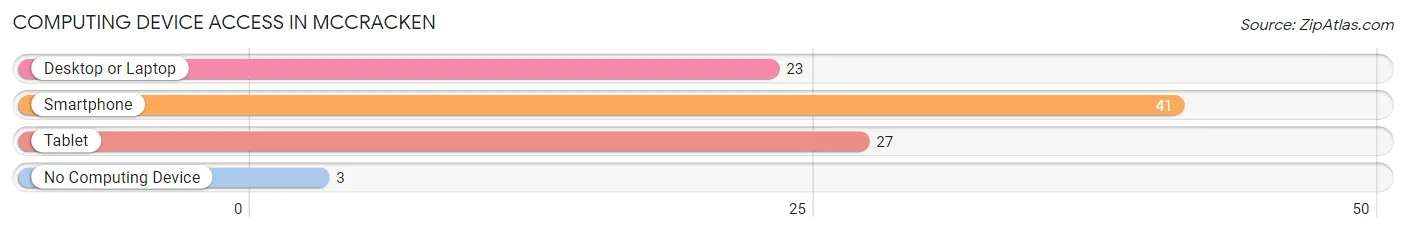
| Device Type | # Households | % Households |
| Desktop or Laptop | 23 | 42.6% |
| Smartphone | 41 | 75.9% |
| Tablet | 27 | 50.0% |
| No Computing Device | 3 | 5.6% |
| Total | 54 | 100.0% |
Internet Access in McCracken
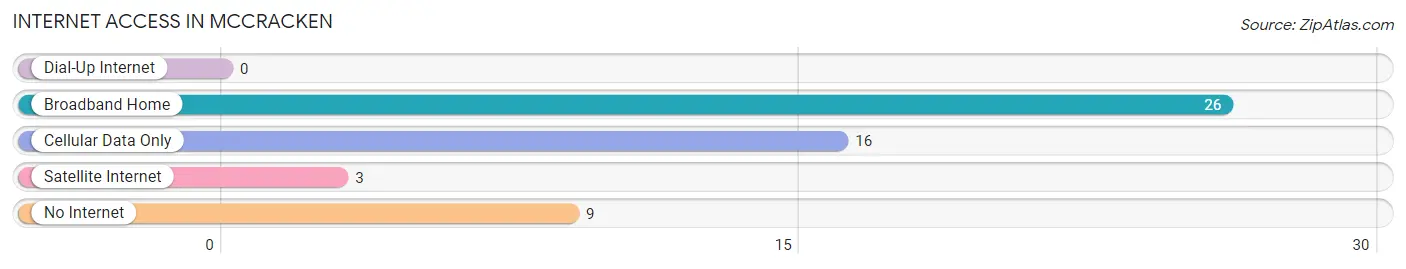
| Internet Type | # Households | % Households |
| Dial-Up Internet | 0 | 0.0% |
| Broadband Home | 26 | 48.1% |
| Cellular Data Only | 16 | 29.6% |
| Satellite Internet | 3 | 5.6% |
| No Internet | 9 | 16.7% |
| Total | 54 | 100.0% |
McCracken Summary
Mccracken, Kansas is a small town located in the western part of the state, in Rush County. It is situated on the banks of the Arkansas River, and is home to a population of just over 200 people. The town was founded in 1887, and was named after the first postmaster, William Mccracken.
Geography
Mccracken is located in the western part of Rush County, Kansas, and is situated on the banks of the Arkansas River. The town is located at an elevation of 1,068 feet above sea level. The town is surrounded by rolling hills and prairies, and is located in the Central Flyway, a major migratory route for birds. The climate in Mccracken is semi-arid, with hot summers and cold winters.
Economy
Mccracken’s economy is largely based on agriculture. The town is home to several farms, which produce a variety of crops, including wheat, corn, soybeans, and sorghum. The town also has a small manufacturing sector, which produces a variety of products, including furniture, clothing, and food products.
Demographics
As of the 2010 census, Mccracken had a population of 209 people. The racial makeup of the town was 97.6% White, 0.5% African American, 0.5% Native American, 0.5% Asian, and 0.9% from two or more races. The median household income in Mccracken was $37,500, and the median family income was $41,250.
History
Mccracken was founded in 1887, and was named after the first postmaster, William Mccracken. The town was originally a farming community, and the first settlers were mostly of German and Irish descent. The town grew slowly, and by the early 1900s, it had a population of around 200 people.
In the early 1900s, the town was home to several businesses, including a general store, a blacksmith shop, and a hotel. The town also had a school, which was built in 1910. The school was later closed in the 1950s, due to declining enrollment.
In the late 1950s, the town was hit hard by a severe drought, which caused many of the farms to fail. This led to a decline in the population, and by the 1970s, the town had a population of just over 100 people.
Today, Mccracken is a small, rural town with a population of just over 200 people. The town is home to several small businesses, including a general store, a cafe, and a gas station. The town also has a post office, and is served by a volunteer fire department.
Mccracken is a quiet, peaceful town, and is a great place to live for those who enjoy the rural lifestyle. The town is surrounded by rolling hills and prairies, and is a great place to enjoy the outdoors. The town is also home to a variety of wildlife, including deer, wild turkeys, and a variety of birds.
Common Questions
What is Per Capita Income in McCracken?
Per Capita income in McCracken is $26,304.
What is the Median Family Income in McCracken?
Median Family Income in McCracken is $43,250.
What is the Median Household income in McCracken?
Median Household Income in McCracken is $41,667.
What is Income or Wage Gap in McCracken?
Income or Wage Gap in McCracken is 42.7%.
Women in McCracken earn 57.3 cents for every dollar earned by a man.
What is Inequality or Gini Index in McCracken?
Inequality or Gini Index in McCracken is 0.35.
What is the Total Population of McCracken?
Total Population of McCracken is 101.
What is the Total Male Population of McCracken?
Total Male Population of McCracken is 53.
What is the Total Female Population of McCracken?
Total Female Population of McCracken is 48.
What is the Ratio of Males per 100 Females in McCracken?
There are 110.42 Males per 100 Females in McCracken.
What is the Ratio of Females per 100 Males in McCracken?
There are 90.57 Females per 100 Males in McCracken.
What is the Median Population Age in McCracken?
Median Population Age in McCracken is 50.9 Years.
What is the Average Family Size in McCracken
Average Family Size in McCracken is 2.6 People.
What is the Average Household Size in McCracken
Average Household Size in McCracken is 1.9 People.
How Large is the Labor Force in McCracken?
There are 46 People in the Labor Forcein in McCracken.
What is the Percentage of People in the Labor Force in McCracken?
47.4% of People are in the Labor Force in McCracken.