Effingham, KS Map & Demographics
Effingham Map
Effingham Overview
$36,998
PER CAPITA INCOME
$76,250
AVG FAMILY INCOME
$60,000
AVG HOUSEHOLD INCOME
22.2%
WAGE / INCOME GAP [ % ]
77.8¢/ $1
WAGE / INCOME GAP [ $ ]
0.33
INEQUALITY / GINI INDEX
609
TOTAL POPULATION
310
MALE POPULATION
299
FEMALE POPULATION
103.68
MALES / 100 FEMALES
96.45
FEMALES / 100 MALES
55.1
MEDIAN AGE
2.9
AVG FAMILY SIZE
2.0
AVG HOUSEHOLD SIZE
339
LABOR FORCE [ PEOPLE ]
61.7%
PERCENT IN LABOR FORCE
0.9%
UNEMPLOYMENT RATE
Effingham Zip Codes
Effingham Area Codes
Income in Effingham
Income Overview in Effingham
Per Capita Income in Effingham is $36,998, while median incomes of families and households are $76,250 and $60,000 respectively.
| Characteristic | Number | Measure |
| Per Capita Income | 609 | $36,998 |
| Median Family Income | 154 | $76,250 |
| Mean Family Income | 154 | $85,314 |
| Median Household Income | 300 | $60,000 |
| Mean Household Income | 300 | $64,772 |
| Income Deficit | 154 | $0 |
| Wage / Income Gap (%) | 609 | 22.16% |
| Wage / Income Gap ($) | 609 | 77.84¢ per $1 |
| Gini / Inequality Index | 609 | 0.33 |
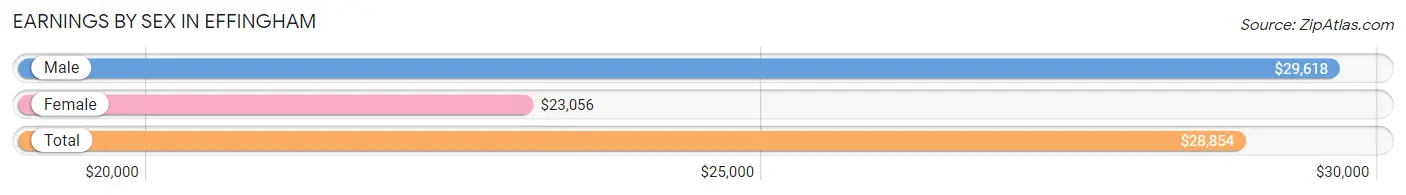
Earnings by Sex in Effingham
Average Earnings in Effingham are $28,854, $29,618 for men and $23,056 for women, a difference of 22.2%.
| Sex | Number | Average Earnings |
| Male | 214 (59.1%) | $29,618 |
| Female | 148 (40.9%) | $23,056 |
| Total | 362 (100.0%) | $28,854 |
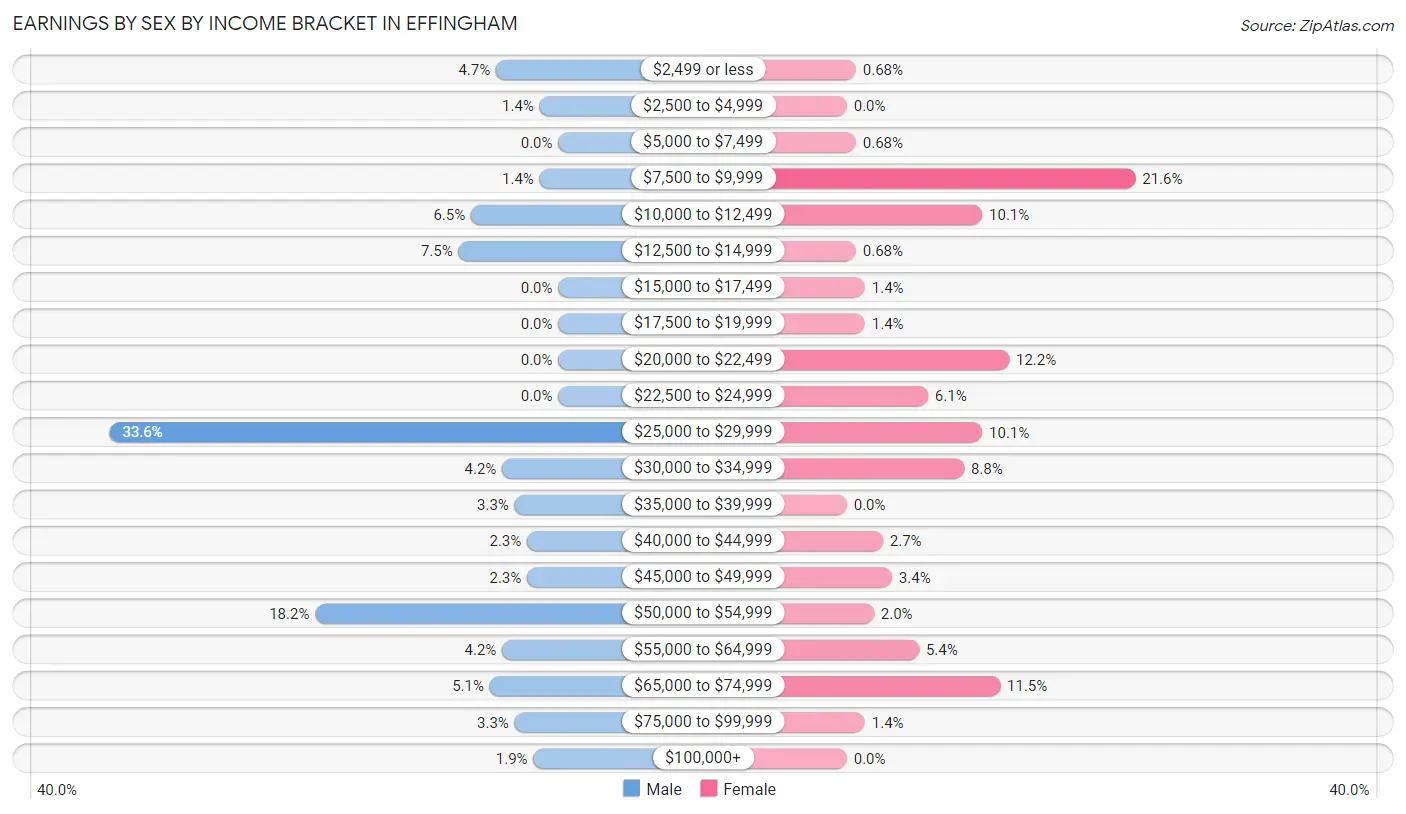
Earnings by Sex by Income Bracket in Effingham
The most common earnings brackets in Effingham are $25,000 to $29,999 for men (72 | 33.6%) and $7,500 to $9,999 for women (32 | 21.6%).
| Income | Male | Female |
| $2,499 or less | 10 (4.7%) | 1 (0.7%) |
| $2,500 to $4,999 | 3 (1.4%) | 0 (0.0%) |
| $5,000 to $7,499 | 0 (0.0%) | 1 (0.7%) |
| $7,500 to $9,999 | 3 (1.4%) | 32 (21.6%) |
| $10,000 to $12,499 | 14 (6.5%) | 15 (10.1%) |
| $12,500 to $14,999 | 16 (7.5%) | 1 (0.7%) |
| $15,000 to $17,499 | 0 (0.0%) | 2 (1.3%) |
| $17,500 to $19,999 | 0 (0.0%) | 2 (1.3%) |
| $20,000 to $22,499 | 0 (0.0%) | 18 (12.2%) |
| $22,500 to $24,999 | 0 (0.0%) | 9 (6.1%) |
| $25,000 to $29,999 | 72 (33.6%) | 15 (10.1%) |
| $30,000 to $34,999 | 9 (4.2%) | 13 (8.8%) |
| $35,000 to $39,999 | 7 (3.3%) | 0 (0.0%) |
| $40,000 to $44,999 | 5 (2.3%) | 4 (2.7%) |
| $45,000 to $49,999 | 5 (2.3%) | 5 (3.4%) |
| $50,000 to $54,999 | 39 (18.2%) | 3 (2.0%) |
| $55,000 to $64,999 | 9 (4.2%) | 8 (5.4%) |
| $65,000 to $74,999 | 11 (5.1%) | 17 (11.5%) |
| $75,000 to $99,999 | 7 (3.3%) | 2 (1.3%) |
| $100,000+ | 4 (1.9%) | 0 (0.0%) |
| Total | 214 (100.0%) | 148 (100.0%) |
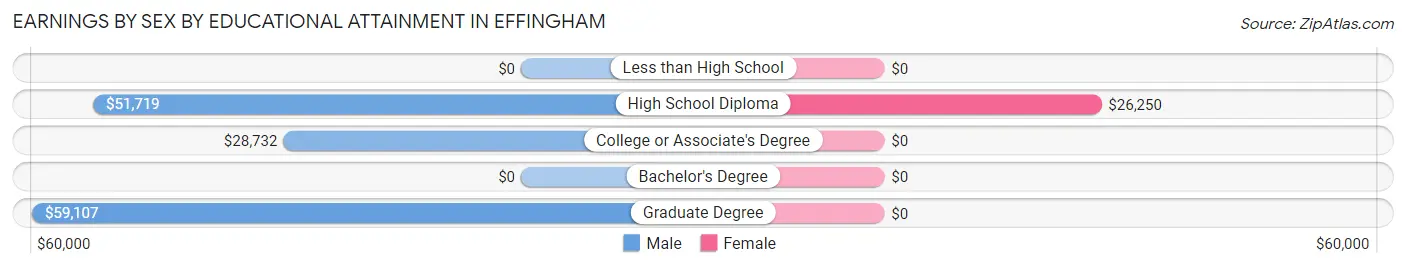
Earnings by Sex by Educational Attainment in Effingham
Average earnings in Effingham are $29,531 for men and $25,917 for women, a difference of 12.2%. Men with an educational attainment of graduate degree enjoy the highest average annual earnings of $59,107, while those with college or associate's degree education earn the least with $28,732. Women with an educational attainment of high school diploma earn the most with the average annual earnings of $26,250, while those with high school diploma education have the smallest earnings of $26,250.
| Educational Attainment | Male Income | Female Income |
| Less than High School | - | - |
| High School Diploma | $51,719 | $26,250 |
| College or Associate's Degree | $28,732 | $0 |
| Bachelor's Degree | - | - |
| Graduate Degree | $59,107 | $0 |
| Total | $29,531 | $25,917 |
Family Income in Effingham
Family Income Brackets in Effingham
According to the Effingham family income data, there are 52 families falling into the $50,000 to $74,999 income range, which is the most common income bracket and makes up 33.8% of all families.
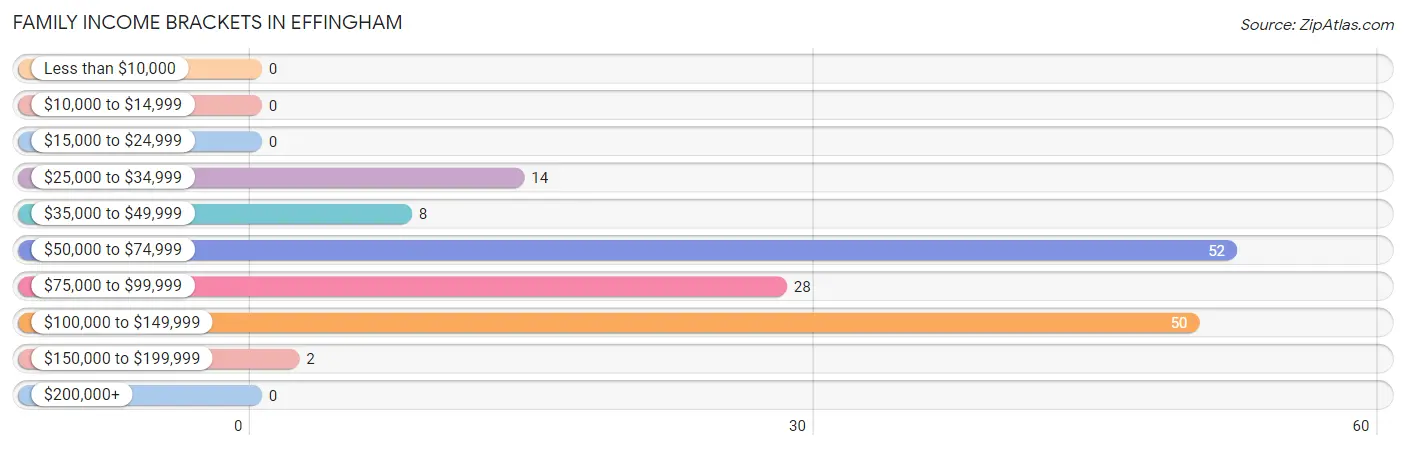
| Income Bracket | # Families | % Families |
| Less than $10,000 | 0 | 0.0% |
| $10,000 to $14,999 | 0 | 0.0% |
| $15,000 to $24,999 | 0 | 0.0% |
| $25,000 to $34,999 | 14 | 9.1% |
| $35,000 to $49,999 | 8 | 5.2% |
| $50,000 to $74,999 | 52 | 33.8% |
| $75,000 to $99,999 | 28 | 18.2% |
| $100,000 to $149,999 | 50 | 32.5% |
| $150,000 to $199,999 | 2 | 1.3% |
| $200,000+ | 0 | 0.0% |
Family Income by Famaliy Size in Effingham
3-person families (55 | 35.7%) account for the highest median family income in Effingham with $115,208 per family, while 2-person families (62 | 40.3%) have the highest median income of $44,792 per family member.
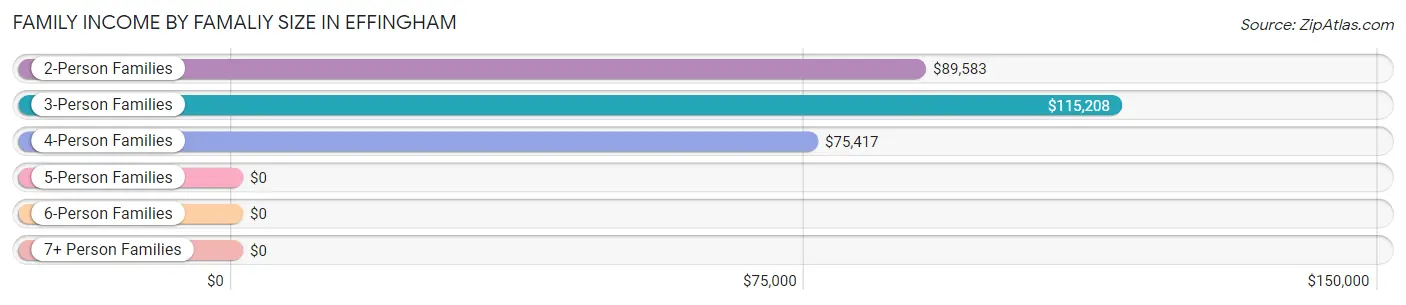
| Income Bracket | # Families | Median Income |
| 2-Person Families | 62 (40.3%) | $89,583 |
| 3-Person Families | 55 (35.7%) | $115,208 |
| 4-Person Families | 22 (14.3%) | $75,417 |
| 5-Person Families | 15 (9.7%) | $0 |
| 6-Person Families | 0 (0.0%) | $0 |
| 7+ Person Families | 0 (0.0%) | $0 |
| Total | 154 (100.0%) | $76,250 |
Family Income by Number of Earners in Effingham
The median family income in Effingham is $76,250, with families comprising 3+ earners (49) having the highest median family income of $115,458, while families with no earners (18) have the lowest median family income of $60,000, accounting for 31.8% and 11.7% of families, respectively.
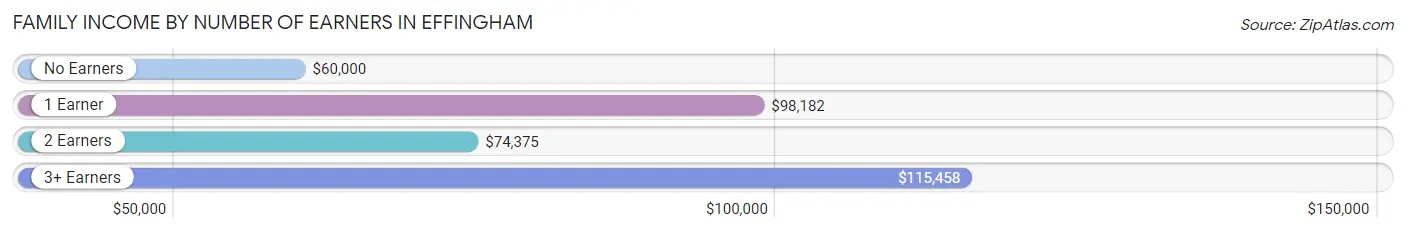
| Number of Earners | # Families | Median Income |
| No Earners | 18 (11.7%) | $60,000 |
| 1 Earner | 28 (18.2%) | $98,182 |
| 2 Earners | 59 (38.3%) | $74,375 |
| 3+ Earners | 49 (31.8%) | $115,458 |
| Total | 154 (100.0%) | $76,250 |
Household Income in Effingham
Household Income Brackets in Effingham
With 80 households falling in the category, the $50,000 to $74,999 income range is the most frequent in Effingham, accounting for 26.7% of all households. In contrast, only 2 households (0.7%) fall into the $150,000 to $199,999 income bracket, making it the least populous group.
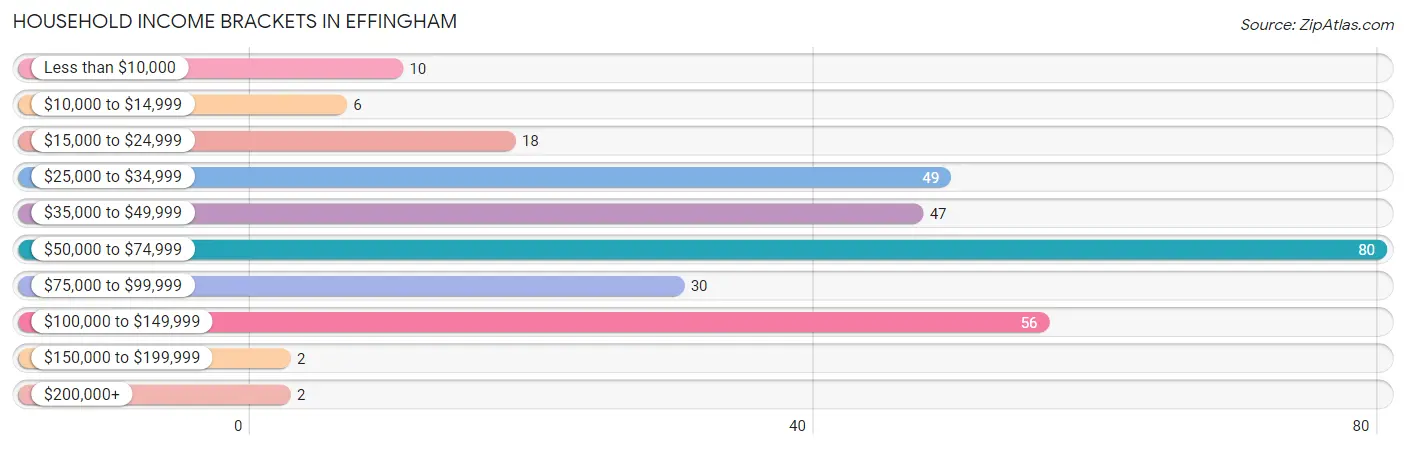
| Income Bracket | # Households | % Households |
| Less than $10,000 | 10 | 3.3% |
| $10,000 to $14,999 | 6 | 2.0% |
| $15,000 to $24,999 | 18 | 6.0% |
| $25,000 to $34,999 | 49 | 16.3% |
| $35,000 to $49,999 | 47 | 15.7% |
| $50,000 to $74,999 | 80 | 26.7% |
| $75,000 to $99,999 | 30 | 10.0% |
| $100,000 to $149,999 | 56 | 18.7% |
| $150,000 to $199,999 | 2 | 0.7% |
| $200,000+ | 2 | 0.7% |
Household Income by Householder Age in Effingham
The median household income in Effingham is $60,000, with the highest median household income of $76,667 found in the 25 to 44 years age bracket for the primary householder. A total of 20 households (6.7%) fall into this category. Meanwhile, the 15 to 24 years age bracket for the primary householder has the lowest median household income of $0, with 15 households (5.0%) in this group.
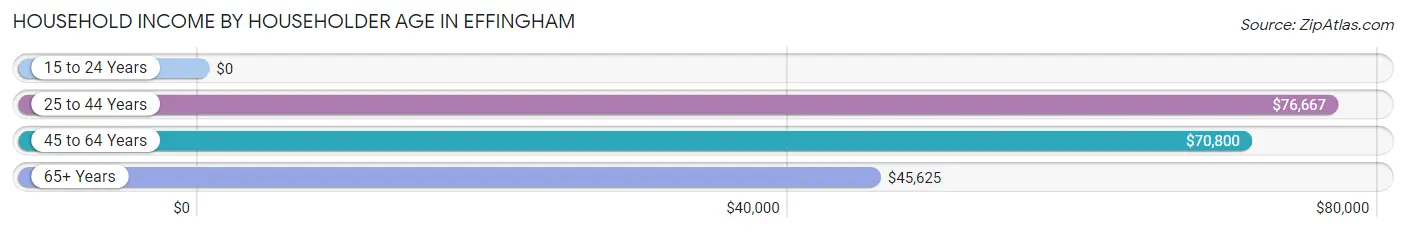
| Income Bracket | # Households | Median Income |
| 15 to 24 Years | 15 (5.0%) | $0 |
| 25 to 44 Years | 20 (6.7%) | $76,667 |
| 45 to 64 Years | 102 (34.0%) | $70,800 |
| 65+ Years | 163 (54.3%) | $45,625 |
| Total | 300 (100.0%) | $60,000 |
Poverty in Effingham
Income Below Poverty by Sex and Age in Effingham
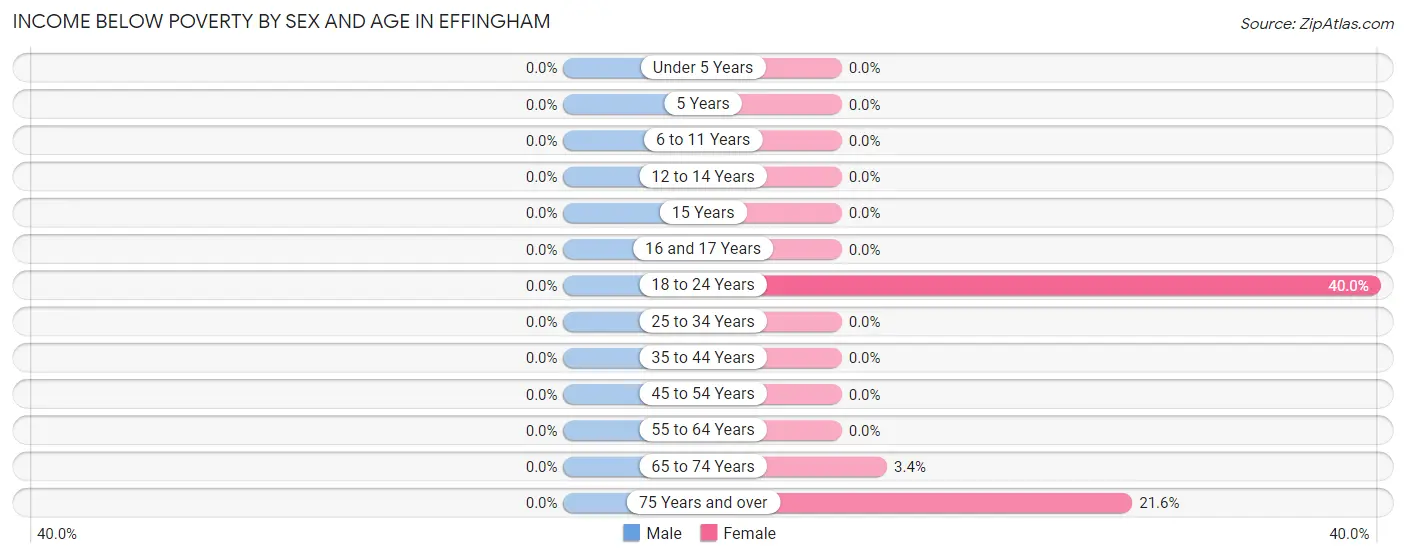
| Age Bracket | Male | Female |
| Under 5 Years | 0 (0.0%) | 0 (0.0%) |
| 5 Years | 0 (0.0%) | 0 (0.0%) |
| 6 to 11 Years | 0 (0.0%) | 0 (0.0%) |
| 12 to 14 Years | 0 (0.0%) | 0 (0.0%) |
| 15 Years | 0 (0.0%) | 0 (0.0%) |
| 16 and 17 Years | 0 (0.0%) | 0 (0.0%) |
| 18 to 24 Years | 0 (0.0%) | 10 (40.0%) |
| 25 to 34 Years | 0 (0.0%) | 0 (0.0%) |
| 35 to 44 Years | 0 (0.0%) | 0 (0.0%) |
| 45 to 54 Years | 0 (0.0%) | 0 (0.0%) |
| 55 to 64 Years | 0 (0.0%) | 0 (0.0%) |
| 65 to 74 Years | 0 (0.0%) | 3 (3.4%) |
| 75 Years and over | 0 (0.0%) | 11 (21.6%) |
| Total | 0 (0.0%) | 24 (8.0%) |
Income Above Poverty by Sex and Age in Effingham
According to the poverty statistics in Effingham, males aged under 5 years and females aged under 5 years are the age groups that are most secure financially, with 100.0% of males and 100.0% of females in these age groups living above the poverty line.
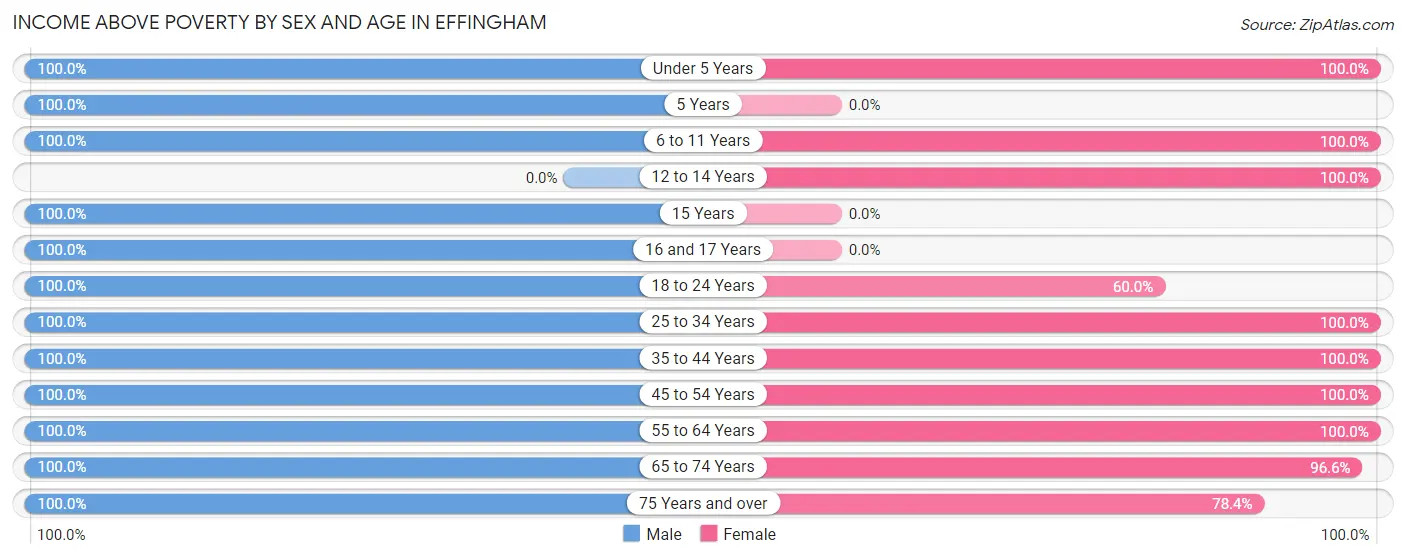
| Age Bracket | Male | Female |
| Under 5 Years | 14 (100.0%) | 10 (100.0%) |
| 5 Years | 10 (100.0%) | 0 (0.0%) |
| 6 to 11 Years | 6 (100.0%) | 2 (100.0%) |
| 12 to 14 Years | 0 (0.0%) | 8 (100.0%) |
| 15 Years | 10 (100.0%) | 0 (0.0%) |
| 16 and 17 Years | 3 (100.0%) | 0 (0.0%) |
| 18 to 24 Years | 16 (100.0%) | 15 (60.0%) |
| 25 to 34 Years | 28 (100.0%) | 13 (100.0%) |
| 35 to 44 Years | 17 (100.0%) | 7 (100.0%) |
| 45 to 54 Years | 67 (100.0%) | 68 (100.0%) |
| 55 to 64 Years | 26 (100.0%) | 26 (100.0%) |
| 65 to 74 Years | 99 (100.0%) | 86 (96.6%) |
| 75 Years and over | 14 (100.0%) | 40 (78.4%) |
| Total | 310 (100.0%) | 275 (92.0%) |
Income Below Poverty Among Married-Couple Families in Effingham
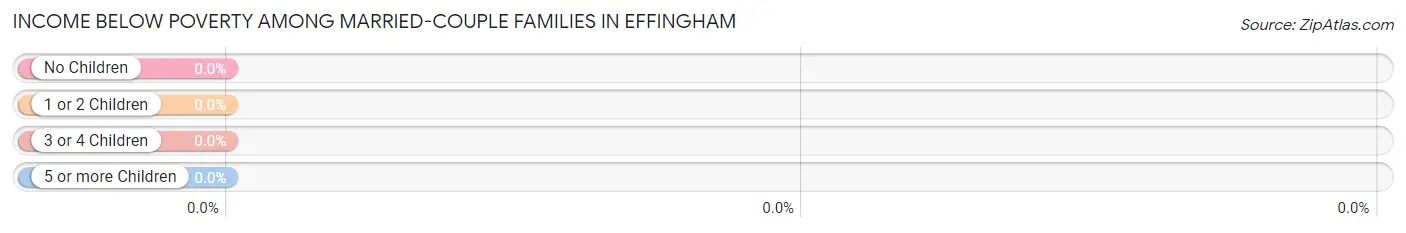
| Children | Above Poverty | Below Poverty |
| No Children | 103 (100.0%) | 0 (0.0%) |
| 1 or 2 Children | 16 (100.0%) | 0 (0.0%) |
| 3 or 4 Children | 15 (100.0%) | 0 (0.0%) |
| 5 or more Children | 0 (0.0%) | 0 (0.0%) |
| Total | 134 (100.0%) | 0 (0.0%) |
Income Below Poverty Among Single-Parent Households in Effingham
| Children | Single Father | Single Mother |
| No Children | 0 (0.0%) | 0 (0.0%) |
| 1 or 2 Children | 0 (0.0%) | 0 (0.0%) |
| 3 or 4 Children | 0 (0.0%) | 0 (0.0%) |
| 5 or more Children | 0 (0.0%) | 0 (0.0%) |
| Total | 0 (0.0%) | 0 (0.0%) |
Income Below Poverty Among Married-Couple vs Single-Parent Households in Effingham
| Children | Married-Couple Families | Single-Parent Households |
| No Children | 0 (0.0%) | 0 (0.0%) |
| 1 or 2 Children | 0 (0.0%) | 0 (0.0%) |
| 3 or 4 Children | 0 (0.0%) | 0 (0.0%) |
| 5 or more Children | 0 (0.0%) | 0 (0.0%) |
| Total | 0 (0.0%) | 0 (0.0%) |
Race in Effingham
The most populous races in Effingham are White / Caucasian (603 | 99.0%), Hispanic or Latino (7 | 1.1%), and Two or more Races (6 | 1.0%).
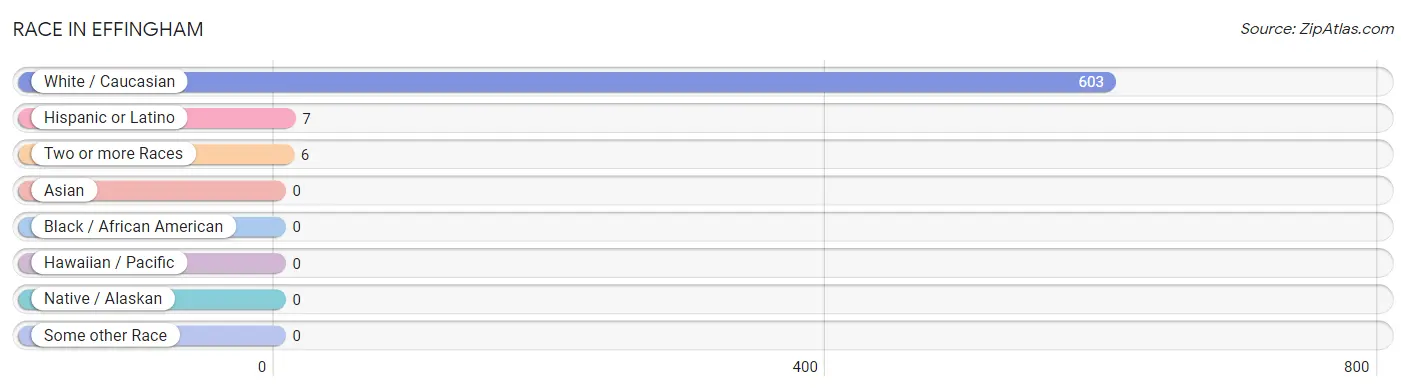
| Race | # Population | % Population |
| Asian | 0 | 0.0% |
| Black / African American | 0 | 0.0% |
| Hawaiian / Pacific | 0 | 0.0% |
| Hispanic or Latino | 7 | 1.1% |
| Native / Alaskan | 0 | 0.0% |
| White / Caucasian | 603 | 99.0% |
| Two or more Races | 6 | 1.0% |
| Some other Race | 0 | 0.0% |
| Total | 609 | 100.0% |
Ancestry in Effingham
The most populous ancestries reported in Effingham are German (220 | 36.1%), Irish (104 | 17.1%), English (74 | 12.1%), French (70 | 11.5%), and Swiss (70 | 11.5%), together accounting for 88.3% of all Effingham residents.
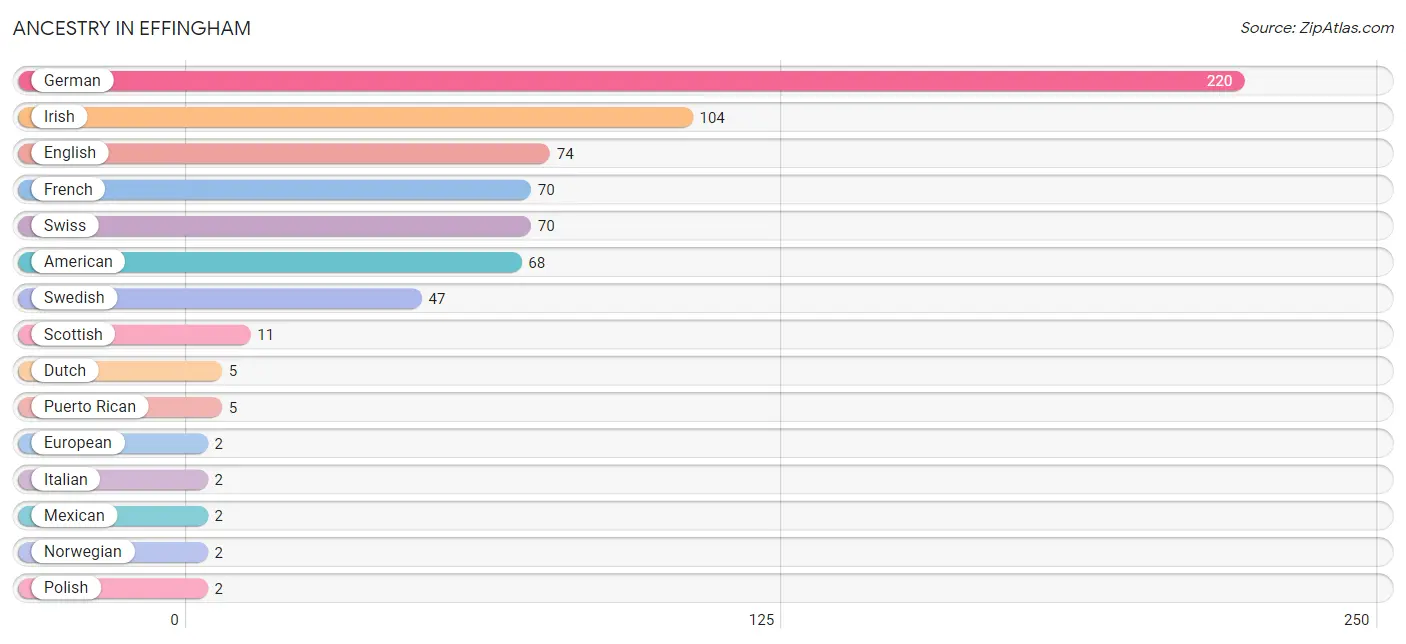
| Ancestry | # Population | % Population |
| American | 68 | 11.2% |
| Cherokee | 1 | 0.2% |
| Dutch | 5 | 0.8% |
| English | 74 | 12.1% |
| European | 2 | 0.3% |
| French | 70 | 11.5% |
| German | 220 | 36.1% |
| Irish | 104 | 17.1% |
| Italian | 2 | 0.3% |
| Mexican | 2 | 0.3% |
| Norwegian | 2 | 0.3% |
| Polish | 2 | 0.3% |
| Puerto Rican | 5 | 0.8% |
| Scottish | 11 | 1.8% |
| Swedish | 47 | 7.7% |
| Swiss | 70 | 11.5% | View All 16 Rows |
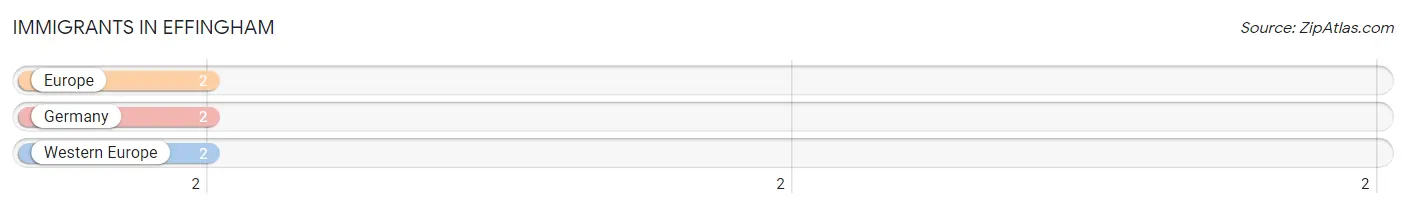
Immigrants in Effingham
The most numerous immigrant groups reported in Effingham came from Europe (2 | 0.3%), Germany (2 | 0.3%), and Western Europe (2 | 0.3%), together accounting for 1.0% of all Effingham residents.
| Immigration Origin | # Population | % Population |
| Europe | 2 | 0.3% |
| Germany | 2 | 0.3% |
| Western Europe | 2 | 0.3% | View All 3 Rows |
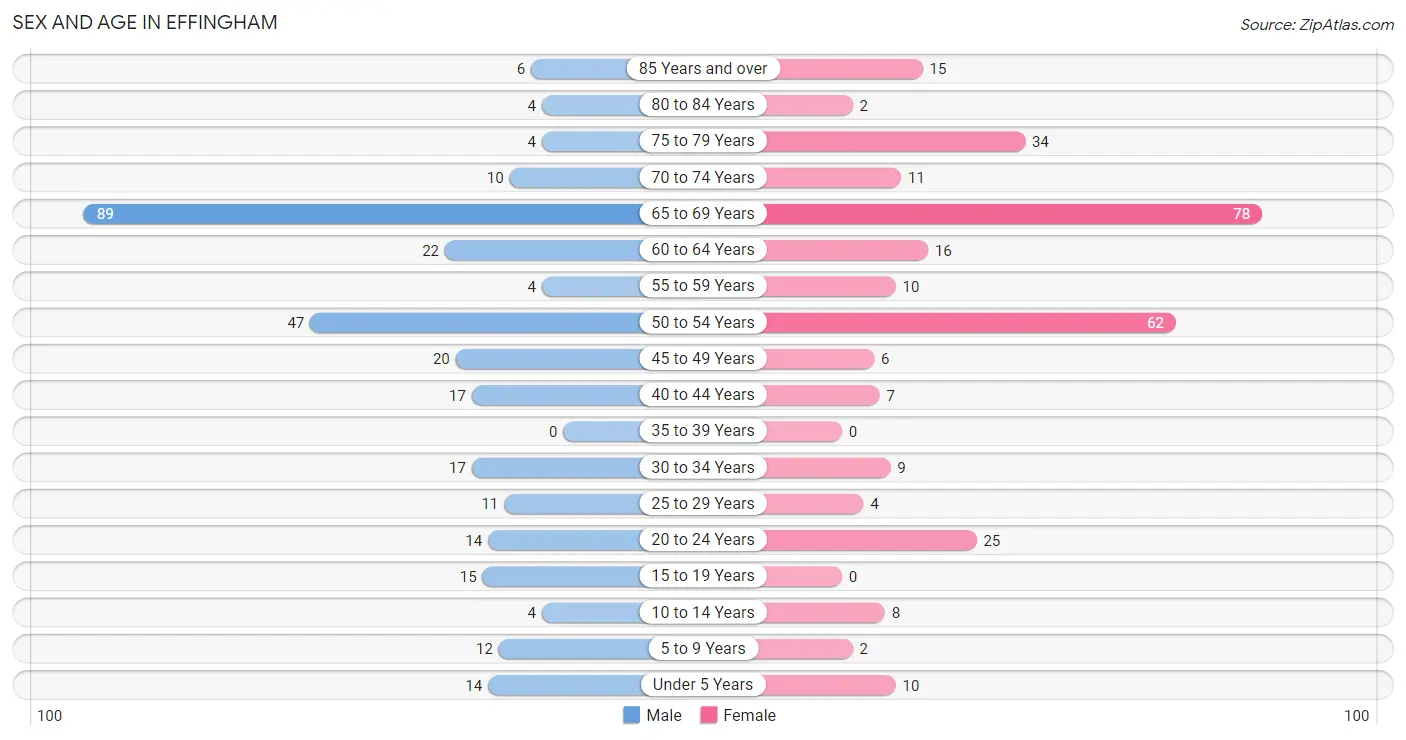
Sex and Age in Effingham
Sex and Age in Effingham
The most populous age groups in Effingham are 65 to 69 Years (89 | 28.7%) for men and 65 to 69 Years (78 | 26.1%) for women.
| Age Bracket | Male | Female |
| Under 5 Years | 14 (4.5%) | 10 (3.3%) |
| 5 to 9 Years | 12 (3.9%) | 2 (0.7%) |
| 10 to 14 Years | 4 (1.3%) | 8 (2.7%) |
| 15 to 19 Years | 15 (4.8%) | 0 (0.0%) |
| 20 to 24 Years | 14 (4.5%) | 25 (8.4%) |
| 25 to 29 Years | 11 (3.5%) | 4 (1.3%) |
| 30 to 34 Years | 17 (5.5%) | 9 (3.0%) |
| 35 to 39 Years | 0 (0.0%) | 0 (0.0%) |
| 40 to 44 Years | 17 (5.5%) | 7 (2.3%) |
| 45 to 49 Years | 20 (6.5%) | 6 (2.0%) |
| 50 to 54 Years | 47 (15.2%) | 62 (20.7%) |
| 55 to 59 Years | 4 (1.3%) | 10 (3.3%) |
| 60 to 64 Years | 22 (7.1%) | 16 (5.3%) |
| 65 to 69 Years | 89 (28.7%) | 78 (26.1%) |
| 70 to 74 Years | 10 (3.2%) | 11 (3.7%) |
| 75 to 79 Years | 4 (1.3%) | 34 (11.4%) |
| 80 to 84 Years | 4 (1.3%) | 2 (0.7%) |
| 85 Years and over | 6 (1.9%) | 15 (5.0%) |
| Total | 310 (100.0%) | 299 (100.0%) |
Families and Households in Effingham
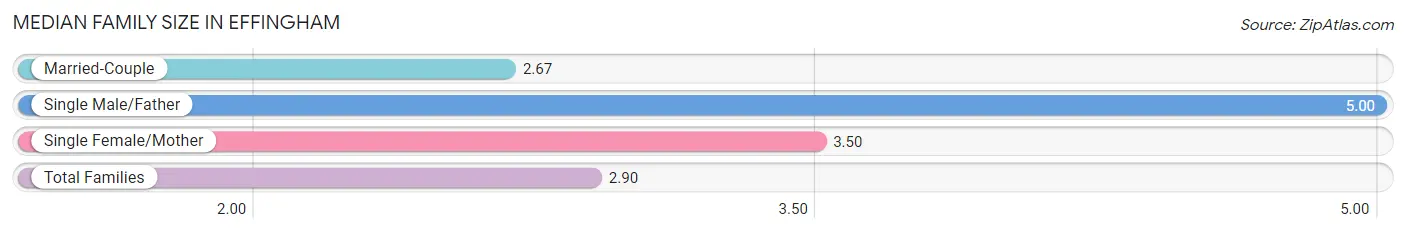
Median Family Size in Effingham
The median family size in Effingham is 2.90 persons per family, with single male/father families (12 | 7.8%) accounting for the largest median family size of 5 persons per family. On the other hand, married-couple families (134 | 87.0%) represent the smallest median family size with 2.67 persons per family.
| Family Type | # Families | Family Size |
| Married-Couple | 134 (87.0%) | 2.67 |
| Single Male/Father | 12 (7.8%) | 5.00 |
| Single Female/Mother | 8 (5.2%) | 3.50 |
| Total Families | 154 (100.0%) | 2.90 |
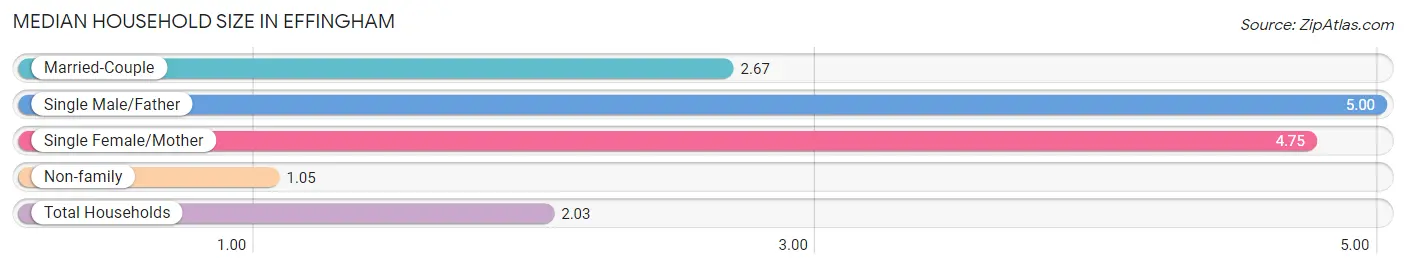
Median Household Size in Effingham
The median household size in Effingham is 2.03 persons per household, with single male/father households (12 | 4.0%) accounting for the largest median household size of 5 persons per household. non-family households (146 | 48.7%) represent the smallest median household size with 1.05 persons per household.
| Household Type | # Households | Household Size |
| Married-Couple | 134 (44.7%) | 2.67 |
| Single Male/Father | 12 (4.0%) | 5.00 |
| Single Female/Mother | 8 (2.7%) | 4.75 |
| Non-family | 146 (48.7%) | 1.05 |
| Total Households | 300 (100.0%) | 2.03 |
Household Size by Marriage Status in Effingham
Out of a total of 300 households in Effingham, 154 (51.3%) are family households, while 146 (48.7%) are nonfamily households. The most numerous type of family households are 2-person households, comprising 62, and the most common type of nonfamily households are 1-person households, comprising 145.
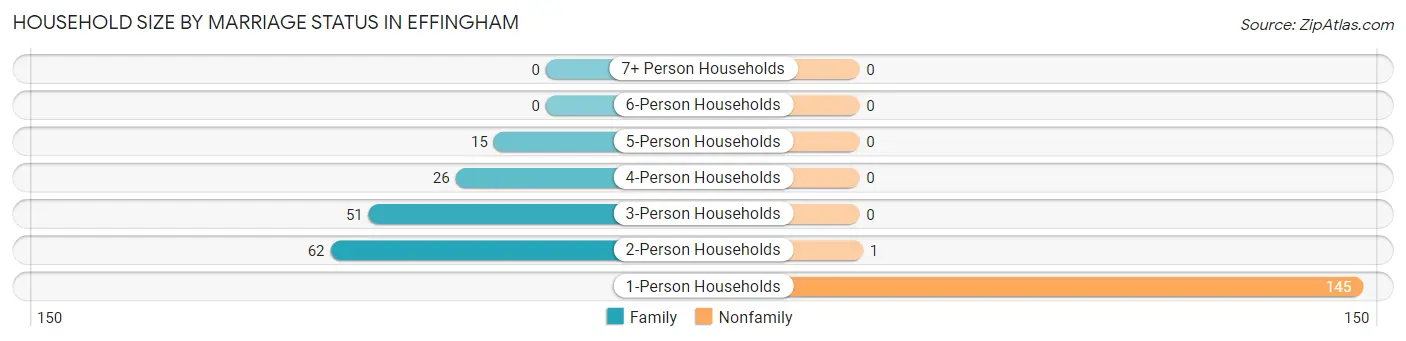
| Household Size | Family Households | Nonfamily Households |
| 1-Person Households | - | 145 (48.3%) |
| 2-Person Households | 62 (20.7%) | 1 (0.3%) |
| 3-Person Households | 51 (17.0%) | 0 (0.0%) |
| 4-Person Households | 26 (8.7%) | 0 (0.0%) |
| 5-Person Households | 15 (5.0%) | 0 (0.0%) |
| 6-Person Households | 0 (0.0%) | 0 (0.0%) |
| 7+ Person Households | 0 (0.0%) | 0 (0.0%) |
| Total | 154 (51.3%) | 146 (48.7%) |
Female Fertility in Effingham
Fertility by Age in Effingham
Average fertility rate in Effingham is 278.0 births per 1,000 women. Women in the age bracket of 20 to 34 years have the highest fertility rate with 395.0 births per 1,000 women. Women in the age bracket of 20 to 34 years acount for 100.0% of all women with births.
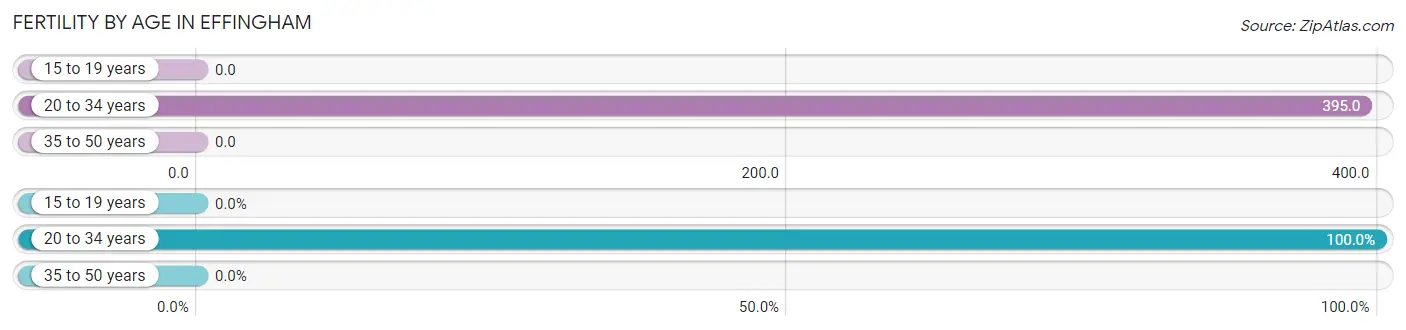
| Age Bracket | Women with Births | Births / 1,000 Women |
| 15 to 19 years | 0 (0.0%) | 0.0 |
| 20 to 34 years | 15 (100.0%) | 395.0 |
| 35 to 50 years | 0 (0.0%) | 0.0 |
| Total | 15 (100.0%) | 278.0 |
Fertility by Age by Marriage Status in Effingham
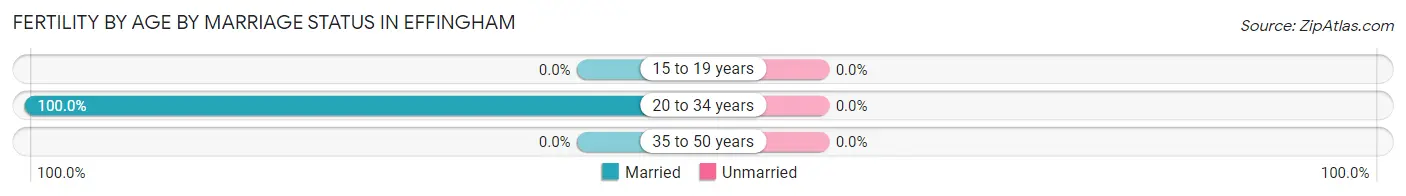
| Age Bracket | Married | Unmarried |
| 15 to 19 years | 0 (0.0%) | 0 (0.0%) |
| 20 to 34 years | 15 (100.0%) | 0 (0.0%) |
| 35 to 50 years | 0 (0.0%) | 0 (0.0%) |
| Total | 15 (100.0%) | 0 (0.0%) |
Fertility by Education in Effingham
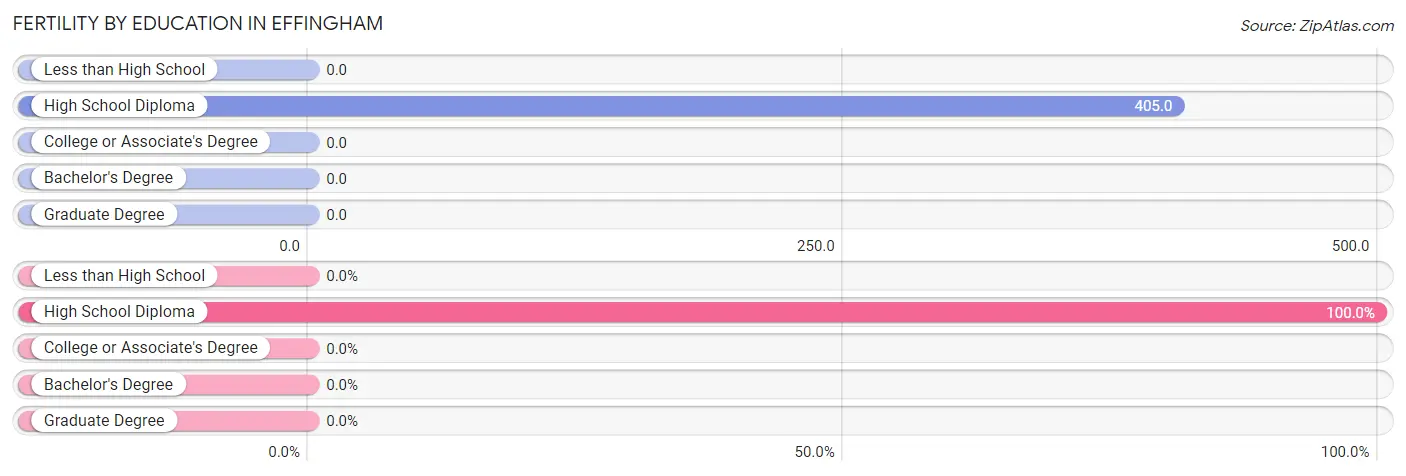
| Educational Attainment | Women with Births | Births / 1,000 Women |
| Less than High School | 0 (0.0%) | 0.0 |
| High School Diploma | 15 (100.0%) | 405.0 |
| College or Associate's Degree | 0 (0.0%) | 0.0 |
| Bachelor's Degree | 0 (0.0%) | 0.0 |
| Graduate Degree | 0 (0.0%) | 0.0 |
| Total | 15 (100.0%) | 278.0 |
Fertility by Education by Marriage Status in Effingham
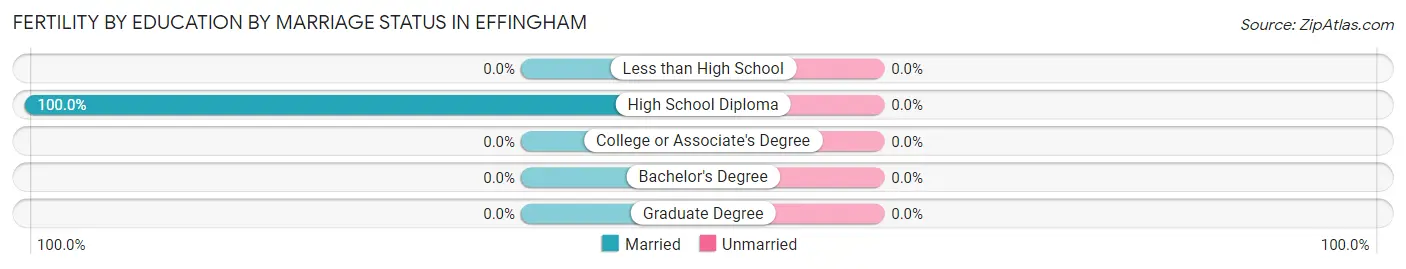
| Educational Attainment | Married | Unmarried |
| Less than High School | 0 (0.0%) | 0 (0.0%) |
| High School Diploma | 15 (100.0%) | 0 (0.0%) |
| College or Associate's Degree | 0 (0.0%) | 0 (0.0%) |
| Bachelor's Degree | 0 (0.0%) | 0 (0.0%) |
| Graduate Degree | 0 (0.0%) | 0 (0.0%) |
| Total | 15 (100.0%) | 0 (0.0%) |
Employment Characteristics in Effingham
Employment by Class of Employer in Effingham
Among the 334 employed individuals in Effingham, private company employees (216 | 64.7%), local government employees (44 | 13.2%), and self-employed (not incorporated) (30 | 9.0%) make up the most common classes of employment.
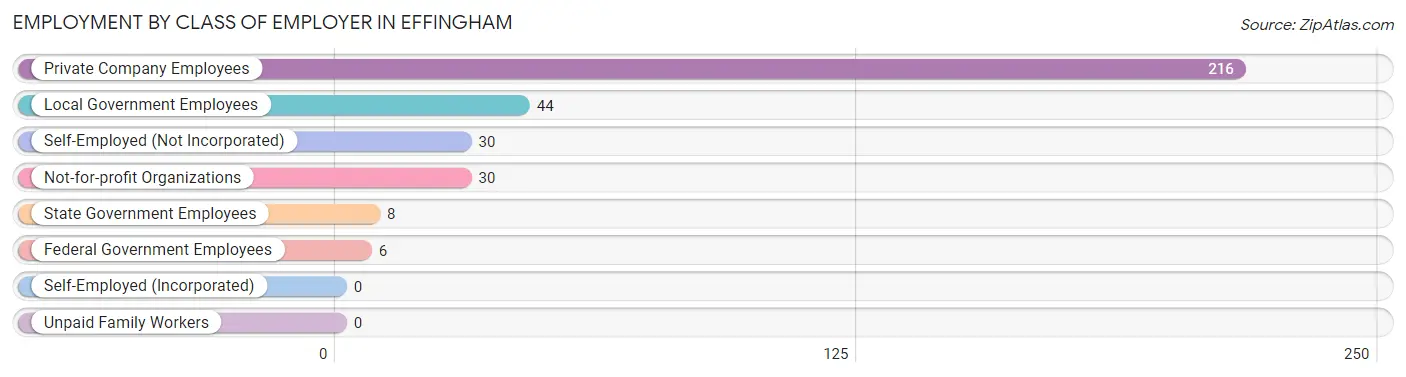
| Employer Class | # Employees | % Employees |
| Private Company Employees | 216 | 64.7% |
| Self-Employed (Incorporated) | 0 | 0.0% |
| Self-Employed (Not Incorporated) | 30 | 9.0% |
| Not-for-profit Organizations | 30 | 9.0% |
| Local Government Employees | 44 | 13.2% |
| State Government Employees | 8 | 2.4% |
| Federal Government Employees | 6 | 1.8% |
| Unpaid Family Workers | 0 | 0.0% |
| Total | 334 | 100.0% |
Employment Status by Age in Effingham
According to the labor force statistics for Effingham, out of the total population over 16 years of age (549), 61.7% or 339 individuals are in the labor force, with 0.9% or 3 of them unemployed. The age group with the highest labor force participation rate is 20 to 24 years, with 100.0% or 39 individuals in the labor force. Within the labor force, the 35 to 44 years age range has the highest percentage of unemployed individuals, with 5.9% or 1 of them being unemployed.
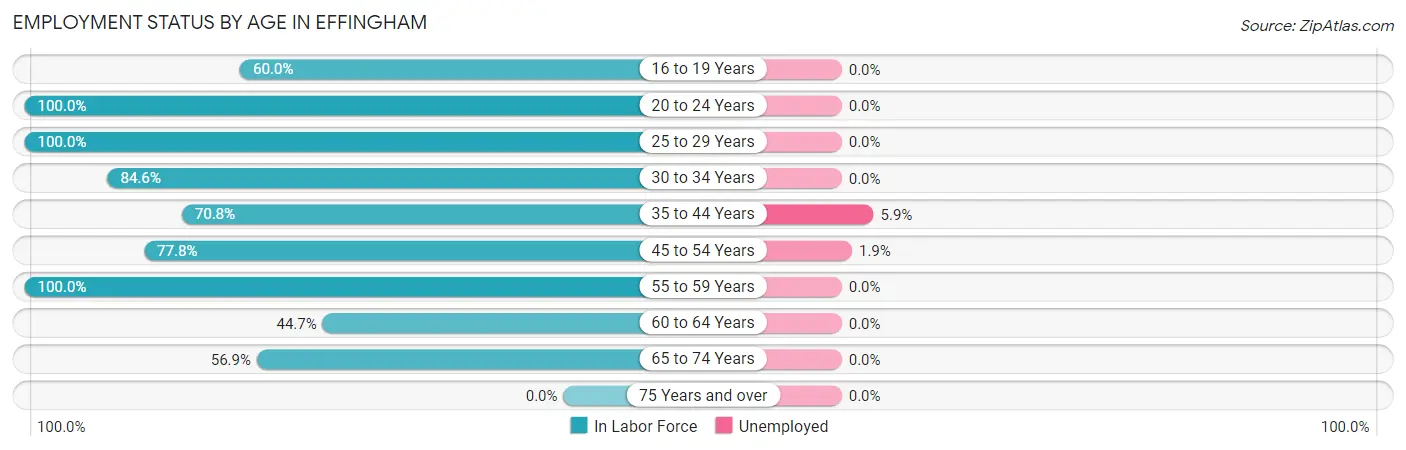
| Age Bracket | In Labor Force | Unemployed |
| 16 to 19 Years | 3 (60.0%) | 0 (0.0%) |
| 20 to 24 Years | 39 (100.0%) | 0 (0.0%) |
| 25 to 29 Years | 15 (100.0%) | 0 (0.0%) |
| 30 to 34 Years | 22 (84.6%) | 0 (0.0%) |
| 35 to 44 Years | 17 (70.8%) | 1 (5.9%) |
| 45 to 54 Years | 105 (77.8%) | 2 (1.9%) |
| 55 to 59 Years | 14 (100.0%) | 0 (0.0%) |
| 60 to 64 Years | 17 (44.7%) | 0 (0.0%) |
| 65 to 74 Years | 107 (56.9%) | 0 (0.0%) |
| 75 Years and over | 0 (0.0%) | 0 (0.0%) |
| Total | 339 (61.7%) | 3 (0.9%) |
Employment Status by Educational Attainment in Effingham
According to labor force statistics for Effingham, 75.4% of individuals (190) out of the total population between 25 and 64 years of age (252) are in the labor force, with 1.6% or 3 of them being unemployed. The group with the highest labor force participation rate are those with the educational attainment of bachelor's degree or higher, with 100.0% or 17 individuals in the labor force. Within the labor force, individuals with bachelor's degree or higher education have the highest percentage of unemployment, with 5.9% or 1 of them being unemployed.
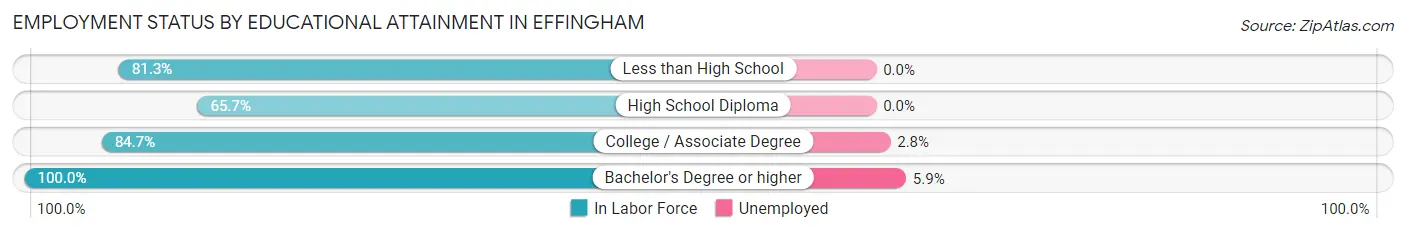
| Educational Attainment | In Labor Force | Unemployed |
| Less than High School | 13 (81.3%) | 0 (0.0%) |
| High School Diploma | 88 (65.7%) | 0 (0.0%) |
| College / Associate Degree | 72 (84.7%) | 2 (2.8%) |
| Bachelor's Degree or higher | 17 (100.0%) | 1 (5.9%) |
| Total | 190 (75.4%) | 4 (1.6%) |
Employment Occupations by Sex in Effingham
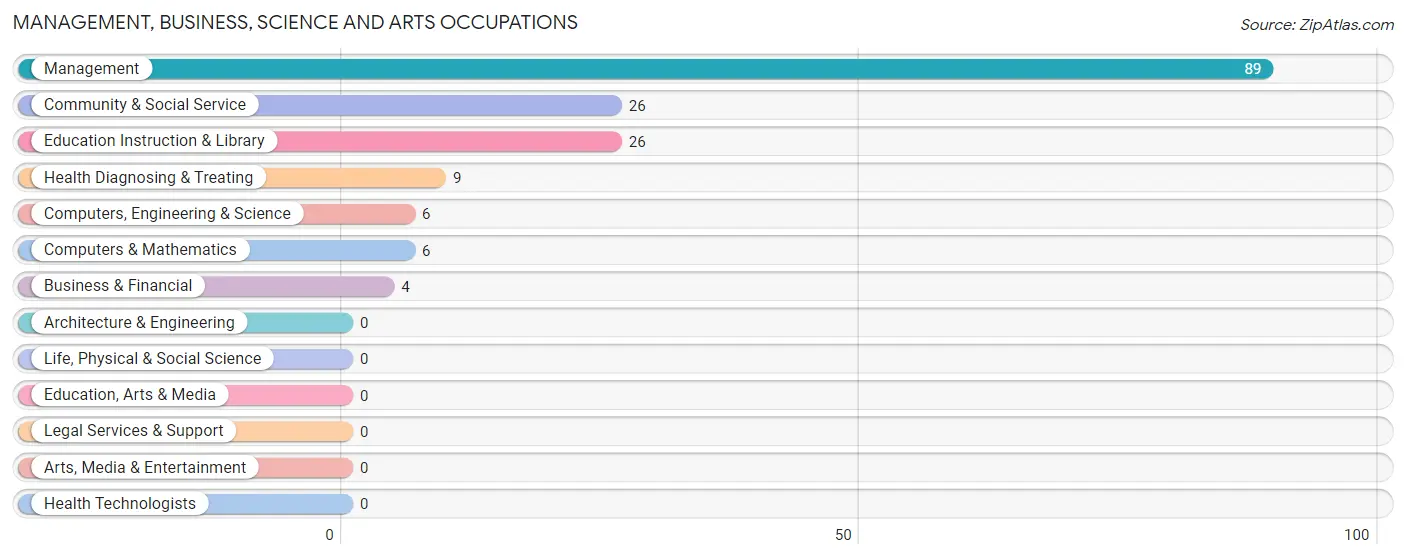
Management, Business, Science and Arts Occupations
The most common Management, Business, Science and Arts occupations in Effingham are Management (89 | 26.5%), Community & Social Service (26 | 7.7%), Education Instruction & Library (26 | 7.7%), Health Diagnosing & Treating (9 | 2.7%), and Computers, Engineering & Science (6 | 1.8%).
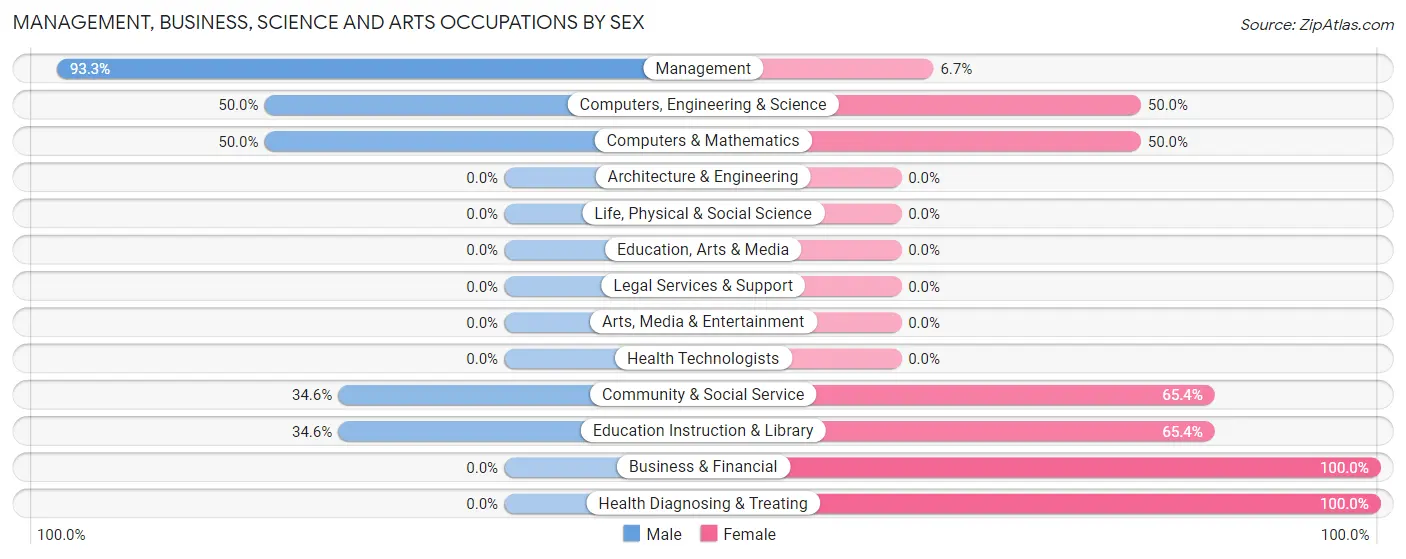
Management, Business, Science and Arts Occupations by Sex
Within the Management, Business, Science and Arts occupations in Effingham, the most male-oriented occupations are Management (93.3%), Computers, Engineering & Science (50.0%), and Computers & Mathematics (50.0%), while the most female-oriented occupations are Business & Financial (100.0%), Health Diagnosing & Treating (100.0%), and Community & Social Service (65.4%).
| Occupation | Male | Female |
| Management | 83 (93.3%) | 6 (6.7%) |
| Business & Financial | 0 (0.0%) | 4 (100.0%) |
| Computers, Engineering & Science | 3 (50.0%) | 3 (50.0%) |
| Computers & Mathematics | 3 (50.0%) | 3 (50.0%) |
| Architecture & Engineering | 0 (0.0%) | 0 (0.0%) |
| Life, Physical & Social Science | 0 (0.0%) | 0 (0.0%) |
| Community & Social Service | 9 (34.6%) | 17 (65.4%) |
| Education, Arts & Media | 0 (0.0%) | 0 (0.0%) |
| Legal Services & Support | 0 (0.0%) | 0 (0.0%) |
| Education Instruction & Library | 9 (34.6%) | 17 (65.4%) |
| Arts, Media & Entertainment | 0 (0.0%) | 0 (0.0%) |
| Health Diagnosing & Treating | 0 (0.0%) | 9 (100.0%) |
| Health Technologists | 0 (0.0%) | 0 (0.0%) |
| Total (Category) | 95 (70.9%) | 39 (29.1%) |
| Total (Overall) | 197 (58.6%) | 139 (41.4%) |
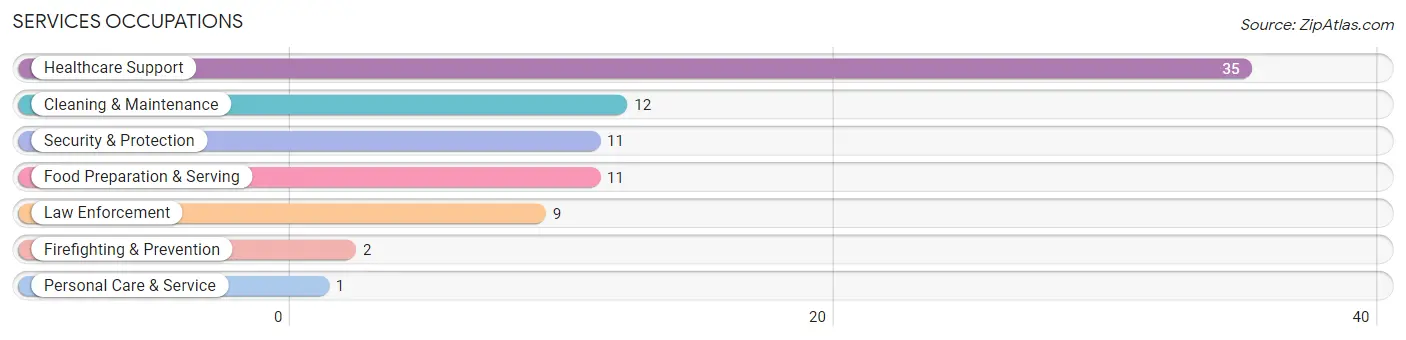
Services Occupations
The most common Services occupations in Effingham are Healthcare Support (35 | 10.4%), Cleaning & Maintenance (12 | 3.6%), Security & Protection (11 | 3.3%), Food Preparation & Serving (11 | 3.3%), and Law Enforcement (9 | 2.7%).
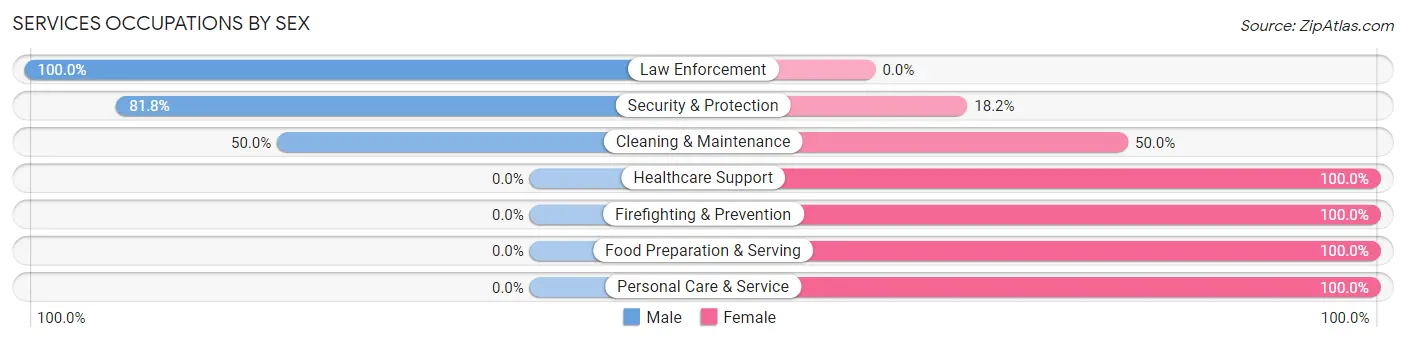
Services Occupations by Sex
Within the Services occupations in Effingham, the most male-oriented occupations are Law Enforcement (100.0%), Security & Protection (81.8%), and Cleaning & Maintenance (50.0%), while the most female-oriented occupations are Healthcare Support (100.0%), Firefighting & Prevention (100.0%), and Food Preparation & Serving (100.0%).
| Occupation | Male | Female |
| Healthcare Support | 0 (0.0%) | 35 (100.0%) |
| Security & Protection | 9 (81.8%) | 2 (18.2%) |
| Firefighting & Prevention | 0 (0.0%) | 2 (100.0%) |
| Law Enforcement | 9 (100.0%) | 0 (0.0%) |
| Food Preparation & Serving | 0 (0.0%) | 11 (100.0%) |
| Cleaning & Maintenance | 6 (50.0%) | 6 (50.0%) |
| Personal Care & Service | 0 (0.0%) | 1 (100.0%) |
| Total (Category) | 15 (21.4%) | 55 (78.6%) |
| Total (Overall) | 197 (58.6%) | 139 (41.4%) |
Sales and Office Occupations
The most common Sales and Office occupations in Effingham are Office & Administration (58 | 17.3%), and Sales & Related (30 | 8.9%).
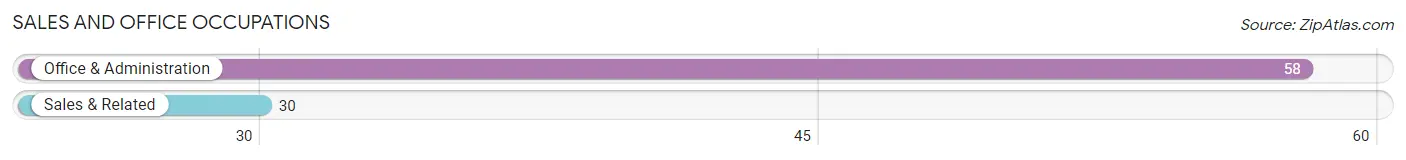
Sales and Office Occupations by Sex
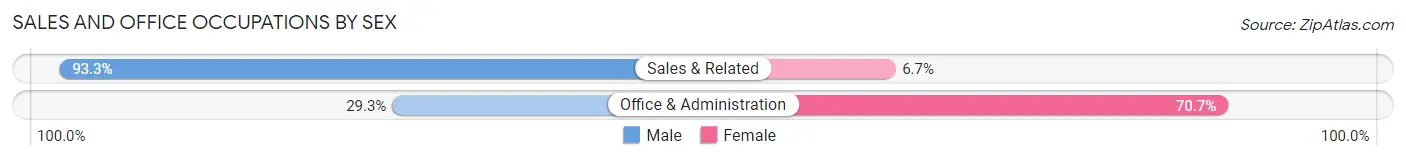
| Occupation | Male | Female |
| Sales & Related | 28 (93.3%) | 2 (6.7%) |
| Office & Administration | 17 (29.3%) | 41 (70.7%) |
| Total (Category) | 45 (51.1%) | 43 (48.9%) |
| Total (Overall) | 197 (58.6%) | 139 (41.4%) |
Natural Resources, Construction and Maintenance Occupations
The most common Natural Resources, Construction and Maintenance occupations in Effingham are Construction & Extraction (20 | 5.9%), and Farming, Fishing & Forestry (2 | 0.6%).
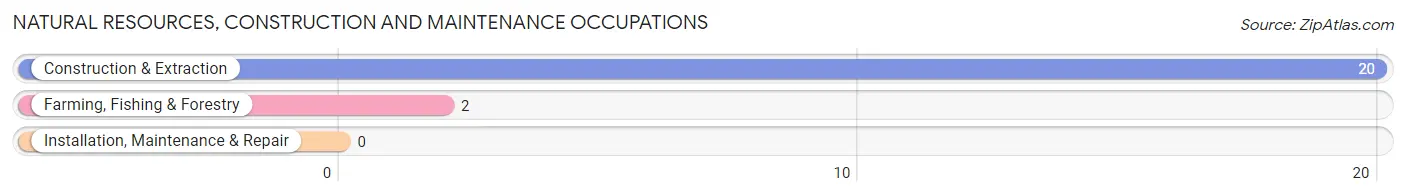
Natural Resources, Construction and Maintenance Occupations by Sex
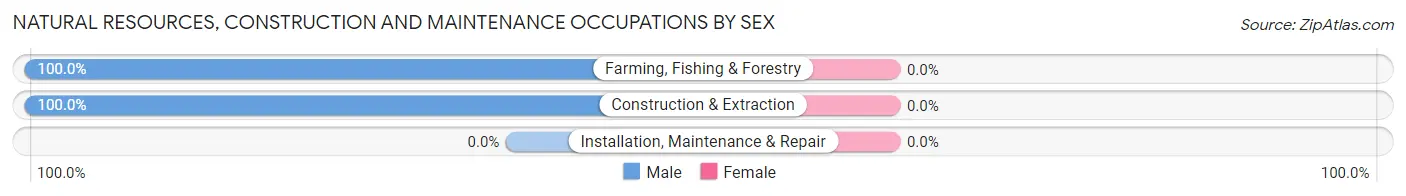
| Occupation | Male | Female |
| Farming, Fishing & Forestry | 2 (100.0%) | 0 (0.0%) |
| Construction & Extraction | 20 (100.0%) | 0 (0.0%) |
| Installation, Maintenance & Repair | 0 (0.0%) | 0 (0.0%) |
| Total (Category) | 22 (100.0%) | 0 (0.0%) |
| Total (Overall) | 197 (58.6%) | 139 (41.4%) |
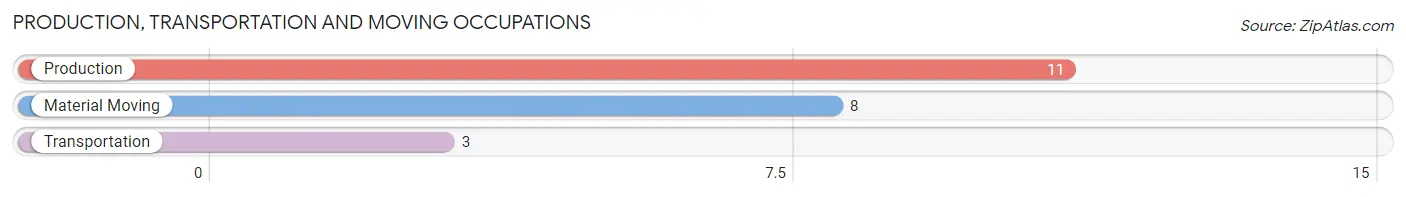
Production, Transportation and Moving Occupations
The most common Production, Transportation and Moving occupations in Effingham are Production (11 | 3.3%), Material Moving (8 | 2.4%), and Transportation (3 | 0.9%).
Production, Transportation and Moving Occupations by Sex
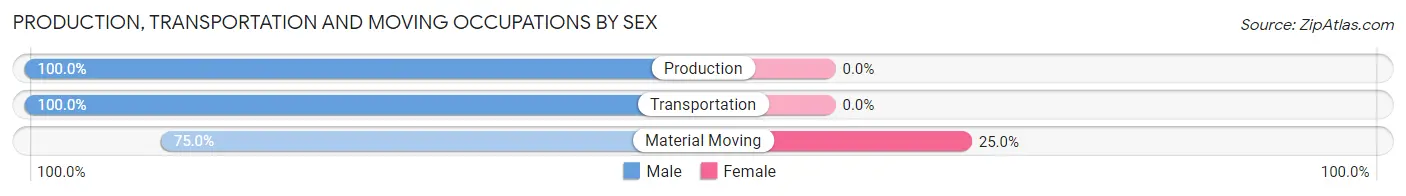
| Occupation | Male | Female |
| Production | 11 (100.0%) | 0 (0.0%) |
| Transportation | 3 (100.0%) | 0 (0.0%) |
| Material Moving | 6 (75.0%) | 2 (25.0%) |
| Total (Category) | 20 (90.9%) | 2 (9.1%) |
| Total (Overall) | 197 (58.6%) | 139 (41.4%) |
Employment Industries by Sex in Effingham
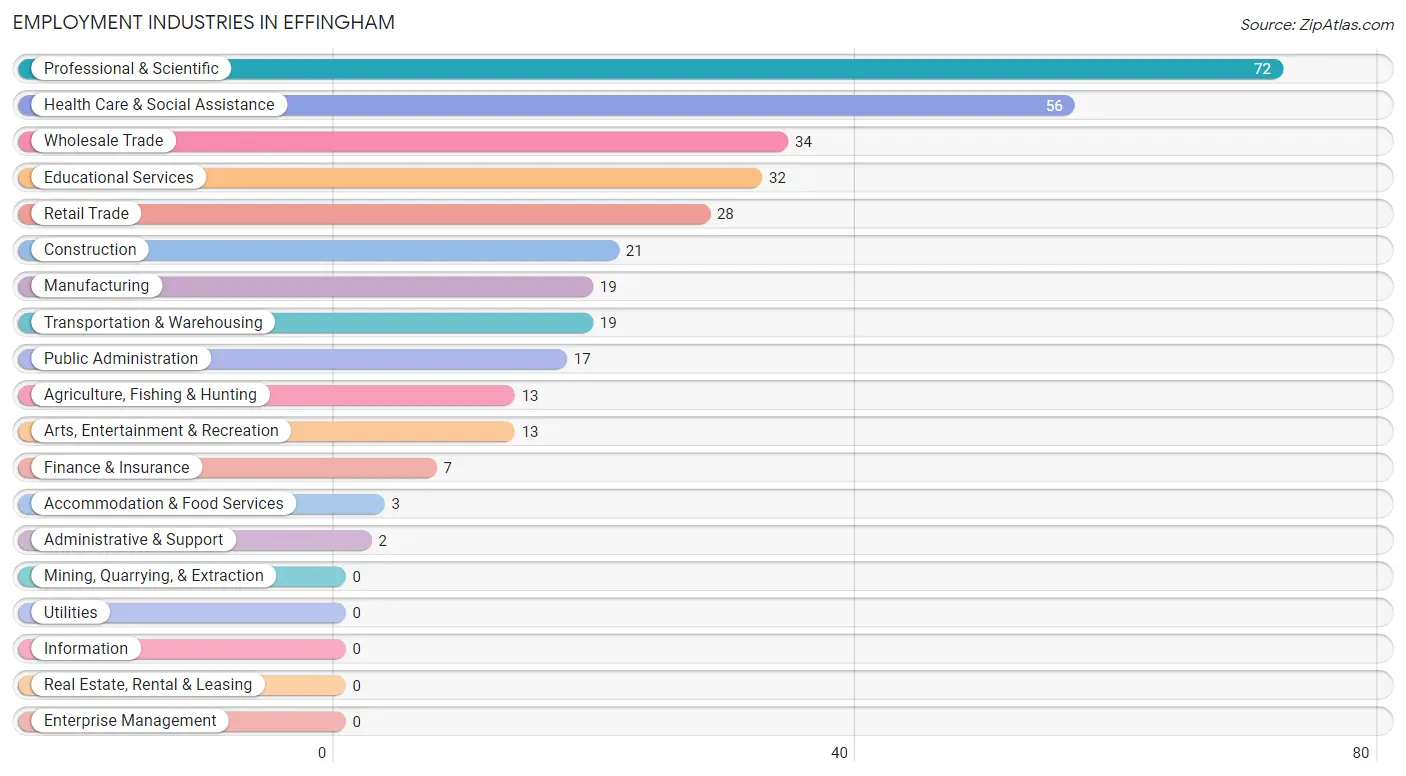
Employment Industries in Effingham
The major employment industries in Effingham include Professional & Scientific (72 | 21.4%), Health Care & Social Assistance (56 | 16.7%), Wholesale Trade (34 | 10.1%), Educational Services (32 | 9.5%), and Retail Trade (28 | 8.3%).
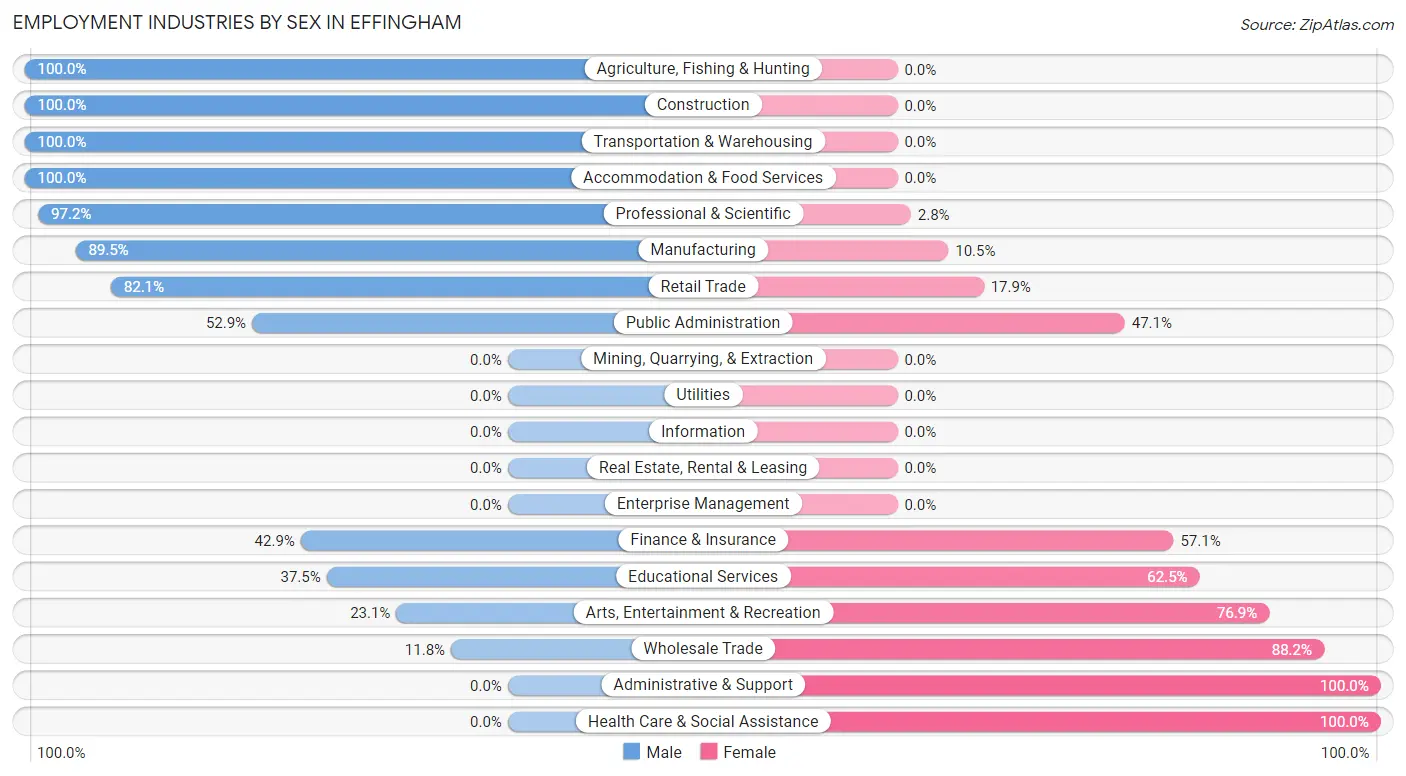
Employment Industries by Sex in Effingham
The Effingham industries that see more men than women are Agriculture, Fishing & Hunting (100.0%), Construction (100.0%), and Transportation & Warehousing (100.0%), whereas the industries that tend to have a higher number of women are Administrative & Support (100.0%), Health Care & Social Assistance (100.0%), and Wholesale Trade (88.2%).
| Industry | Male | Female |
| Agriculture, Fishing & Hunting | 13 (100.0%) | 0 (0.0%) |
| Mining, Quarrying, & Extraction | 0 (0.0%) | 0 (0.0%) |
| Construction | 21 (100.0%) | 0 (0.0%) |
| Manufacturing | 17 (89.5%) | 2 (10.5%) |
| Wholesale Trade | 4 (11.8%) | 30 (88.2%) |
| Retail Trade | 23 (82.1%) | 5 (17.9%) |
| Transportation & Warehousing | 19 (100.0%) | 0 (0.0%) |
| Utilities | 0 (0.0%) | 0 (0.0%) |
| Information | 0 (0.0%) | 0 (0.0%) |
| Finance & Insurance | 3 (42.9%) | 4 (57.1%) |
| Real Estate, Rental & Leasing | 0 (0.0%) | 0 (0.0%) |
| Professional & Scientific | 70 (97.2%) | 2 (2.8%) |
| Enterprise Management | 0 (0.0%) | 0 (0.0%) |
| Administrative & Support | 0 (0.0%) | 2 (100.0%) |
| Educational Services | 12 (37.5%) | 20 (62.5%) |
| Health Care & Social Assistance | 0 (0.0%) | 56 (100.0%) |
| Arts, Entertainment & Recreation | 3 (23.1%) | 10 (76.9%) |
| Accommodation & Food Services | 3 (100.0%) | 0 (0.0%) |
| Public Administration | 9 (52.9%) | 8 (47.1%) |
| Total | 197 (58.6%) | 139 (41.4%) |
Education in Effingham
School Enrollment in Effingham
The most common levels of schooling among the 46 students in Effingham are high school (13 | 28.3%), middle school (12 | 26.1%), and kindergarten (10 | 21.7%).
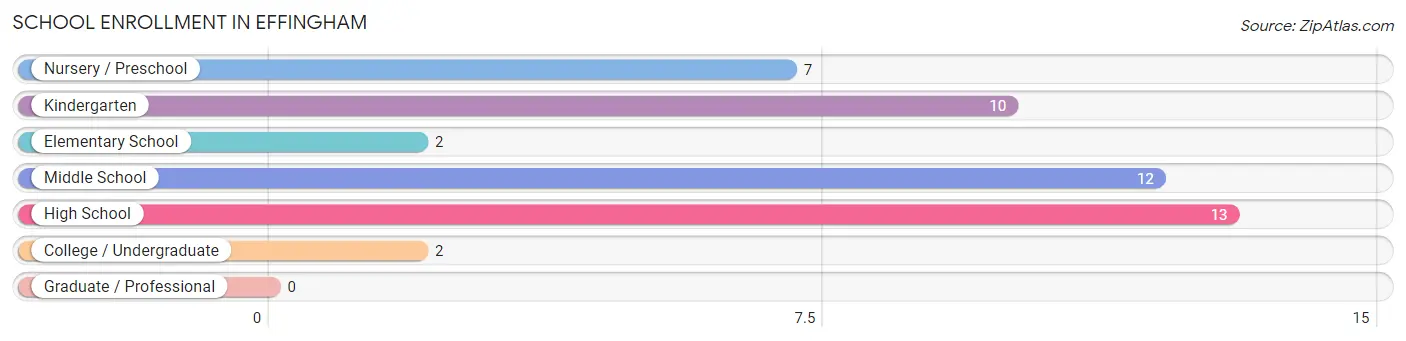
| School Level | # Students | % Students |
| Nursery / Preschool | 7 | 15.2% |
| Kindergarten | 10 | 21.7% |
| Elementary School | 2 | 4.3% |
| Middle School | 12 | 26.1% |
| High School | 13 | 28.3% |
| College / Undergraduate | 2 | 4.3% |
| Graduate / Professional | 0 | 0.0% |
| Total | 46 | 100.0% |
School Enrollment by Age by Funding Source in Effingham
Out of a total of 46 students who are enrolled in schools in Effingham, 6 (13.0%) attend a private institution, while the remaining 40 (87.0%) are enrolled in public schools. The age group of 10 to 14 year olds has the highest likelihood of being enrolled in private schools, with 6 (50.0% in the age bracket) enrolled. Conversely, the age group of 3 to 4 year olds has the lowest likelihood of being enrolled in a private school, with 7 (100.0% in the age bracket) attending a public institution.
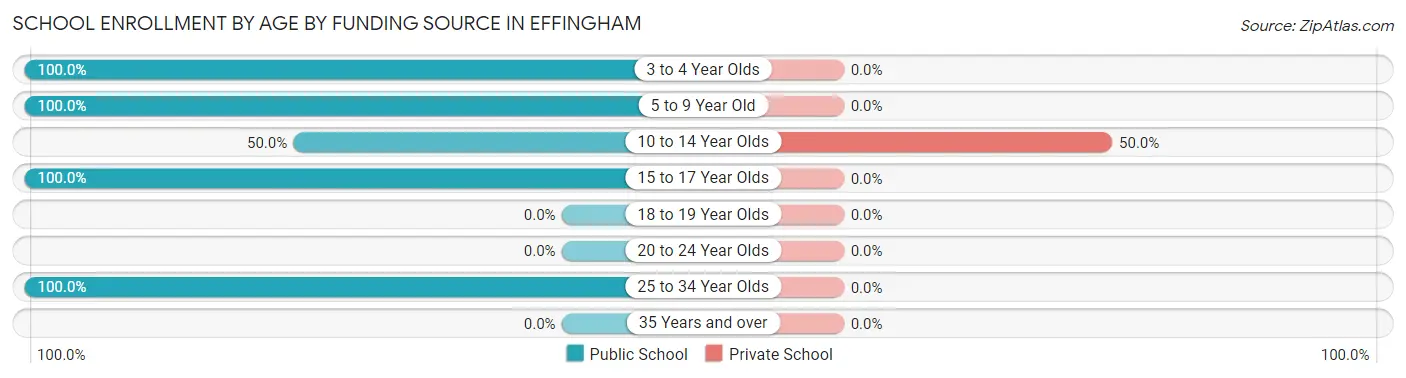
| Age Bracket | Public School | Private School |
| 3 to 4 Year Olds | 7 (100.0%) | 0 (0.0%) |
| 5 to 9 Year Old | 12 (100.0%) | 0 (0.0%) |
| 10 to 14 Year Olds | 6 (50.0%) | 6 (50.0%) |
| 15 to 17 Year Olds | 13 (100.0%) | 0 (0.0%) |
| 18 to 19 Year Olds | 0 (0.0%) | 0 (0.0%) |
| 20 to 24 Year Olds | 0 (0.0%) | 0 (0.0%) |
| 25 to 34 Year Olds | 2 (100.0%) | 0 (0.0%) |
| 35 Years and over | 0 (0.0%) | 0 (0.0%) |
| Total | 40 (87.0%) | 6 (13.0%) |
Educational Attainment by Field of Study in Effingham
Education (23 | 56.1%), liberal arts & history (9 | 22.0%), business (4 | 9.8%), bio, nature & agricultural (2 | 4.9%), and science & technology (2 | 4.9%) are the most common fields of study among 41 individuals in Effingham who have obtained a bachelor's degree or higher.
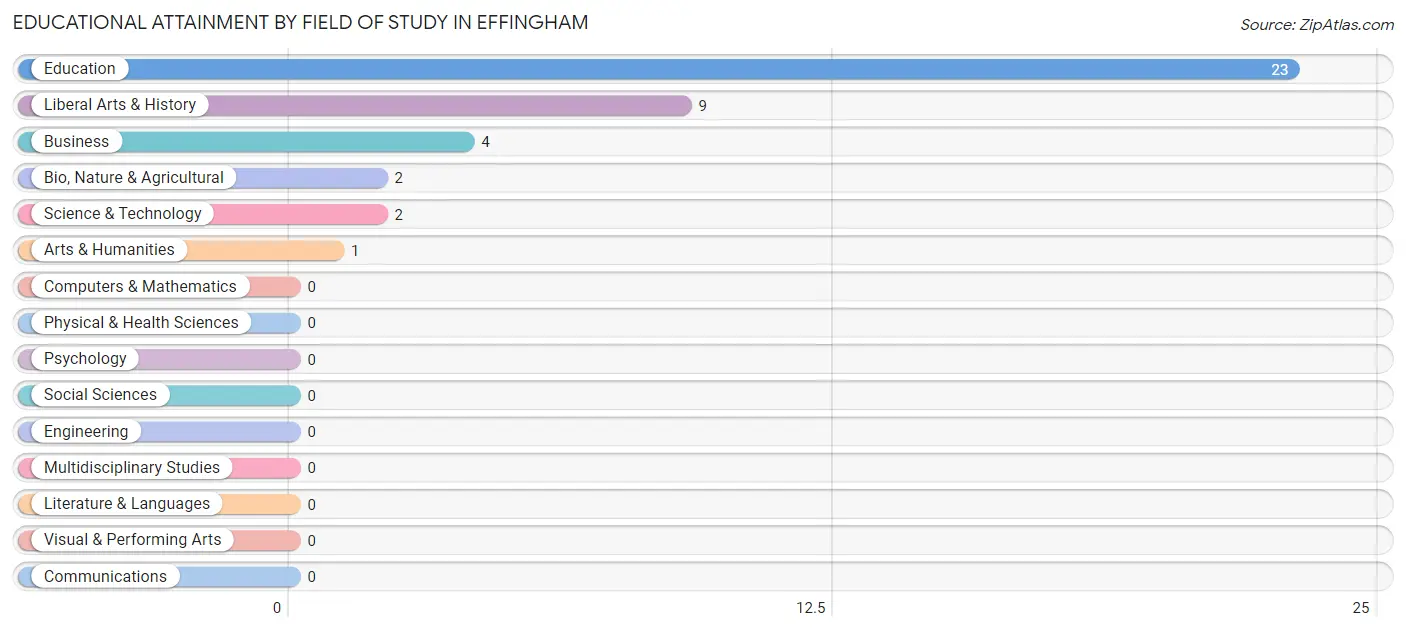
| Field of Study | # Graduates | % Graduates |
| Computers & Mathematics | 0 | 0.0% |
| Bio, Nature & Agricultural | 2 | 4.9% |
| Physical & Health Sciences | 0 | 0.0% |
| Psychology | 0 | 0.0% |
| Social Sciences | 0 | 0.0% |
| Engineering | 0 | 0.0% |
| Multidisciplinary Studies | 0 | 0.0% |
| Science & Technology | 2 | 4.9% |
| Business | 4 | 9.8% |
| Education | 23 | 56.1% |
| Literature & Languages | 0 | 0.0% |
| Liberal Arts & History | 9 | 22.0% |
| Visual & Performing Arts | 0 | 0.0% |
| Communications | 0 | 0.0% |
| Arts & Humanities | 1 | 2.4% |
| Total | 41 | 100.0% |
Transportation & Commute in Effingham
Vehicle Availability by Sex in Effingham
The most prevalent vehicle ownership categories in Effingham are males with 3 vehicles (87, accounting for 44.2%) and females with 3 vehicles (70, making up 63.5%).
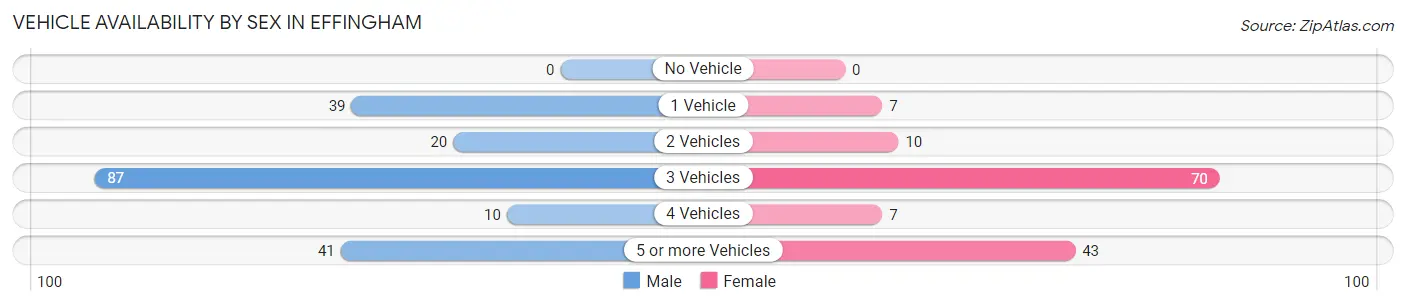
| Vehicles Available | Male | Female |
| No Vehicle | 0 (0.0%) | 0 (0.0%) |
| 1 Vehicle | 39 (19.8%) | 7 (5.1%) |
| 2 Vehicles | 20 (10.2%) | 10 (7.3%) |
| 3 Vehicles | 87 (44.2%) | 70 (51.1%) |
| 4 Vehicles | 10 (5.1%) | 7 (5.1%) |
| 5 or more Vehicles | 41 (20.8%) | 43 (31.4%) |
| Total | 197 (100.0%) | 137 (100.0%) |
Commute Time in Effingham
The most frequently occuring commute durations in Effingham are 35 to 39 minutes (70 commuters, 22.3%), 5 to 9 minutes (46 commuters, 14.6%), and 25 to 29 minutes (42 commuters, 13.4%).
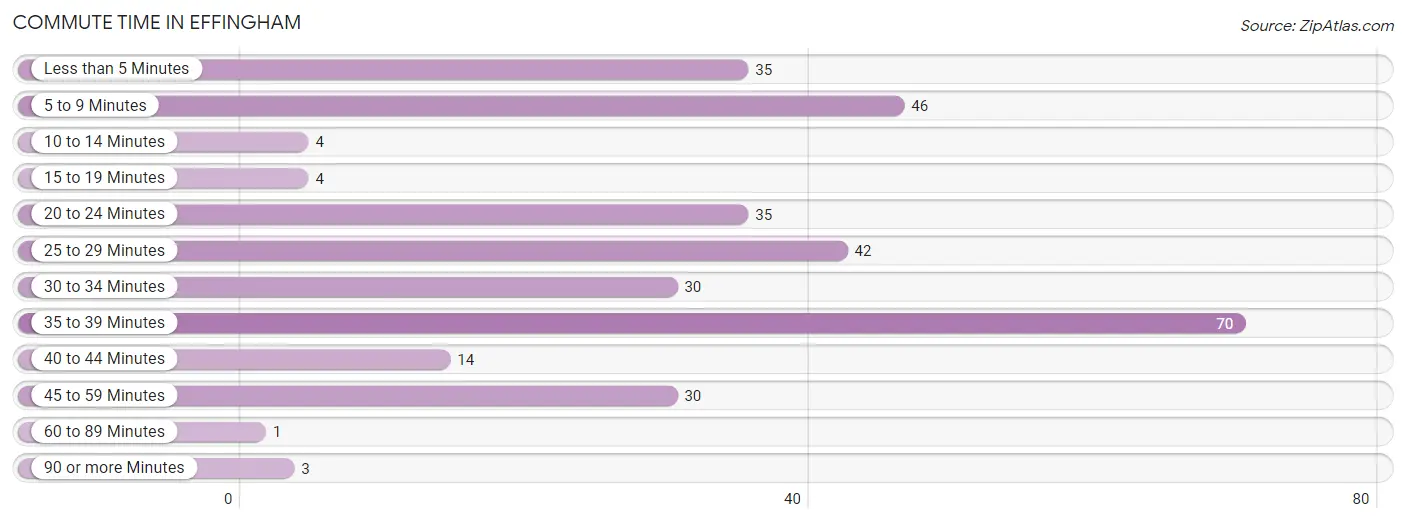
| Commute Time | # Commuters | % Commuters |
| Less than 5 Minutes | 35 | 11.2% |
| 5 to 9 Minutes | 46 | 14.6% |
| 10 to 14 Minutes | 4 | 1.3% |
| 15 to 19 Minutes | 4 | 1.3% |
| 20 to 24 Minutes | 35 | 11.2% |
| 25 to 29 Minutes | 42 | 13.4% |
| 30 to 34 Minutes | 30 | 9.6% |
| 35 to 39 Minutes | 70 | 22.3% |
| 40 to 44 Minutes | 14 | 4.5% |
| 45 to 59 Minutes | 30 | 9.6% |
| 60 to 89 Minutes | 1 | 0.3% |
| 90 or more Minutes | 3 | 1.0% |
Commute Time by Sex in Effingham
The most common commute times in Effingham are 35 to 39 minutes (70 commuters, 38.0%) for males and 5 to 9 minutes (35 commuters, 26.9%) for females.
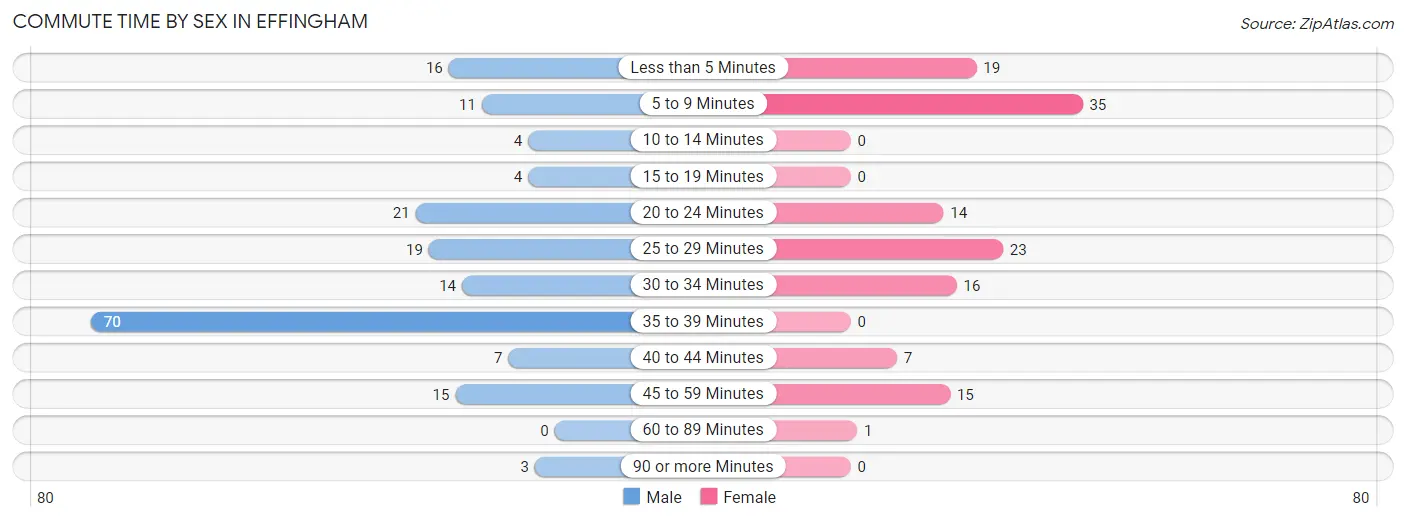
| Commute Time | Male | Female |
| Less than 5 Minutes | 16 (8.7%) | 19 (14.6%) |
| 5 to 9 Minutes | 11 (6.0%) | 35 (26.9%) |
| 10 to 14 Minutes | 4 (2.2%) | 0 (0.0%) |
| 15 to 19 Minutes | 4 (2.2%) | 0 (0.0%) |
| 20 to 24 Minutes | 21 (11.4%) | 14 (10.8%) |
| 25 to 29 Minutes | 19 (10.3%) | 23 (17.7%) |
| 30 to 34 Minutes | 14 (7.6%) | 16 (12.3%) |
| 35 to 39 Minutes | 70 (38.0%) | 0 (0.0%) |
| 40 to 44 Minutes | 7 (3.8%) | 7 (5.4%) |
| 45 to 59 Minutes | 15 (8.2%) | 15 (11.5%) |
| 60 to 89 Minutes | 0 (0.0%) | 1 (0.8%) |
| 90 or more Minutes | 3 (1.6%) | 0 (0.0%) |
Time of Departure to Work by Sex in Effingham
The most frequent times of departure to work in Effingham are 7:00 AM to 7:29 AM (82, 44.6%) for males and 7:00 AM to 7:29 AM (39, 30.0%) for females.
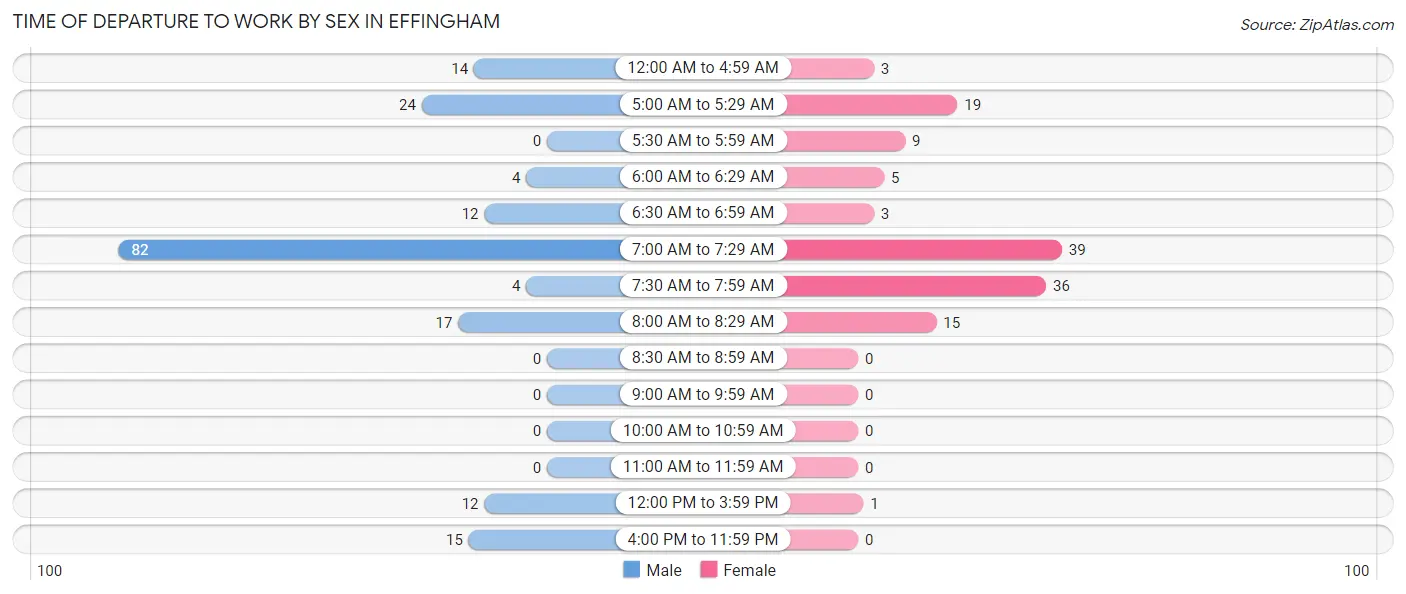
| Time of Departure | Male | Female |
| 12:00 AM to 4:59 AM | 14 (7.6%) | 3 (2.3%) |
| 5:00 AM to 5:29 AM | 24 (13.0%) | 19 (14.6%) |
| 5:30 AM to 5:59 AM | 0 (0.0%) | 9 (6.9%) |
| 6:00 AM to 6:29 AM | 4 (2.2%) | 5 (3.8%) |
| 6:30 AM to 6:59 AM | 12 (6.5%) | 3 (2.3%) |
| 7:00 AM to 7:29 AM | 82 (44.6%) | 39 (30.0%) |
| 7:30 AM to 7:59 AM | 4 (2.2%) | 36 (27.7%) |
| 8:00 AM to 8:29 AM | 17 (9.2%) | 15 (11.5%) |
| 8:30 AM to 8:59 AM | 0 (0.0%) | 0 (0.0%) |
| 9:00 AM to 9:59 AM | 0 (0.0%) | 0 (0.0%) |
| 10:00 AM to 10:59 AM | 0 (0.0%) | 0 (0.0%) |
| 11:00 AM to 11:59 AM | 0 (0.0%) | 0 (0.0%) |
| 12:00 PM to 3:59 PM | 12 (6.5%) | 1 (0.8%) |
| 4:00 PM to 11:59 PM | 15 (8.2%) | 0 (0.0%) |
| Total | 184 (100.0%) | 130 (100.0%) |
Housing Occupancy in Effingham
Occupancy by Ownership in Effingham
Of the total 300 dwellings in Effingham, owner-occupied units account for 249 (83.0%), while renter-occupied units make up 51 (17.0%).
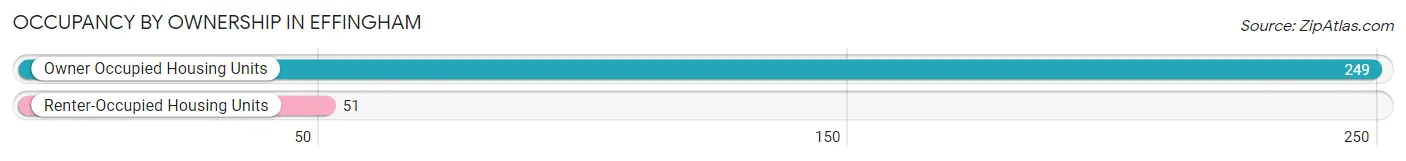
| Occupancy | # Housing Units | % Housing Units |
| Owner Occupied Housing Units | 249 | 83.0% |
| Renter-Occupied Housing Units | 51 | 17.0% |
| Total Occupied Housing Units | 300 | 100.0% |
Occupancy by Household Size in Effingham
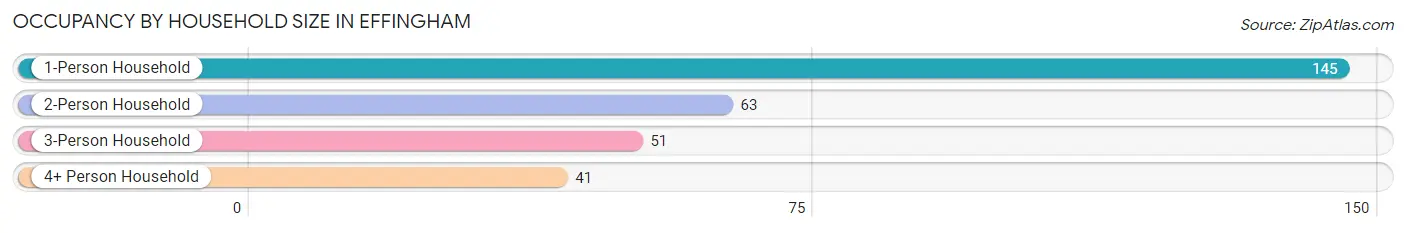
| Household Size | # Housing Units | % Housing Units |
| 1-Person Household | 145 | 48.3% |
| 2-Person Household | 63 | 21.0% |
| 3-Person Household | 51 | 17.0% |
| 4+ Person Household | 41 | 13.7% |
| Total Housing Units | 300 | 100.0% |
Occupancy by Ownership by Household Size in Effingham
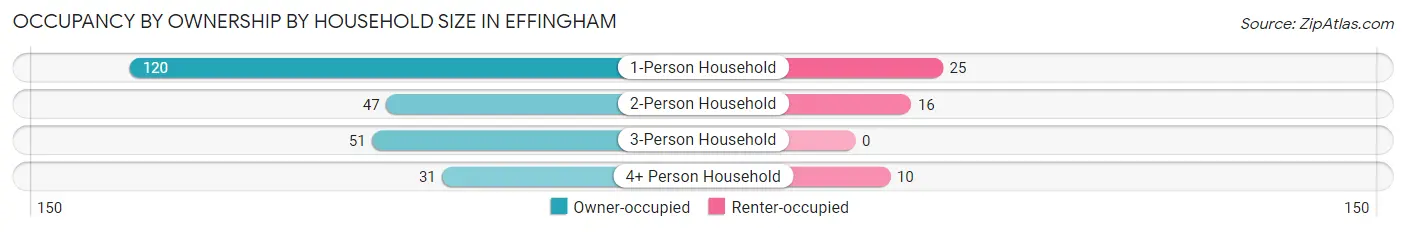
| Household Size | Owner-occupied | Renter-occupied |
| 1-Person Household | 120 (82.8%) | 25 (17.2%) |
| 2-Person Household | 47 (74.6%) | 16 (25.4%) |
| 3-Person Household | 51 (100.0%) | 0 (0.0%) |
| 4+ Person Household | 31 (75.6%) | 10 (24.4%) |
| Total Housing Units | 249 (83.0%) | 51 (17.0%) |
Occupancy by Educational Attainment in Effingham
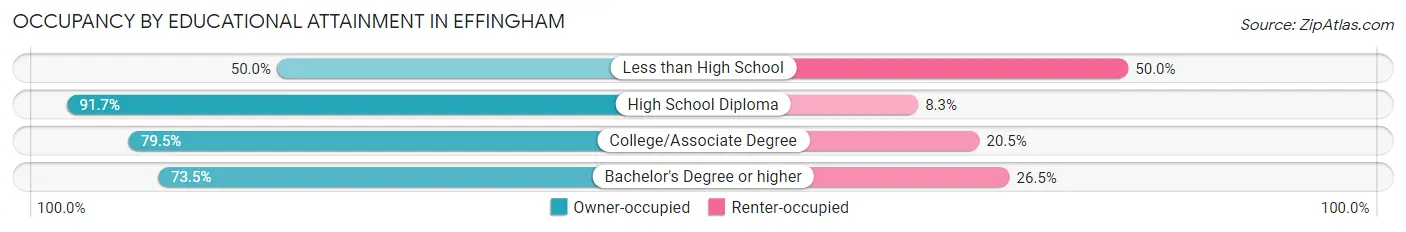
| Household Size | Owner-occupied | Renter-occupied |
| Less than High School | 6 (50.0%) | 6 (50.0%) |
| High School Diploma | 121 (91.7%) | 11 (8.3%) |
| College/Associate Degree | 97 (79.5%) | 25 (20.5%) |
| Bachelor's Degree or higher | 25 (73.5%) | 9 (26.5%) |
Occupancy by Age of Householder in Effingham
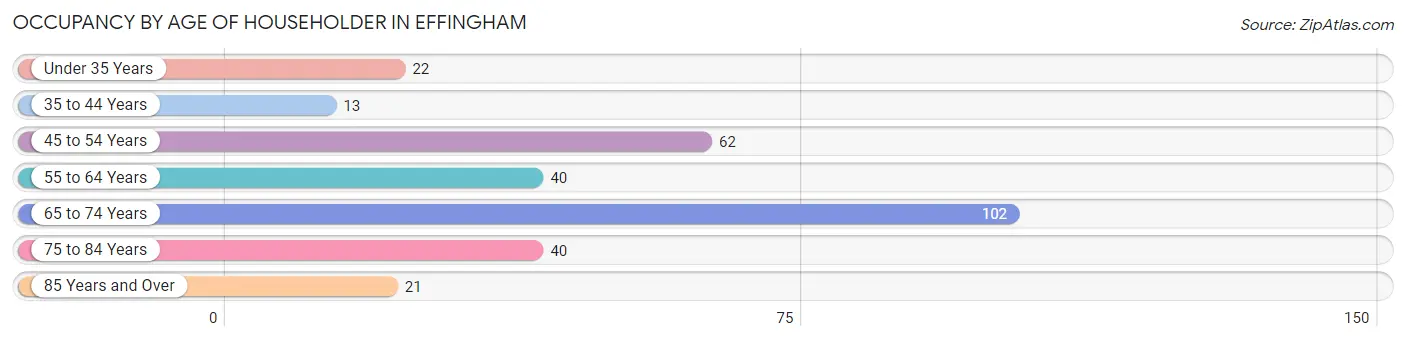
| Age Bracket | # Households | % Households |
| Under 35 Years | 22 | 7.3% |
| 35 to 44 Years | 13 | 4.3% |
| 45 to 54 Years | 62 | 20.7% |
| 55 to 64 Years | 40 | 13.3% |
| 65 to 74 Years | 102 | 34.0% |
| 75 to 84 Years | 40 | 13.3% |
| 85 Years and Over | 21 | 7.0% |
| Total | 300 | 100.0% |
Housing Finances in Effingham
Median Income by Occupancy in Effingham
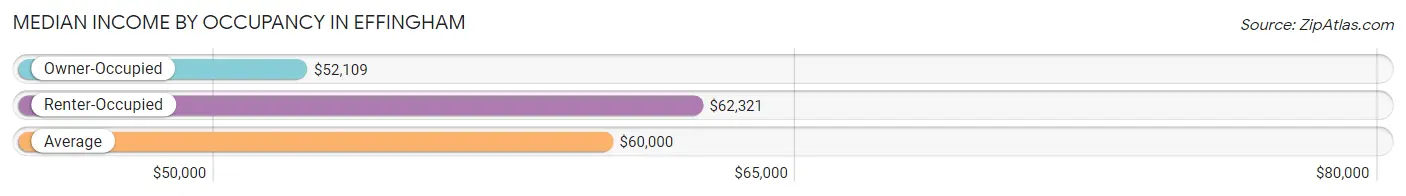
| Occupancy Type | # Households | Median Income |
| Owner-Occupied | 249 (83.0%) | $52,109 |
| Renter-Occupied | 51 (17.0%) | $62,321 |
| Average | 300 (100.0%) | $60,000 |
Occupancy by Householder Income Bracket in Effingham
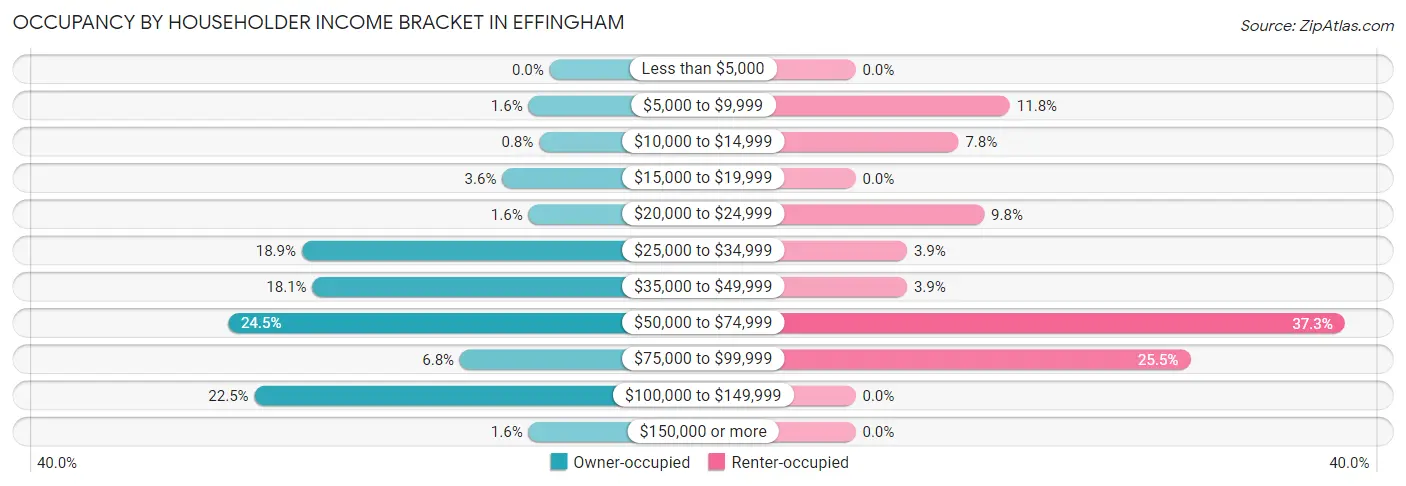
| Income Bracket | Owner-occupied | Renter-occupied |
| Less than $5,000 | 0 (0.0%) | 0 (0.0%) |
| $5,000 to $9,999 | 4 (1.6%) | 6 (11.8%) |
| $10,000 to $14,999 | 2 (0.8%) | 4 (7.8%) |
| $15,000 to $19,999 | 9 (3.6%) | 0 (0.0%) |
| $20,000 to $24,999 | 4 (1.6%) | 5 (9.8%) |
| $25,000 to $34,999 | 47 (18.9%) | 2 (3.9%) |
| $35,000 to $49,999 | 45 (18.1%) | 2 (3.9%) |
| $50,000 to $74,999 | 61 (24.5%) | 19 (37.2%) |
| $75,000 to $99,999 | 17 (6.8%) | 13 (25.5%) |
| $100,000 to $149,999 | 56 (22.5%) | 0 (0.0%) |
| $150,000 or more | 4 (1.6%) | 0 (0.0%) |
| Total | 249 (100.0%) | 51 (100.0%) |
Monthly Housing Cost Tiers in Effingham
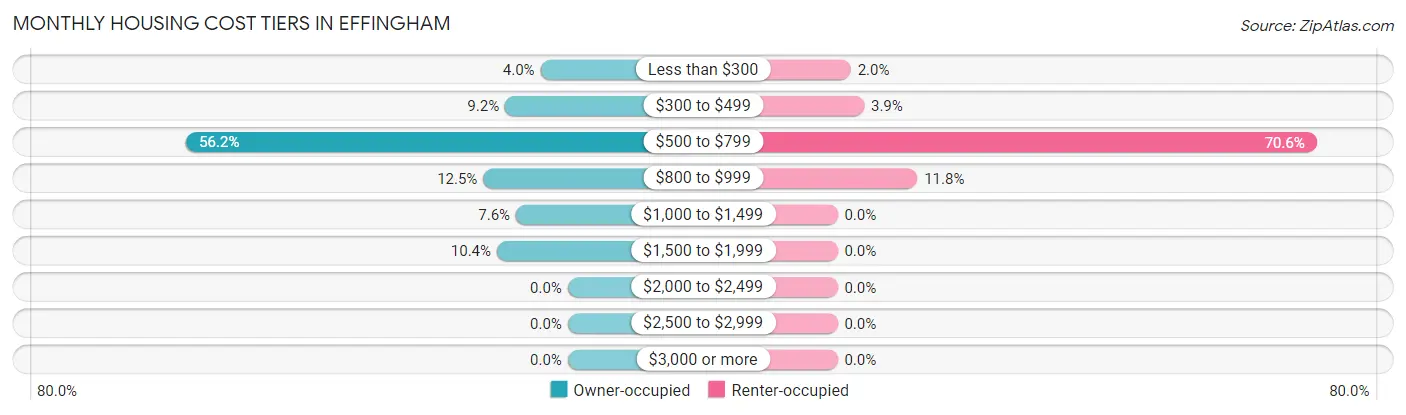
| Monthly Cost | Owner-occupied | Renter-occupied |
| Less than $300 | 10 (4.0%) | 1 (2.0%) |
| $300 to $499 | 23 (9.2%) | 2 (3.9%) |
| $500 to $799 | 140 (56.2%) | 36 (70.6%) |
| $800 to $999 | 31 (12.4%) | 6 (11.8%) |
| $1,000 to $1,499 | 19 (7.6%) | 0 (0.0%) |
| $1,500 to $1,999 | 26 (10.4%) | 0 (0.0%) |
| $2,000 to $2,499 | 0 (0.0%) | 0 (0.0%) |
| $2,500 to $2,999 | 0 (0.0%) | 0 (0.0%) |
| $3,000 or more | 0 (0.0%) | 0 (0.0%) |
| Total | 249 (100.0%) | 51 (100.0%) |
Physical Housing Characteristics in Effingham
Housing Structures in Effingham
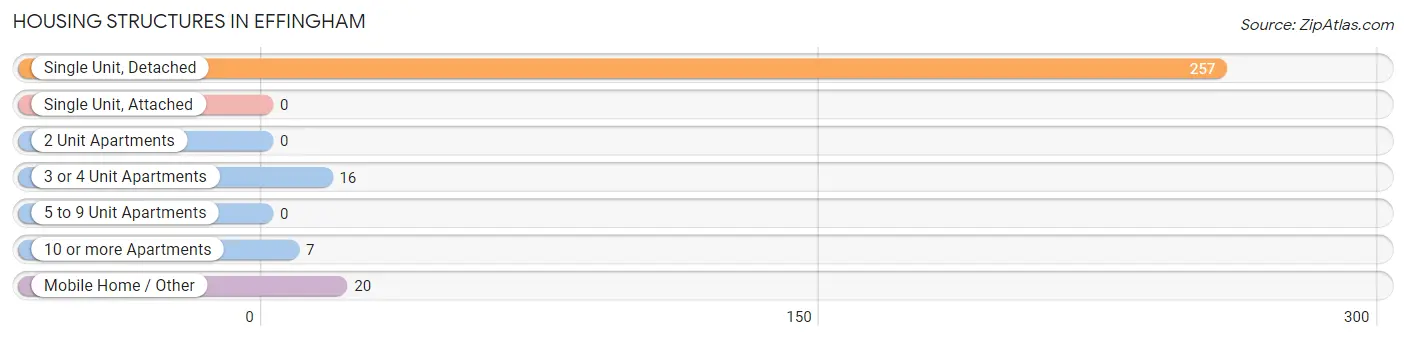
| Structure Type | # Housing Units | % Housing Units |
| Single Unit, Detached | 257 | 85.7% |
| Single Unit, Attached | 0 | 0.0% |
| 2 Unit Apartments | 0 | 0.0% |
| 3 or 4 Unit Apartments | 16 | 5.3% |
| 5 to 9 Unit Apartments | 0 | 0.0% |
| 10 or more Apartments | 7 | 2.3% |
| Mobile Home / Other | 20 | 6.7% |
| Total | 300 | 100.0% |
Housing Structures by Occupancy in Effingham
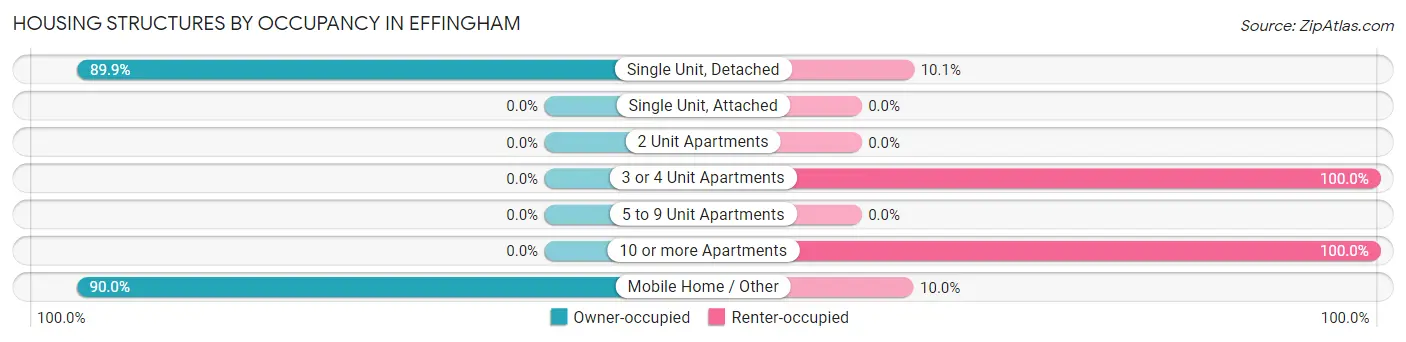
| Structure Type | Owner-occupied | Renter-occupied |
| Single Unit, Detached | 231 (89.9%) | 26 (10.1%) |
| Single Unit, Attached | 0 (0.0%) | 0 (0.0%) |
| 2 Unit Apartments | 0 (0.0%) | 0 (0.0%) |
| 3 or 4 Unit Apartments | 0 (0.0%) | 16 (100.0%) |
| 5 to 9 Unit Apartments | 0 (0.0%) | 0 (0.0%) |
| 10 or more Apartments | 0 (0.0%) | 7 (100.0%) |
| Mobile Home / Other | 18 (90.0%) | 2 (10.0%) |
| Total | 249 (83.0%) | 51 (17.0%) |
Housing Structures by Number of Rooms in Effingham
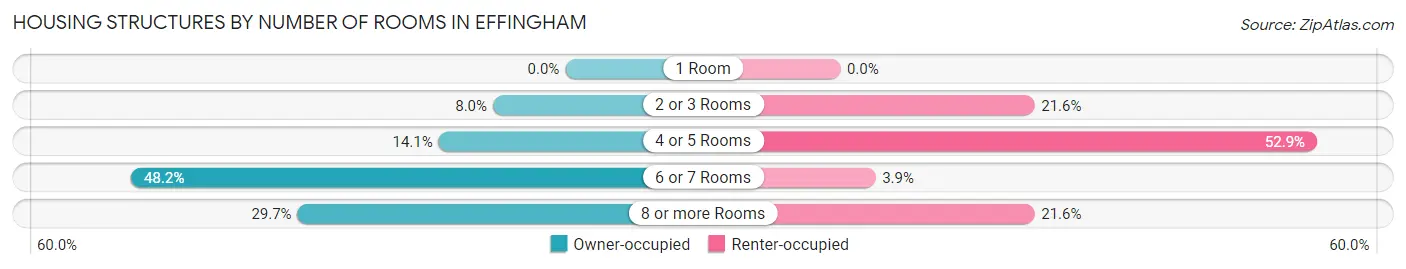
| Number of Rooms | Owner-occupied | Renter-occupied |
| 1 Room | 0 (0.0%) | 0 (0.0%) |
| 2 or 3 Rooms | 20 (8.0%) | 11 (21.6%) |
| 4 or 5 Rooms | 35 (14.1%) | 27 (52.9%) |
| 6 or 7 Rooms | 120 (48.2%) | 2 (3.9%) |
| 8 or more Rooms | 74 (29.7%) | 11 (21.6%) |
| Total | 249 (100.0%) | 51 (100.0%) |
Housing Structure by Heating Type in Effingham
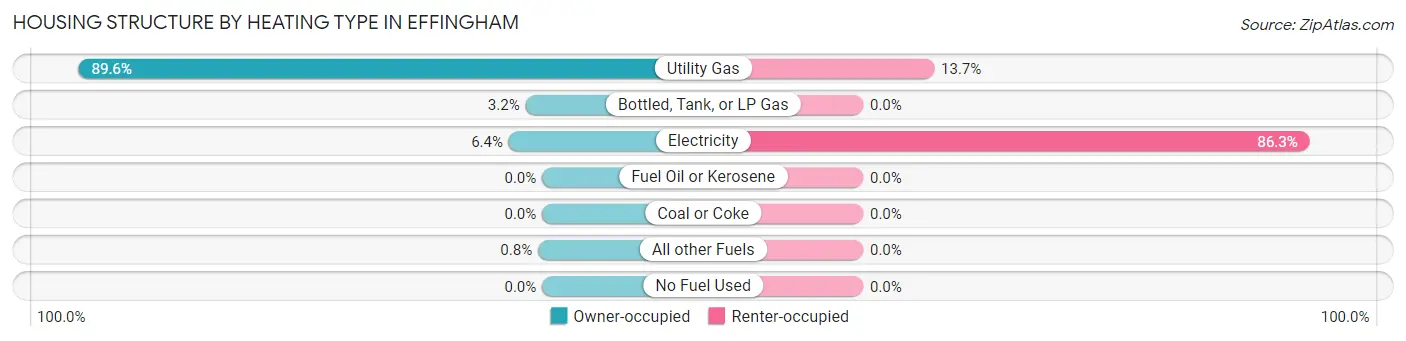
| Heating Type | Owner-occupied | Renter-occupied |
| Utility Gas | 223 (89.6%) | 7 (13.7%) |
| Bottled, Tank, or LP Gas | 8 (3.2%) | 0 (0.0%) |
| Electricity | 16 (6.4%) | 44 (86.3%) |
| Fuel Oil or Kerosene | 0 (0.0%) | 0 (0.0%) |
| Coal or Coke | 0 (0.0%) | 0 (0.0%) |
| All other Fuels | 2 (0.8%) | 0 (0.0%) |
| No Fuel Used | 0 (0.0%) | 0 (0.0%) |
| Total | 249 (100.0%) | 51 (100.0%) |
Household Vehicle Usage in Effingham
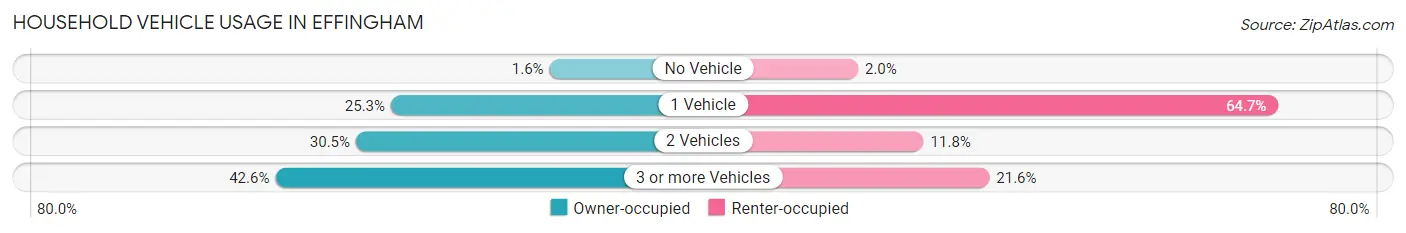
| Vehicles per Household | Owner-occupied | Renter-occupied |
| No Vehicle | 4 (1.6%) | 1 (2.0%) |
| 1 Vehicle | 63 (25.3%) | 33 (64.7%) |
| 2 Vehicles | 76 (30.5%) | 6 (11.8%) |
| 3 or more Vehicles | 106 (42.6%) | 11 (21.6%) |
| Total | 249 (100.0%) | 51 (100.0%) |
Real Estate & Mortgages in Effingham
Real Estate and Mortgage Overview in Effingham
| Characteristic | Without Mortgage | With Mortgage |
| Housing Units | 153 | 96 |
| Median Property Value | $100,900 | $85,700 |
| Median Household Income | $46,287 | $4 |
| Monthly Housing Costs | $605 | $0 |
| Real Estate Taxes | $2,087 | $15 |
Property Value by Mortgage Status in Effingham
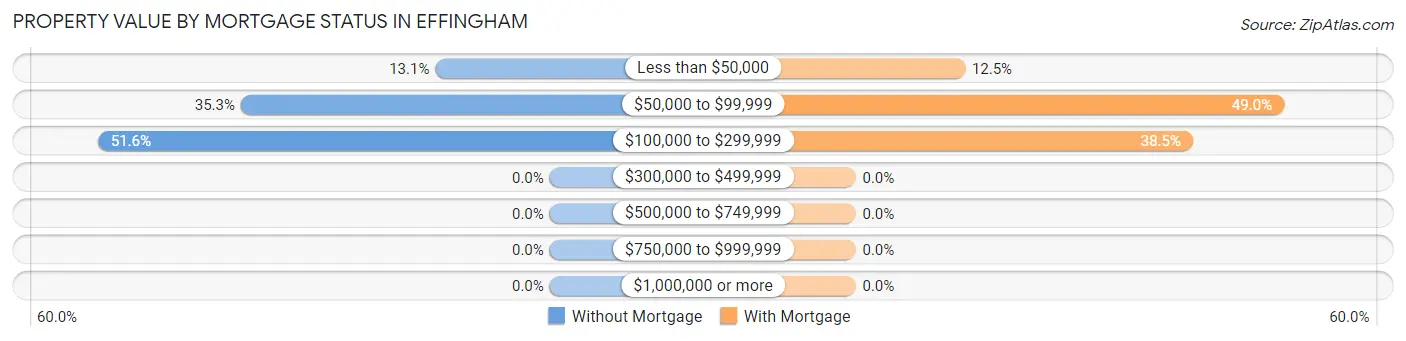
| Property Value | Without Mortgage | With Mortgage |
| Less than $50,000 | 20 (13.1%) | 12 (12.5%) |
| $50,000 to $99,999 | 54 (35.3%) | 47 (49.0%) |
| $100,000 to $299,999 | 79 (51.6%) | 37 (38.5%) |
| $300,000 to $499,999 | 0 (0.0%) | 0 (0.0%) |
| $500,000 to $749,999 | 0 (0.0%) | 0 (0.0%) |
| $750,000 to $999,999 | 0 (0.0%) | 0 (0.0%) |
| $1,000,000 or more | 0 (0.0%) | 0 (0.0%) |
| Total | 153 (100.0%) | 96 (100.0%) |
Household Income by Mortgage Status in Effingham
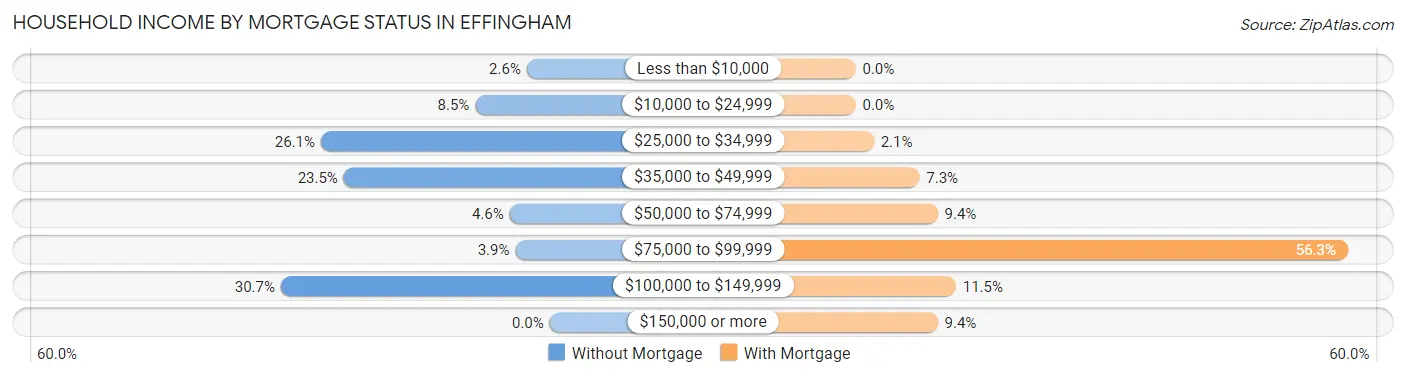
| Household Income | Without Mortgage | With Mortgage |
| Less than $10,000 | 4 (2.6%) | 0 (0.0%) |
| $10,000 to $24,999 | 13 (8.5%) | 0 (0.0%) |
| $25,000 to $34,999 | 40 (26.1%) | 2 (2.1%) |
| $35,000 to $49,999 | 36 (23.5%) | 7 (7.3%) |
| $50,000 to $74,999 | 7 (4.6%) | 9 (9.4%) |
| $75,000 to $99,999 | 6 (3.9%) | 54 (56.2%) |
| $100,000 to $149,999 | 47 (30.7%) | 11 (11.5%) |
| $150,000 or more | 0 (0.0%) | 9 (9.4%) |
| Total | 153 (100.0%) | 96 (100.0%) |
Property Value to Household Income Ratio in Effingham
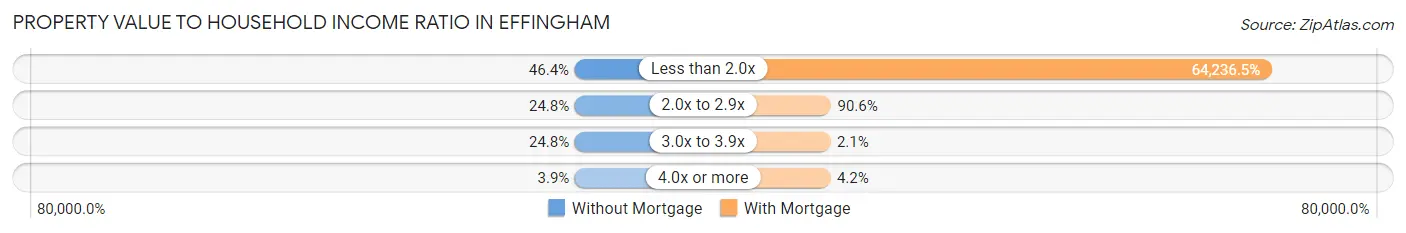
| Value-to-Income Ratio | Without Mortgage | With Mortgage |
| Less than 2.0x | 71 (46.4%) | 61,667 (64,236.5%) |
| 2.0x to 2.9x | 38 (24.8%) | 87 (90.6%) |
| 3.0x to 3.9x | 38 (24.8%) | 2 (2.1%) |
| 4.0x or more | 6 (3.9%) | 4 (4.2%) |
| Total | 153 (100.0%) | 96 (100.0%) |
Real Estate Taxes by Mortgage Status in Effingham
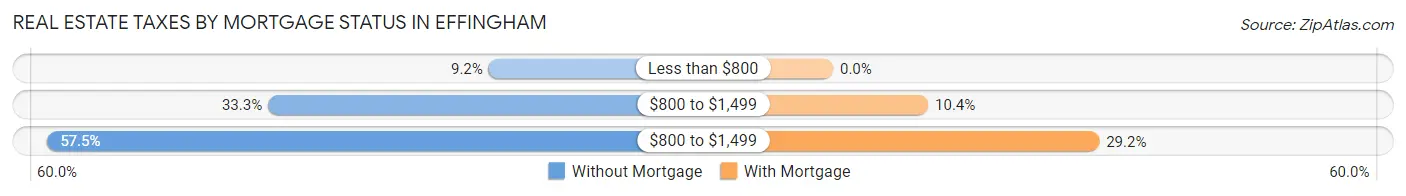
| Property Taxes | Without Mortgage | With Mortgage |
| Less than $800 | 14 (9.1%) | 0 (0.0%) |
| $800 to $1,499 | 51 (33.3%) | 10 (10.4%) |
| $800 to $1,499 | 88 (57.5%) | 28 (29.2%) |
| Total | 153 (100.0%) | 96 (100.0%) |
Health & Disability in Effingham
Health Insurance Coverage by Age in Effingham
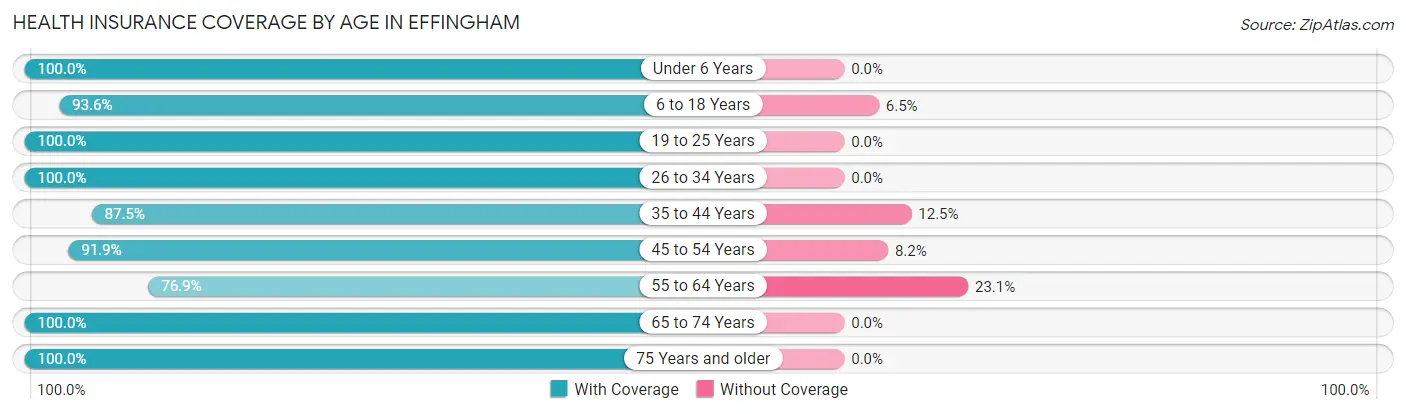
| Age Bracket | With Coverage | Without Coverage |
| Under 6 Years | 34 (100.0%) | 0 (0.0%) |
| 6 to 18 Years | 29 (93.5%) | 2 (6.5%) |
| 19 to 25 Years | 52 (100.0%) | 0 (0.0%) |
| 26 to 34 Years | 28 (100.0%) | 0 (0.0%) |
| 35 to 44 Years | 21 (87.5%) | 3 (12.5%) |
| 45 to 54 Years | 124 (91.8%) | 11 (8.2%) |
| 55 to 64 Years | 40 (76.9%) | 12 (23.1%) |
| 65 to 74 Years | 188 (100.0%) | 0 (0.0%) |
| 75 Years and older | 65 (100.0%) | 0 (0.0%) |
| Total | 581 (95.4%) | 28 (4.6%) |
Health Insurance Coverage by Citizenship Status in Effingham
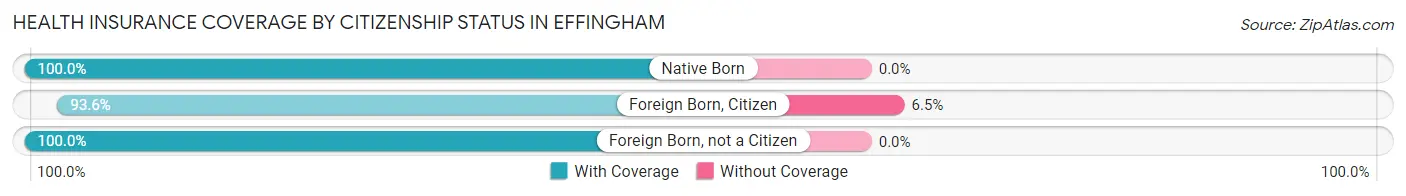
| Citizenship Status | With Coverage | Without Coverage |
| Native Born | 34 (100.0%) | 0 (0.0%) |
| Foreign Born, Citizen | 29 (93.5%) | 2 (6.5%) |
| Foreign Born, not a Citizen | 52 (100.0%) | 0 (0.0%) |
Health Insurance Coverage by Household Income in Effingham
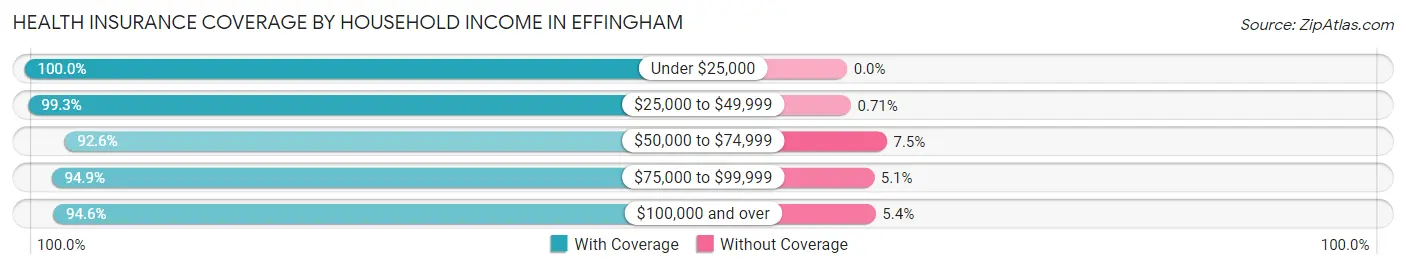
| Household Income | With Coverage | Without Coverage |
| Under $25,000 | 34 (100.0%) | 0 (0.0%) |
| $25,000 to $49,999 | 139 (99.3%) | 1 (0.7%) |
| $50,000 to $74,999 | 174 (92.5%) | 14 (7.4%) |
| $75,000 to $99,999 | 75 (94.9%) | 4 (5.1%) |
| $100,000 and over | 159 (94.6%) | 9 (5.4%) |
Public vs Private Health Insurance Coverage by Age in Effingham
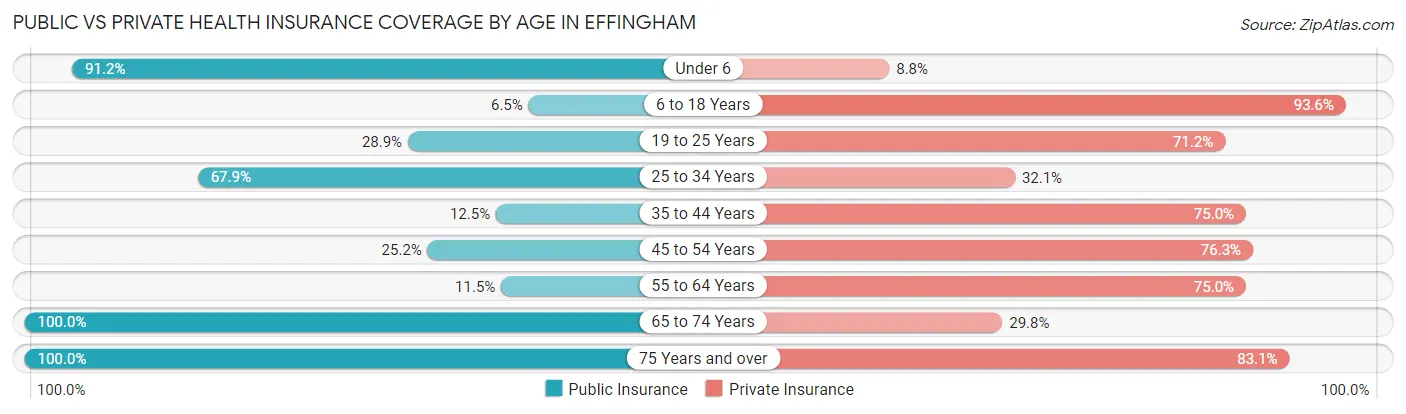
| Age Bracket | Public Insurance | Private Insurance |
| Under 6 | 31 (91.2%) | 3 (8.8%) |
| 6 to 18 Years | 2 (6.5%) | 29 (93.5%) |
| 19 to 25 Years | 15 (28.8%) | 37 (71.2%) |
| 25 to 34 Years | 19 (67.9%) | 9 (32.1%) |
| 35 to 44 Years | 3 (12.5%) | 18 (75.0%) |
| 45 to 54 Years | 34 (25.2%) | 103 (76.3%) |
| 55 to 64 Years | 6 (11.5%) | 39 (75.0%) |
| 65 to 74 Years | 188 (100.0%) | 56 (29.8%) |
| 75 Years and over | 65 (100.0%) | 54 (83.1%) |
| Total | 363 (59.6%) | 348 (57.1%) |
Disability Status by Sex by Age in Effingham
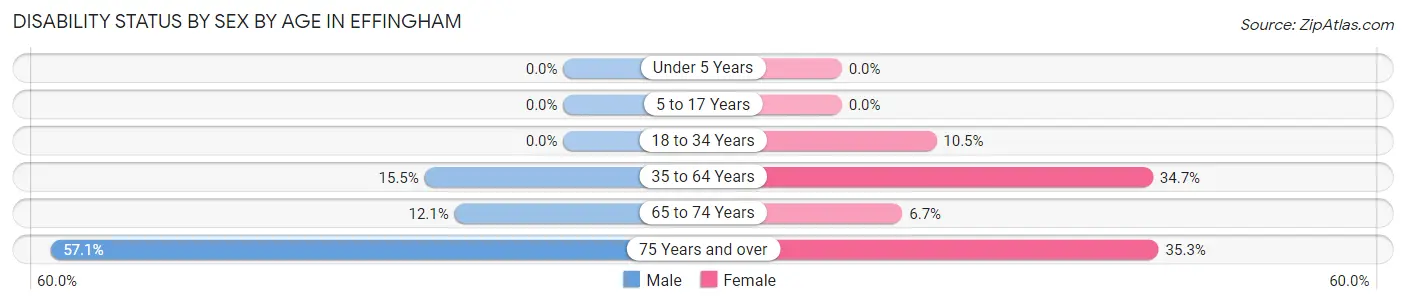
| Age Bracket | Male | Female |
| Under 5 Years | 0 (0.0%) | 0 (0.0%) |
| 5 to 17 Years | 0 (0.0%) | 0 (0.0%) |
| 18 to 34 Years | 0 (0.0%) | 4 (10.5%) |
| 35 to 64 Years | 17 (15.4%) | 35 (34.6%) |
| 65 to 74 Years | 12 (12.1%) | 6 (6.7%) |
| 75 Years and over | 8 (57.1%) | 18 (35.3%) |
Disability Class by Sex by Age in Effingham
Disability Class: Hearing Difficulty
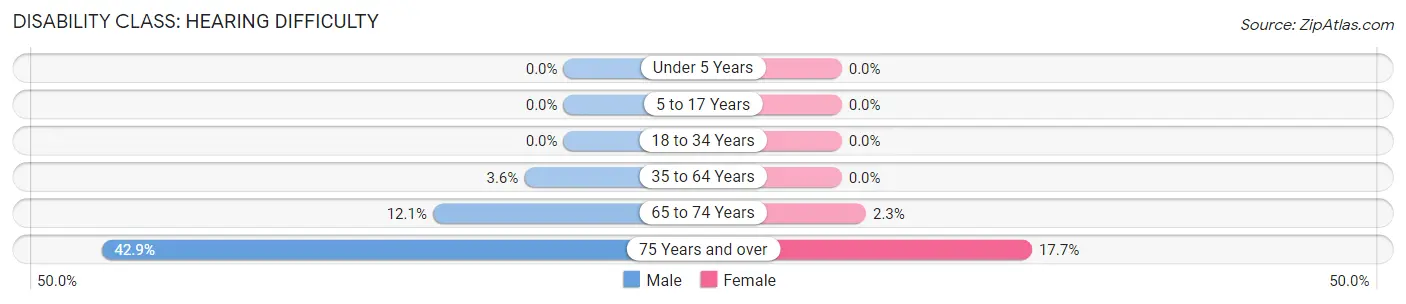
| Age Bracket | Male | Female |
| Under 5 Years | 0 (0.0%) | 0 (0.0%) |
| 5 to 17 Years | 0 (0.0%) | 0 (0.0%) |
| 18 to 34 Years | 0 (0.0%) | 0 (0.0%) |
| 35 to 64 Years | 4 (3.6%) | 0 (0.0%) |
| 65 to 74 Years | 12 (12.1%) | 2 (2.2%) |
| 75 Years and over | 6 (42.9%) | 9 (17.6%) |
Disability Class: Vision Difficulty
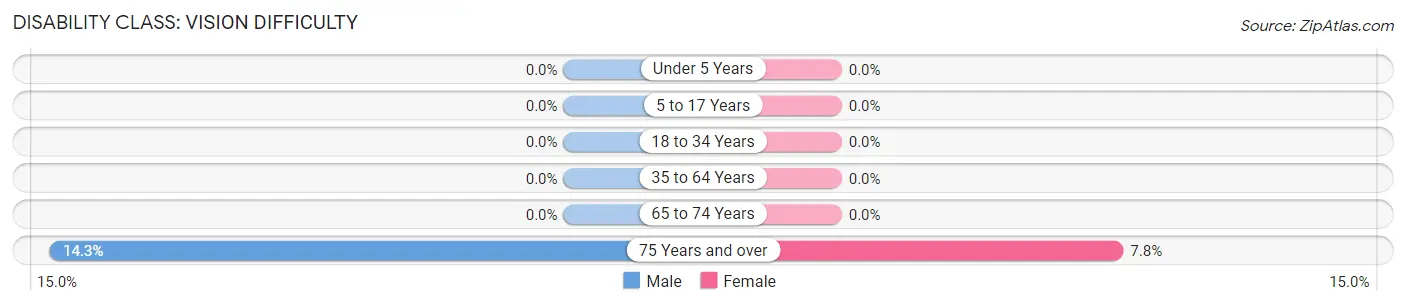
| Age Bracket | Male | Female |
| Under 5 Years | 0 (0.0%) | 0 (0.0%) |
| 5 to 17 Years | 0 (0.0%) | 0 (0.0%) |
| 18 to 34 Years | 0 (0.0%) | 0 (0.0%) |
| 35 to 64 Years | 0 (0.0%) | 0 (0.0%) |
| 65 to 74 Years | 0 (0.0%) | 0 (0.0%) |
| 75 Years and over | 2 (14.3%) | 4 (7.8%) |
Disability Class: Cognitive Difficulty
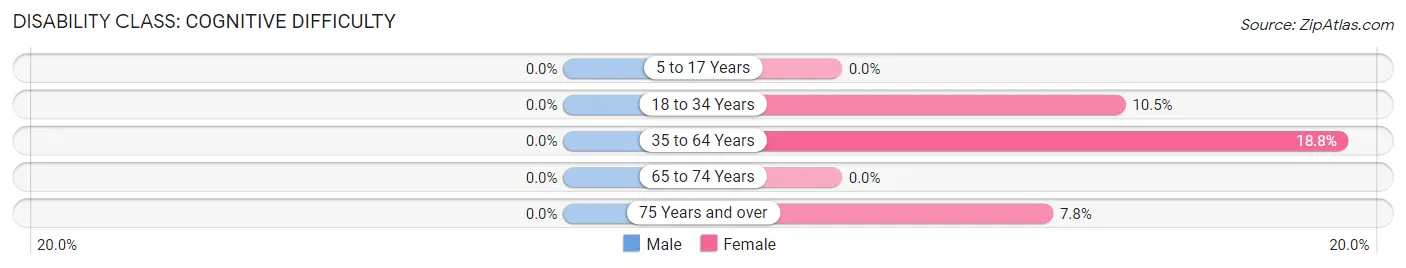
| Age Bracket | Male | Female |
| 5 to 17 Years | 0 (0.0%) | 0 (0.0%) |
| 18 to 34 Years | 0 (0.0%) | 4 (10.5%) |
| 35 to 64 Years | 0 (0.0%) | 19 (18.8%) |
| 65 to 74 Years | 0 (0.0%) | 0 (0.0%) |
| 75 Years and over | 0 (0.0%) | 4 (7.8%) |
Disability Class: Ambulatory Difficulty
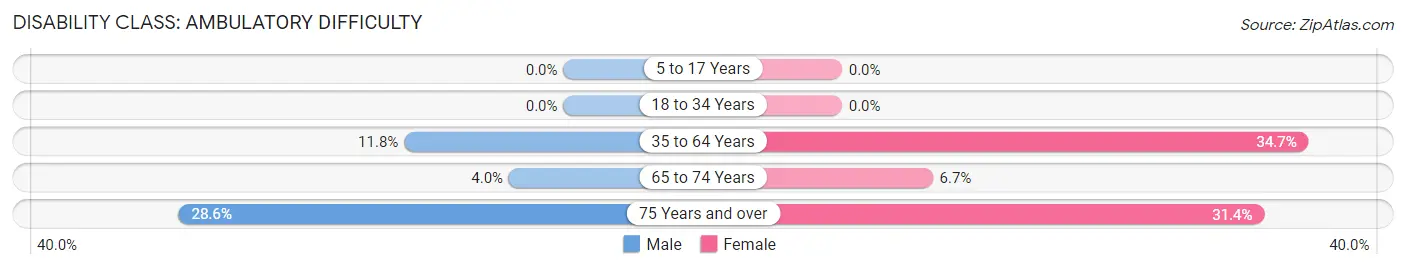
| Age Bracket | Male | Female |
| 5 to 17 Years | 0 (0.0%) | 0 (0.0%) |
| 18 to 34 Years | 0 (0.0%) | 0 (0.0%) |
| 35 to 64 Years | 13 (11.8%) | 35 (34.6%) |
| 65 to 74 Years | 4 (4.0%) | 6 (6.7%) |
| 75 Years and over | 4 (28.6%) | 16 (31.4%) |
Disability Class: Self-Care Difficulty
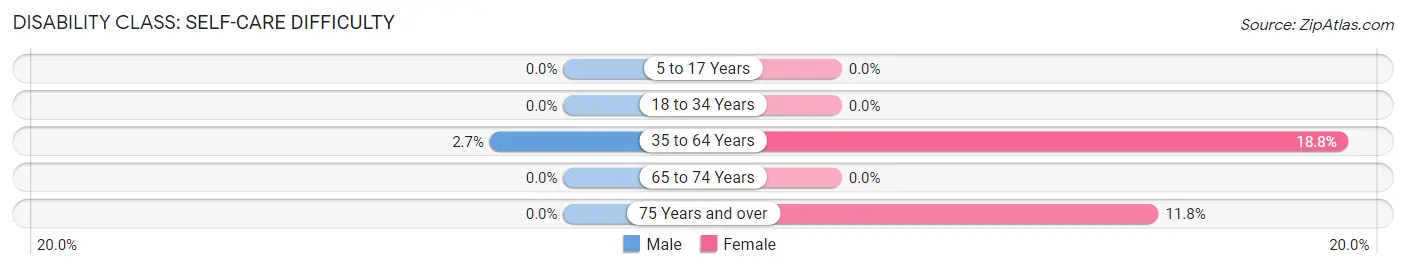
| Age Bracket | Male | Female |
| 5 to 17 Years | 0 (0.0%) | 0 (0.0%) |
| 18 to 34 Years | 0 (0.0%) | 0 (0.0%) |
| 35 to 64 Years | 3 (2.7%) | 19 (18.8%) |
| 65 to 74 Years | 0 (0.0%) | 0 (0.0%) |
| 75 Years and over | 0 (0.0%) | 6 (11.8%) |
Technology Access in Effingham
Computing Device Access in Effingham
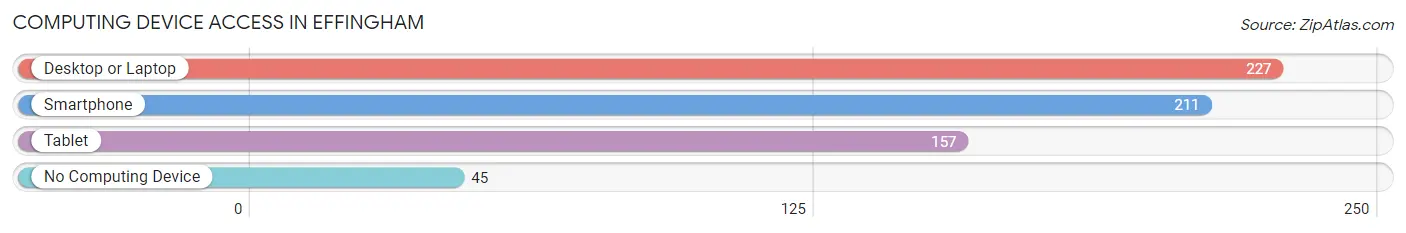
| Device Type | # Households | % Households |
| Desktop or Laptop | 227 | 75.7% |
| Smartphone | 211 | 70.3% |
| Tablet | 157 | 52.3% |
| No Computing Device | 45 | 15.0% |
| Total | 300 | 100.0% |
Internet Access in Effingham
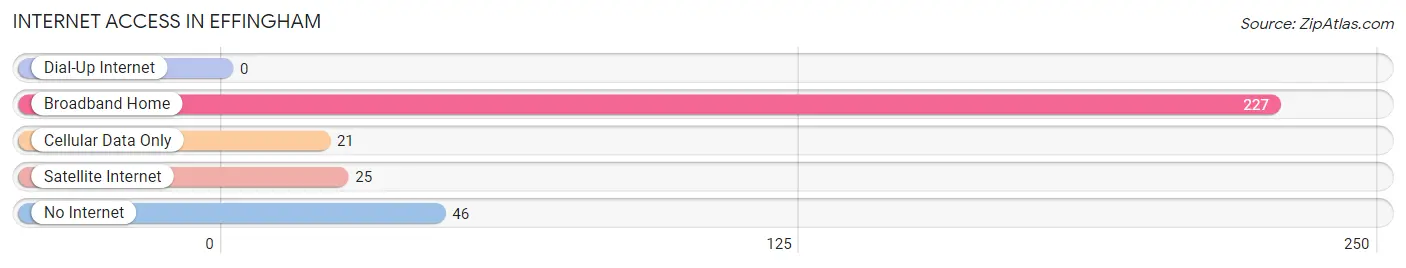
| Internet Type | # Households | % Households |
| Dial-Up Internet | 0 | 0.0% |
| Broadband Home | 227 | 75.7% |
| Cellular Data Only | 21 | 7.0% |
| Satellite Internet | 25 | 8.3% |
| No Internet | 46 | 15.3% |
| Total | 300 | 100.0% |
Effingham Summary
Effingham, Kansas is a small town located in Atchison County, Kansas. It is situated on the banks of the Missouri River, approximately 25 miles north of Atchison. The town was founded in 1854 and was named after Effingham Lawrence, a prominent local businessman. The population of Effingham was estimated to be 1,072 in 2019.
Geography
Effingham is located in the northeast corner of Atchison County, Kansas. It is situated on the banks of the Missouri River, approximately 25 miles north of Atchison. The town is located in the Central Lowland region of the United States, which is characterized by rolling hills and flat plains. The climate in Effingham is humid continental, with hot summers and cold winters. The average annual temperature is 54°F (12°C).
Economy
Effingham’s economy is largely based on agriculture. The town is home to several farms, which produce corn, soybeans, wheat, and other crops. The town also has a few small businesses, including a grocery store, a hardware store, and a few restaurants.
Demographics
As of 2019, the population of Effingham was estimated to be 1,072. The racial makeup of the town was 97.2% White, 0.7% African American, 0.3% Native American, 0.2% Asian, 0.1% Pacific Islander, 0.2% from other races, and 1.3% from two or more races. The median household income in Effingham was $45,000 in 2019.
History
Effingham was founded in 1854 and was named after Effingham Lawrence, a prominent local businessman. The town was originally a trading post for settlers traveling along the Missouri River. In the late 19th century, the town became a hub for the lumber industry, as well as a center for the production of brick and tile. The town was also home to several coal mines, which provided employment for many of the town’s residents.
In the early 20th century, Effingham experienced a period of growth and prosperity. The town was home to several businesses, including a bank, a hotel, a movie theater, and a variety of stores. However, the Great Depression of the 1930s caused the town to suffer economically. The town’s population declined and many of the businesses closed.
In the late 20th century, Effingham experienced a period of revitalization. The town was home to several new businesses, including a grocery store, a hardware store, and a few restaurants. The town also became a popular tourist destination, as it is located near several state parks and recreational areas.
Today, Effingham is a small but vibrant town. The town is home to several businesses, including a grocery store, a hardware store, and a few restaurants. The town is also home to several churches, a library, and a museum. Effingham is a great place to live, work, and raise a family.
Common Questions
What is Per Capita Income in Effingham?
Per Capita income in Effingham is $36,998.
What is the Median Family Income in Effingham?
Median Family Income in Effingham is $76,250.
What is the Median Household income in Effingham?
Median Household Income in Effingham is $60,000.
What is Income or Wage Gap in Effingham?
Income or Wage Gap in Effingham is 22.2%.
Women in Effingham earn 77.8 cents for every dollar earned by a man.
What is Inequality or Gini Index in Effingham?
Inequality or Gini Index in Effingham is 0.33.
What is the Total Population of Effingham?
Total Population of Effingham is 609.
What is the Total Male Population of Effingham?
Total Male Population of Effingham is 310.
What is the Total Female Population of Effingham?
Total Female Population of Effingham is 299.
What is the Ratio of Males per 100 Females in Effingham?
There are 103.68 Males per 100 Females in Effingham.
What is the Ratio of Females per 100 Males in Effingham?
There are 96.45 Females per 100 Males in Effingham.
What is the Median Population Age in Effingham?
Median Population Age in Effingham is 55.1 Years.
What is the Average Family Size in Effingham
Average Family Size in Effingham is 2.9 People.
What is the Average Household Size in Effingham
Average Household Size in Effingham is 2.0 People.
How Large is the Labor Force in Effingham?
There are 339 People in the Labor Forcein in Effingham.
What is the Percentage of People in the Labor Force in Effingham?
61.7% of People are in the Labor Force in Effingham.
What is the Unemployment Rate in Effingham?
Unemployment Rate in Effingham is 0.9%.