Fairview, KS Map & Demographics
Fairview Map
Fairview Overview
$37,267
PER CAPITA INCOME
$63,750
AVG FAMILY INCOME
$55,369
AVG HOUSEHOLD INCOME
59.6%
WAGE / INCOME GAP [ % ]
40.4¢/ $1
WAGE / INCOME GAP [ $ ]
0.36
INEQUALITY / GINI INDEX
334
TOTAL POPULATION
200
MALE POPULATION
134
FEMALE POPULATION
149.25
MALES / 100 FEMALES
67.00
FEMALES / 100 MALES
57.5
MEDIAN AGE
3.0
AVG FAMILY SIZE
1.8
AVG HOUSEHOLD SIZE
221
LABOR FORCE [ PEOPLE ]
77.5%
PERCENT IN LABOR FORCE
Fairview Zip Codes
Fairview Area Codes
Income in Fairview
Income Overview in Fairview
Per Capita Income in Fairview is $37,267, while median incomes of families and households are $63,750 and $55,369 respectively.
| Characteristic | Number | Measure |
| Per Capita Income | 334 | $37,267 |
| Median Family Income | 68 | $63,750 |
| Mean Family Income | 68 | $82,579 |
| Median Household Income | 188 | $55,369 |
| Mean Household Income | 188 | $61,286 |
| Income Deficit | 68 | $0 |
| Wage / Income Gap (%) | 334 | 59.64% |
| Wage / Income Gap ($) | 334 | 40.36¢ per $1 |
| Gini / Inequality Index | 334 | 0.36 |
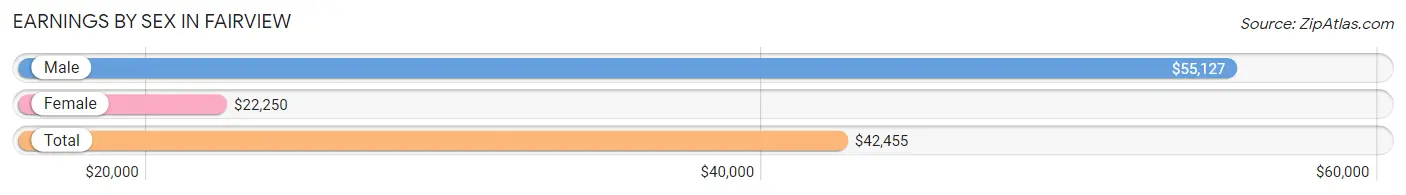
Earnings by Sex in Fairview
Average Earnings in Fairview are $42,455, $55,127 for men and $22,250 for women, a difference of 59.6%.
| Sex | Number | Average Earnings |
| Male | 164 (72.3%) | $55,127 |
| Female | 63 (27.8%) | $22,250 |
| Total | 227 (100.0%) | $42,455 |
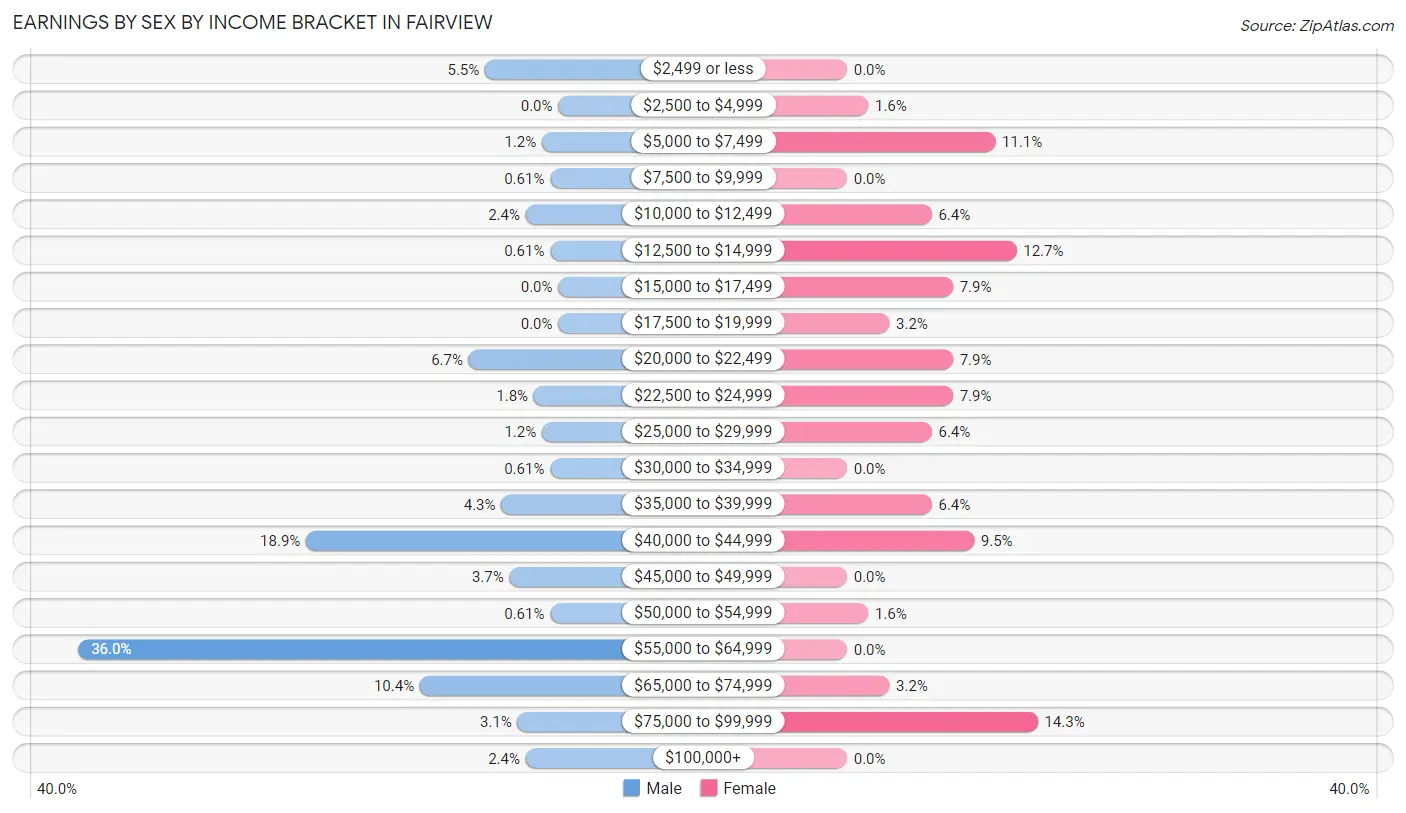
Earnings by Sex by Income Bracket in Fairview
The most common earnings brackets in Fairview are $55,000 to $64,999 for men (59 | 36.0%) and $75,000 to $99,999 for women (9 | 14.3%).
| Income | Male | Female |
| $2,499 or less | 9 (5.5%) | 0 (0.0%) |
| $2,500 to $4,999 | 0 (0.0%) | 1 (1.6%) |
| $5,000 to $7,499 | 2 (1.2%) | 7 (11.1%) |
| $7,500 to $9,999 | 1 (0.6%) | 0 (0.0%) |
| $10,000 to $12,499 | 4 (2.4%) | 4 (6.4%) |
| $12,500 to $14,999 | 1 (0.6%) | 8 (12.7%) |
| $15,000 to $17,499 | 0 (0.0%) | 5 (7.9%) |
| $17,500 to $19,999 | 0 (0.0%) | 2 (3.2%) |
| $20,000 to $22,499 | 11 (6.7%) | 5 (7.9%) |
| $22,500 to $24,999 | 3 (1.8%) | 5 (7.9%) |
| $25,000 to $29,999 | 2 (1.2%) | 4 (6.4%) |
| $30,000 to $34,999 | 1 (0.6%) | 0 (0.0%) |
| $35,000 to $39,999 | 7 (4.3%) | 4 (6.4%) |
| $40,000 to $44,999 | 31 (18.9%) | 6 (9.5%) |
| $45,000 to $49,999 | 6 (3.7%) | 0 (0.0%) |
| $50,000 to $54,999 | 1 (0.6%) | 1 (1.6%) |
| $55,000 to $64,999 | 59 (36.0%) | 0 (0.0%) |
| $65,000 to $74,999 | 17 (10.4%) | 2 (3.2%) |
| $75,000 to $99,999 | 5 (3.0%) | 9 (14.3%) |
| $100,000+ | 4 (2.4%) | 0 (0.0%) |
| Total | 164 (100.0%) | 63 (100.0%) |
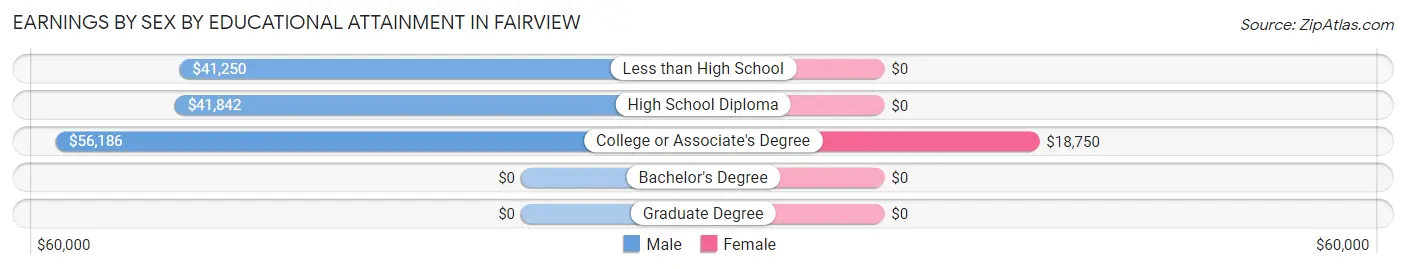
Earnings by Sex by Educational Attainment in Fairview
Average earnings in Fairview are $55,445 for men and $24,250 for women, a difference of 56.3%. Men with an educational attainment of college or associate's degree enjoy the highest average annual earnings of $56,186, while those with less than high school education earn the least with $41,250. Women with an educational attainment of college or associate's degree earn the most with the average annual earnings of $18,750, while those with college or associate's degree education have the smallest earnings of $18,750.
| Educational Attainment | Male Income | Female Income |
| Less than High School | $41,250 | $0 |
| High School Diploma | $41,842 | $0 |
| College or Associate's Degree | $56,186 | $18,750 |
| Bachelor's Degree | - | - |
| Graduate Degree | - | - |
| Total | $55,445 | $24,250 |
Family Income in Fairview
Family Income Brackets in Fairview
According to the Fairview family income data, there are 15 families falling into the $75,000 to $99,999 income range, which is the most common income bracket and makes up 22.1% of all families.
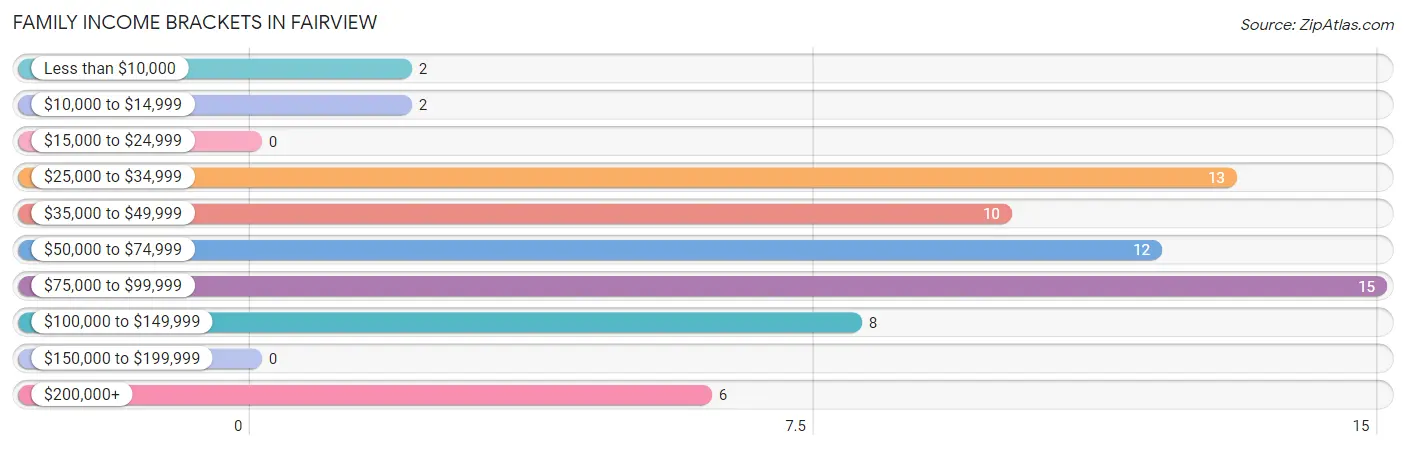
| Income Bracket | # Families | % Families |
| Less than $10,000 | 2 | 2.9% |
| $10,000 to $14,999 | 2 | 2.9% |
| $15,000 to $24,999 | 0 | 0.0% |
| $25,000 to $34,999 | 13 | 19.1% |
| $35,000 to $49,999 | 10 | 14.7% |
| $50,000 to $74,999 | 12 | 17.6% |
| $75,000 to $99,999 | 15 | 22.1% |
| $100,000 to $149,999 | 8 | 11.8% |
| $150,000 to $199,999 | 0 | 0.0% |
| $200,000+ | 6 | 8.8% |
Family Income by Famaliy Size in Fairview
2-person families (49 | 72.1%) account for the highest median family income in Fairview with $73,750 per family, while 2-person families (49 | 72.1%) have the highest median income of $36,875 per family member.
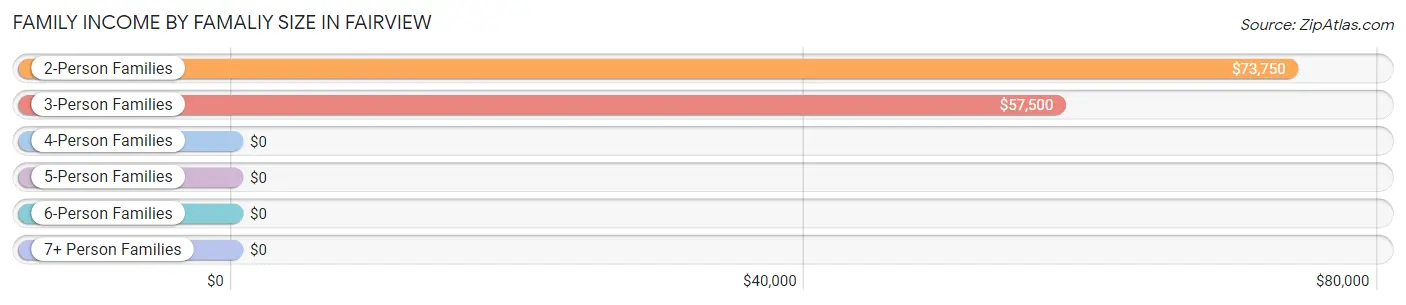
| Income Bracket | # Families | Median Income |
| 2-Person Families | 49 (72.1%) | $73,750 |
| 3-Person Families | 10 (14.7%) | $57,500 |
| 4-Person Families | 1 (1.5%) | $0 |
| 5-Person Families | 8 (11.8%) | $0 |
| 6-Person Families | 0 (0.0%) | $0 |
| 7+ Person Families | 0 (0.0%) | $0 |
| Total | 68 (100.0%) | $63,750 |
Family Income by Number of Earners in Fairview
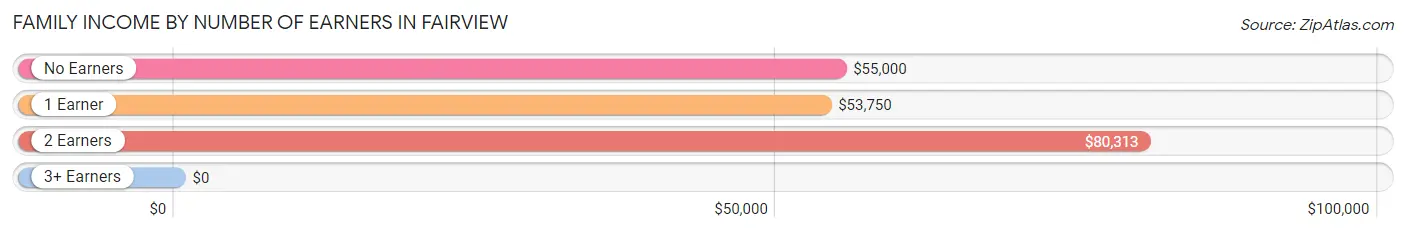
| Number of Earners | # Families | Median Income |
| No Earners | 8 (11.8%) | $55,000 |
| 1 Earner | 18 (26.5%) | $53,750 |
| 2 Earners | 39 (57.4%) | $80,313 |
| 3+ Earners | 3 (4.4%) | $0 |
| Total | 68 (100.0%) | $63,750 |
Household Income in Fairview
Household Income Brackets in Fairview
With 76 households falling in the category, the $50,000 to $74,999 income range is the most frequent in Fairview, accounting for 40.4% of all households.
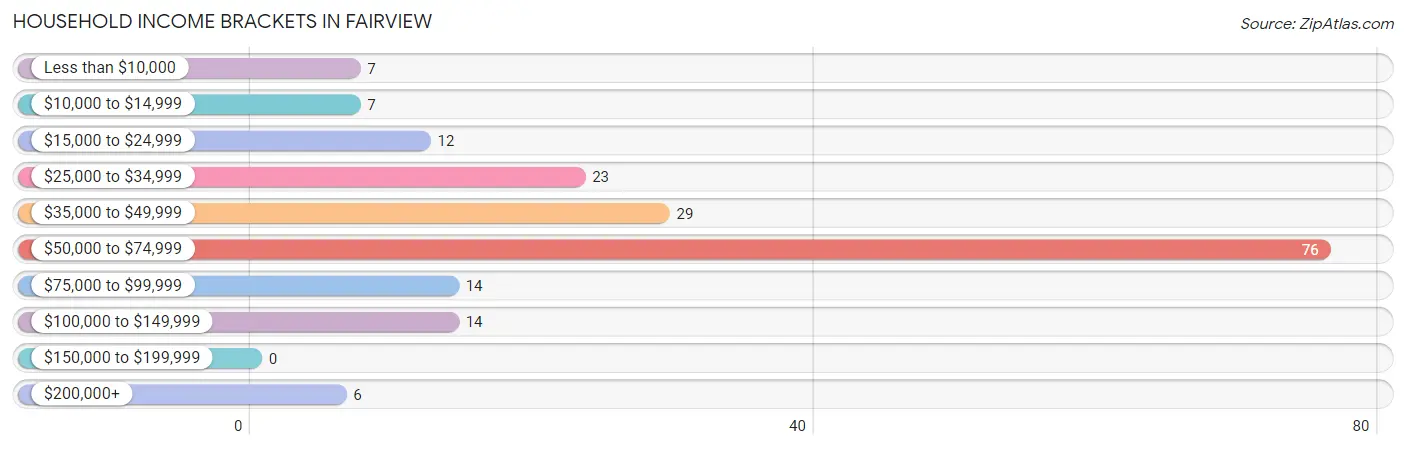
| Income Bracket | # Households | % Households |
| Less than $10,000 | 7 | 3.7% |
| $10,000 to $14,999 | 7 | 3.7% |
| $15,000 to $24,999 | 12 | 6.4% |
| $25,000 to $34,999 | 23 | 12.2% |
| $35,000 to $49,999 | 29 | 15.4% |
| $50,000 to $74,999 | 76 | 40.4% |
| $75,000 to $99,999 | 14 | 7.4% |
| $100,000 to $149,999 | 14 | 7.4% |
| $150,000 to $199,999 | 0 | 0.0% |
| $200,000+ | 6 | 3.2% |
Household Income by Householder Age in Fairview
The median household income in Fairview is $55,369, with the highest median household income of $55,922 found in the 65+ years age bracket for the primary householder. A total of 93 households (49.5%) fall into this category. Meanwhile, the 15 to 24 years age bracket for the primary householder has the lowest median household income of $0, with 4 households (2.1%) in this group.
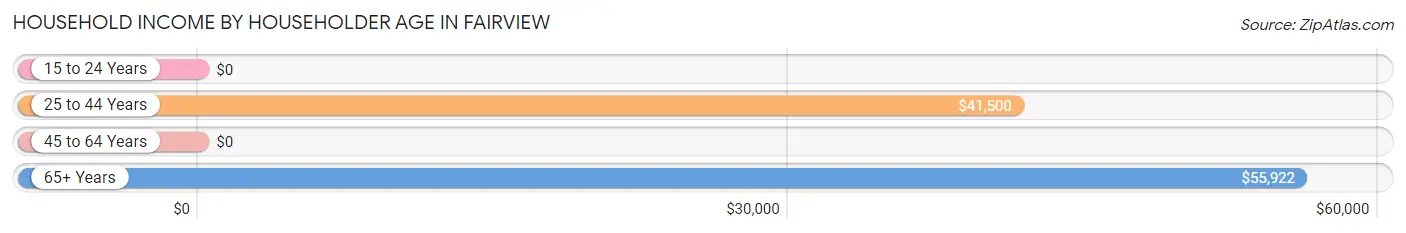
| Income Bracket | # Households | Median Income |
| 15 to 24 Years | 4 (2.1%) | $0 |
| 25 to 44 Years | 38 (20.2%) | $41,500 |
| 45 to 64 Years | 53 (28.2%) | $0 |
| 65+ Years | 93 (49.5%) | $55,922 |
| Total | 188 (100.0%) | $55,369 |
Poverty in Fairview
Income Below Poverty by Sex and Age in Fairview
With 11.5% poverty level for males and 35.8% for females among the residents of Fairview, under 5 year old males and 12 to 14 year old females are the most vulnerable to poverty, with 6 males (54.5%) and 8 females (100.0%) in their respective age groups living below the poverty level.
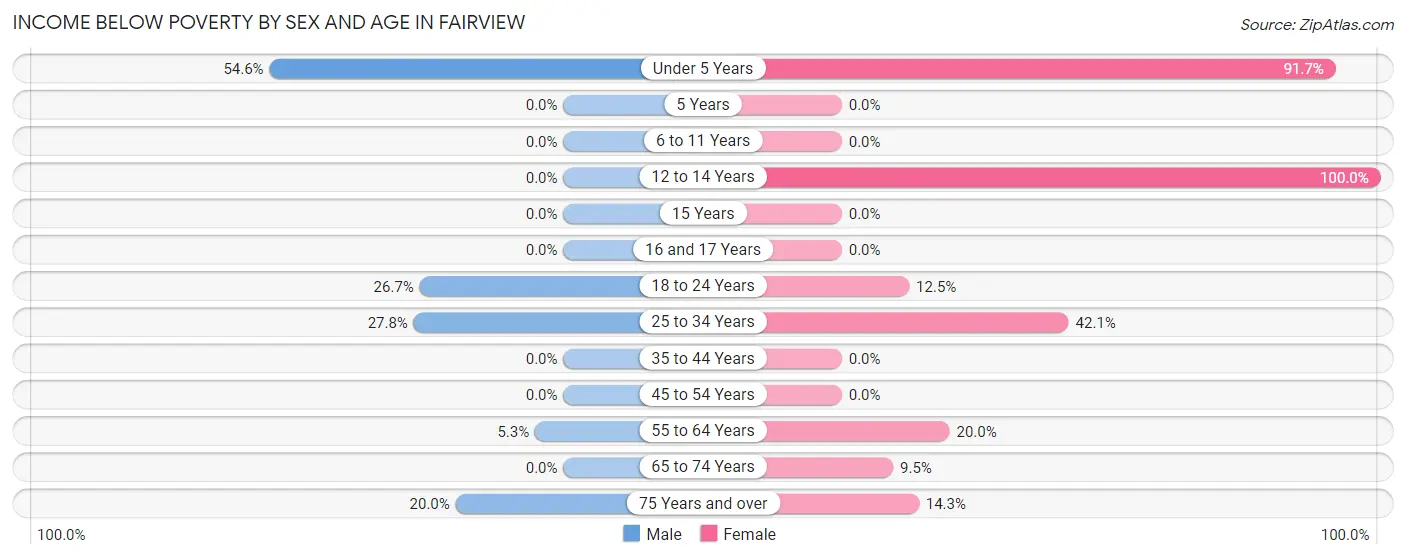
| Age Bracket | Male | Female |
| Under 5 Years | 6 (54.5%) | 22 (91.7%) |
| 5 Years | 0 (0.0%) | 0 (0.0%) |
| 6 to 11 Years | 0 (0.0%) | 0 (0.0%) |
| 12 to 14 Years | 0 (0.0%) | 8 (100.0%) |
| 15 Years | 0 (0.0%) | 0 (0.0%) |
| 16 and 17 Years | 0 (0.0%) | 0 (0.0%) |
| 18 to 24 Years | 4 (26.7%) | 1 (12.5%) |
| 25 to 34 Years | 10 (27.8%) | 8 (42.1%) |
| 35 to 44 Years | 0 (0.0%) | 0 (0.0%) |
| 45 to 54 Years | 0 (0.0%) | 0 (0.0%) |
| 55 to 64 Years | 2 (5.3%) | 6 (20.0%) |
| 65 to 74 Years | 0 (0.0%) | 2 (9.5%) |
| 75 Years and over | 1 (20.0%) | 1 (14.3%) |
| Total | 23 (11.5%) | 48 (35.8%) |
Income Above Poverty by Sex and Age in Fairview
According to the poverty statistics in Fairview, males aged 6 to 11 years and females aged 35 to 44 years are the age groups that are most secure financially, with 100.0% of males and 100.0% of females in these age groups living above the poverty line.
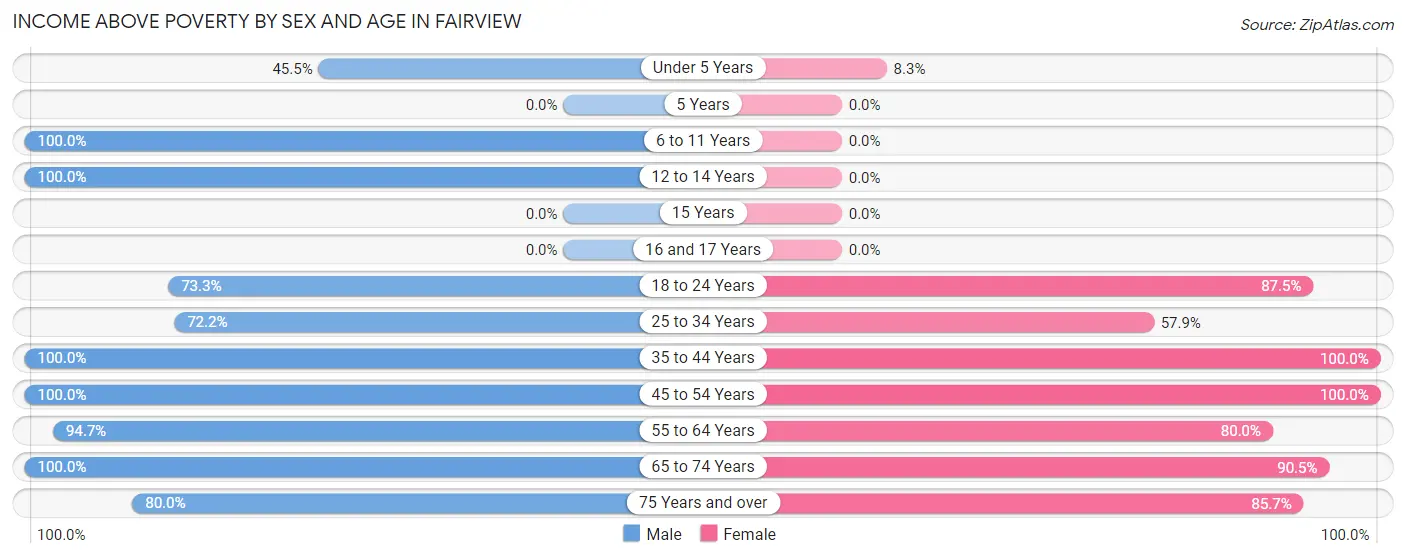
| Age Bracket | Male | Female |
| Under 5 Years | 5 (45.5%) | 2 (8.3%) |
| 5 Years | 0 (0.0%) | 0 (0.0%) |
| 6 to 11 Years | 1 (100.0%) | 0 (0.0%) |
| 12 to 14 Years | 5 (100.0%) | 0 (0.0%) |
| 15 Years | 0 (0.0%) | 0 (0.0%) |
| 16 and 17 Years | 0 (0.0%) | 0 (0.0%) |
| 18 to 24 Years | 11 (73.3%) | 7 (87.5%) |
| 25 to 34 Years | 26 (72.2%) | 11 (57.9%) |
| 35 to 44 Years | 5 (100.0%) | 13 (100.0%) |
| 45 to 54 Years | 9 (100.0%) | 4 (100.0%) |
| 55 to 64 Years | 36 (94.7%) | 24 (80.0%) |
| 65 to 74 Years | 75 (100.0%) | 19 (90.5%) |
| 75 Years and over | 4 (80.0%) | 6 (85.7%) |
| Total | 177 (88.5%) | 86 (64.2%) |
Income Below Poverty Among Married-Couple Families in Fairview
The poverty statistics for married-couple families in Fairview show that 19.6% or 10 of the total 51 families live below the poverty line. Families with 3 or 4 children have the highest poverty rate of 100.0%, comprising of 8 families. On the other hand, families with 1 or 2 children have the lowest poverty rate of 0.0%, which includes 0 families.
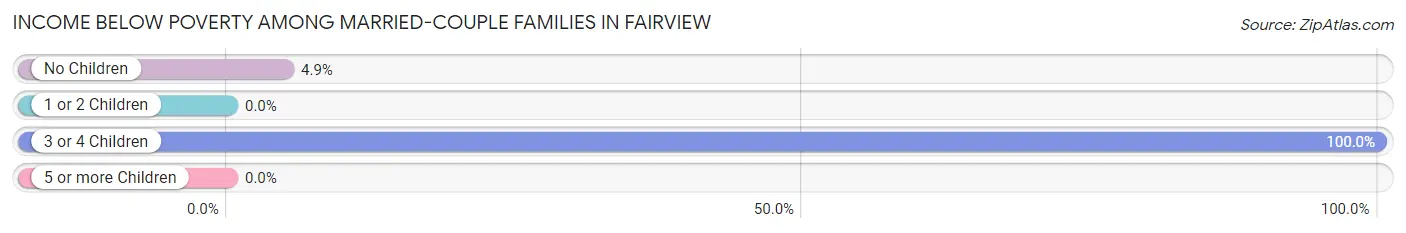
| Children | Above Poverty | Below Poverty |
| No Children | 39 (95.1%) | 2 (4.9%) |
| 1 or 2 Children | 2 (100.0%) | 0 (0.0%) |
| 3 or 4 Children | 0 (0.0%) | 8 (100.0%) |
| 5 or more Children | 0 (0.0%) | 0 (0.0%) |
| Total | 41 (80.4%) | 10 (19.6%) |
Income Below Poverty Among Single-Parent Households in Fairview
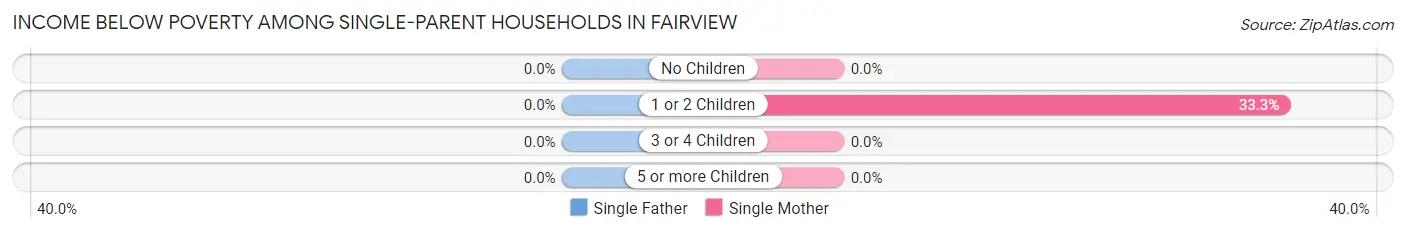
| Children | Single Father | Single Mother |
| No Children | 0 (0.0%) | 0 (0.0%) |
| 1 or 2 Children | 0 (0.0%) | 2 (33.3%) |
| 3 or 4 Children | 0 (0.0%) | 0 (0.0%) |
| 5 or more Children | 0 (0.0%) | 0 (0.0%) |
| Total | 0 (0.0%) | 2 (13.3%) |
Income Below Poverty Among Married-Couple vs Single-Parent Households in Fairview
The poverty data for Fairview shows that 10 of the married-couple family households (19.6%) and 2 of the single-parent households (11.8%) are living below the poverty level. Within the married-couple family households, those with 3 or 4 children have the highest poverty rate, with 8 households (100.0%) falling below the poverty line. Among the single-parent households, those with 1 or 2 children have the highest poverty rate, with 2 household (33.3%) living below poverty.
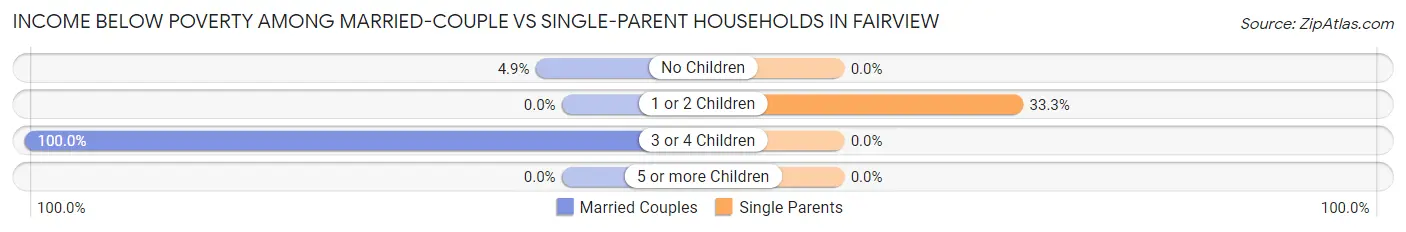
| Children | Married-Couple Families | Single-Parent Households |
| No Children | 2 (4.9%) | 0 (0.0%) |
| 1 or 2 Children | 0 (0.0%) | 2 (33.3%) |
| 3 or 4 Children | 8 (100.0%) | 0 (0.0%) |
| 5 or more Children | 0 (0.0%) | 0 (0.0%) |
| Total | 10 (19.6%) | 2 (11.8%) |
Race in Fairview
The most populous races in Fairview are White / Caucasian (279 | 83.5%), Hispanic or Latino (47 | 14.1%), and Some other Race (26 | 7.8%).
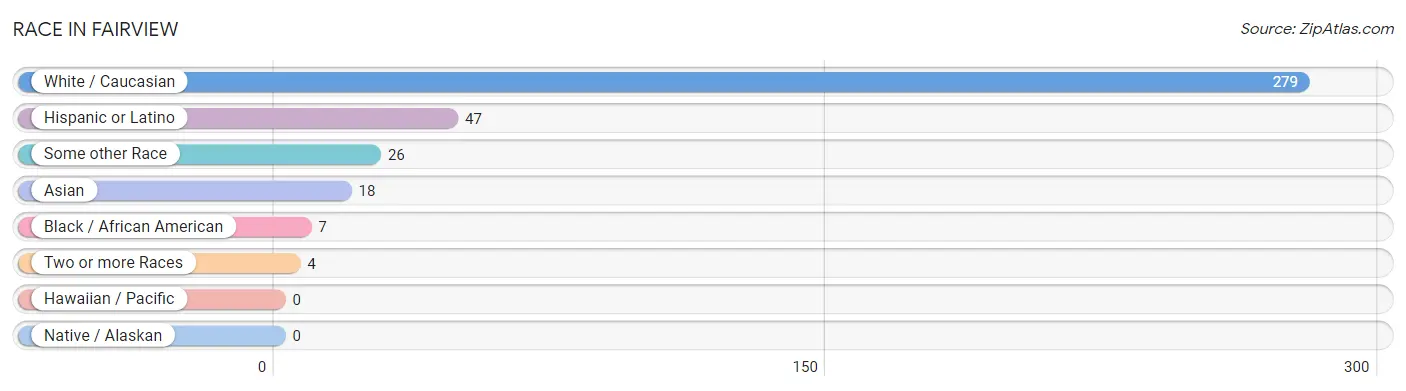
| Race | # Population | % Population |
| Asian | 18 | 5.4% |
| Black / African American | 7 | 2.1% |
| Hawaiian / Pacific | 0 | 0.0% |
| Hispanic or Latino | 47 | 14.1% |
| Native / Alaskan | 0 | 0.0% |
| White / Caucasian | 279 | 83.5% |
| Two or more Races | 4 | 1.2% |
| Some other Race | 26 | 7.8% |
| Total | 334 | 100.0% |
Ancestry in Fairview
The most populous ancestries reported in Fairview are German (123 | 36.8%), English (25 | 7.5%), American (20 | 6.0%), Polish (16 | 4.8%), and Dutch (13 | 3.9%), together accounting for 59.0% of all Fairview residents.
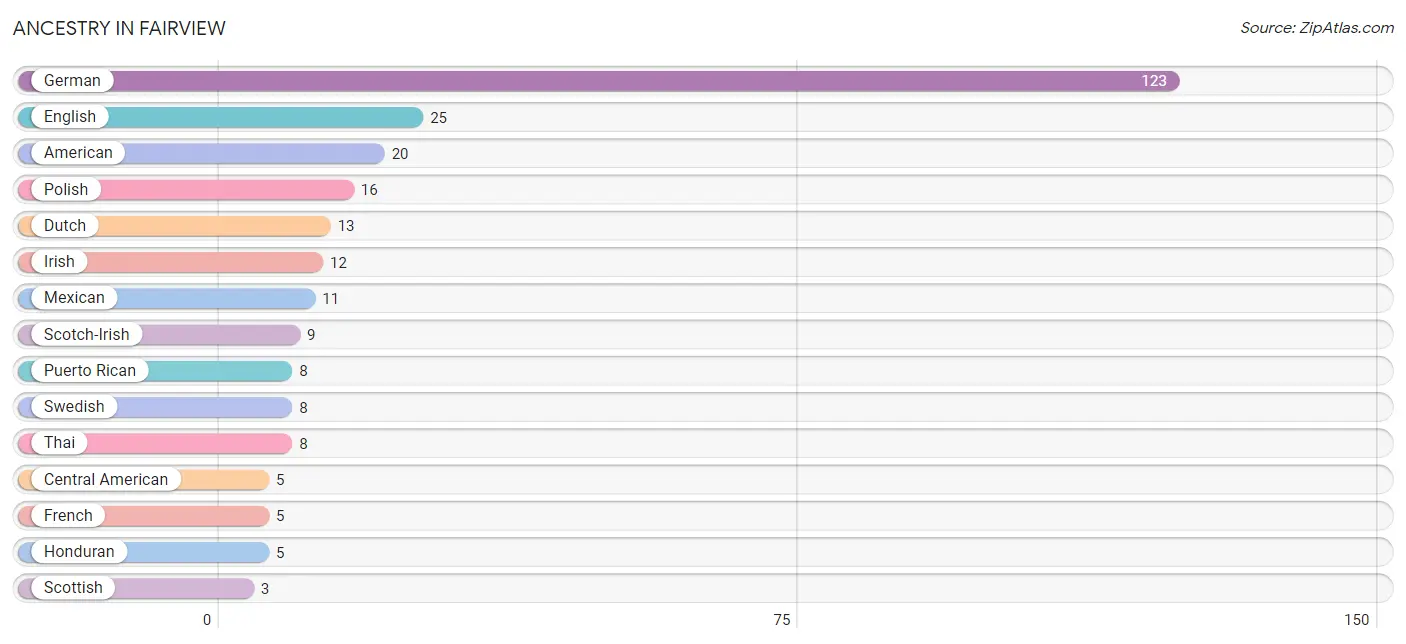
| Ancestry | # Population | % Population |
| American | 20 | 6.0% |
| Central American | 5 | 1.5% |
| Danish | 1 | 0.3% |
| Dutch | 13 | 3.9% |
| English | 25 | 7.5% |
| French | 5 | 1.5% |
| German | 123 | 36.8% |
| Honduran | 5 | 1.5% |
| Irish | 12 | 3.6% |
| Korean | 2 | 0.6% |
| Mexican | 11 | 3.3% |
| Norwegian | 1 | 0.3% |
| Polish | 16 | 4.8% |
| Puerto Rican | 8 | 2.4% |
| Russian | 2 | 0.6% |
| Scotch-Irish | 9 | 2.7% |
| Scottish | 3 | 0.9% |
| Swedish | 8 | 2.4% |
| Thai | 8 | 2.4% |
| Welsh | 1 | 0.3% | View All 20 Rows |
Immigrants in Fairview
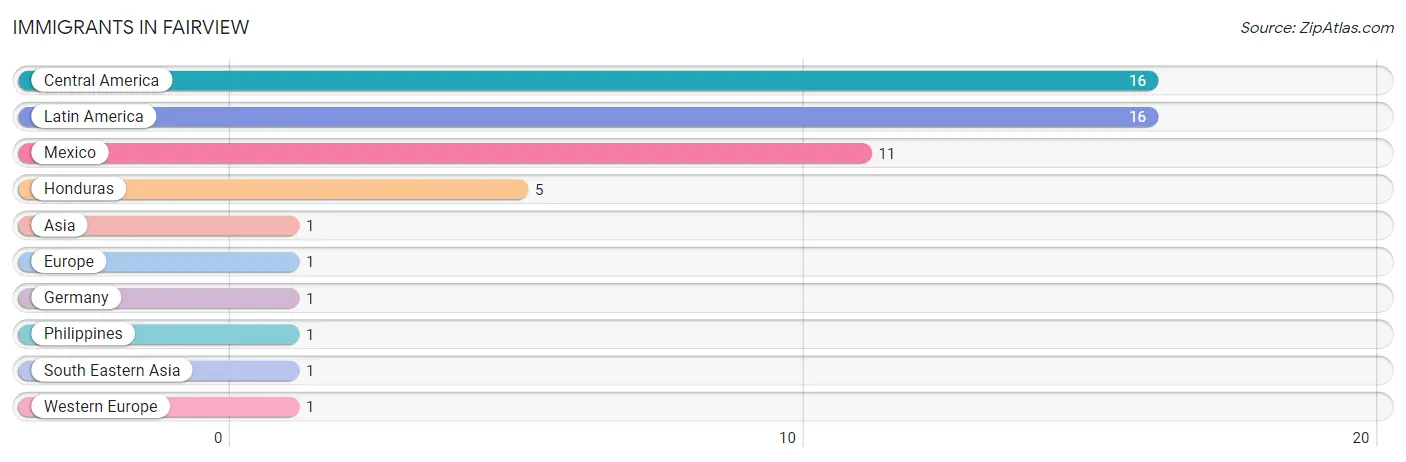
The most numerous immigrant groups reported in Fairview came from Central America (16 | 4.8%), Latin America (16 | 4.8%), Mexico (11 | 3.3%), Honduras (5 | 1.5%), and Asia (1 | 0.3%), together accounting for 14.7% of all Fairview residents.
| Immigration Origin | # Population | % Population |
| Asia | 1 | 0.3% |
| Central America | 16 | 4.8% |
| Europe | 1 | 0.3% |
| Germany | 1 | 0.3% |
| Honduras | 5 | 1.5% |
| Latin America | 16 | 4.8% |
| Mexico | 11 | 3.3% |
| Philippines | 1 | 0.3% |
| South Eastern Asia | 1 | 0.3% |
| Western Europe | 1 | 0.3% | View All 10 Rows |
Sex and Age in Fairview
Sex and Age in Fairview
The most populous age groups in Fairview are 65 to 69 Years (71 | 35.5%) for men and 60 to 64 Years (26 | 19.4%) for women.
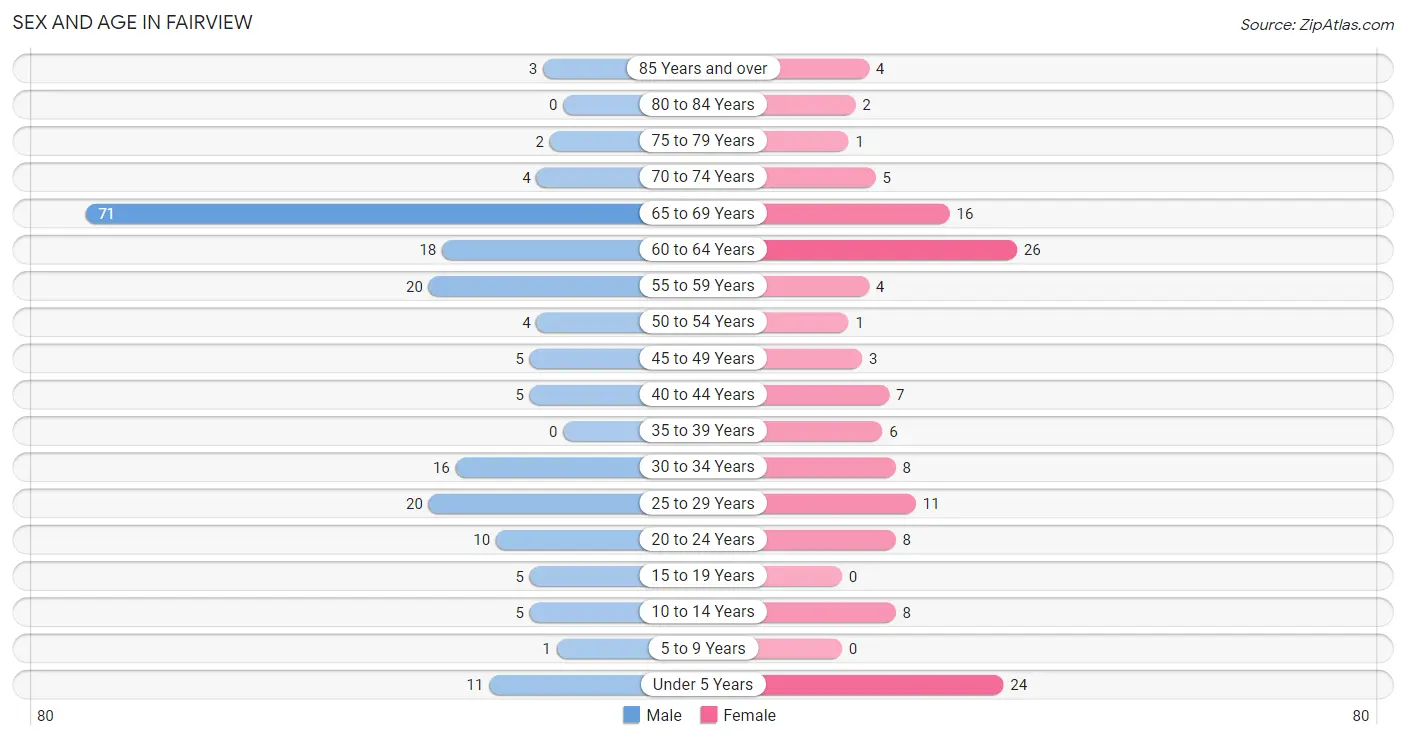
| Age Bracket | Male | Female |
| Under 5 Years | 11 (5.5%) | 24 (17.9%) |
| 5 to 9 Years | 1 (0.5%) | 0 (0.0%) |
| 10 to 14 Years | 5 (2.5%) | 8 (6.0%) |
| 15 to 19 Years | 5 (2.5%) | 0 (0.0%) |
| 20 to 24 Years | 10 (5.0%) | 8 (6.0%) |
| 25 to 29 Years | 20 (10.0%) | 11 (8.2%) |
| 30 to 34 Years | 16 (8.0%) | 8 (6.0%) |
| 35 to 39 Years | 0 (0.0%) | 6 (4.5%) |
| 40 to 44 Years | 5 (2.5%) | 7 (5.2%) |
| 45 to 49 Years | 5 (2.5%) | 3 (2.2%) |
| 50 to 54 Years | 4 (2.0%) | 1 (0.7%) |
| 55 to 59 Years | 20 (10.0%) | 4 (3.0%) |
| 60 to 64 Years | 18 (9.0%) | 26 (19.4%) |
| 65 to 69 Years | 71 (35.5%) | 16 (11.9%) |
| 70 to 74 Years | 4 (2.0%) | 5 (3.7%) |
| 75 to 79 Years | 2 (1.0%) | 1 (0.7%) |
| 80 to 84 Years | 0 (0.0%) | 2 (1.5%) |
| 85 Years and over | 3 (1.5%) | 4 (3.0%) |
| Total | 200 (100.0%) | 134 (100.0%) |
Families and Households in Fairview
Median Family Size in Fairview
The median family size in Fairview is 2.99 persons per family, with single male/father families (2 | 2.9%) accounting for the largest median family size of 4 persons per family. On the other hand, married-couple families (51 | 75.0%) represent the smallest median family size with 2.80 persons per family.
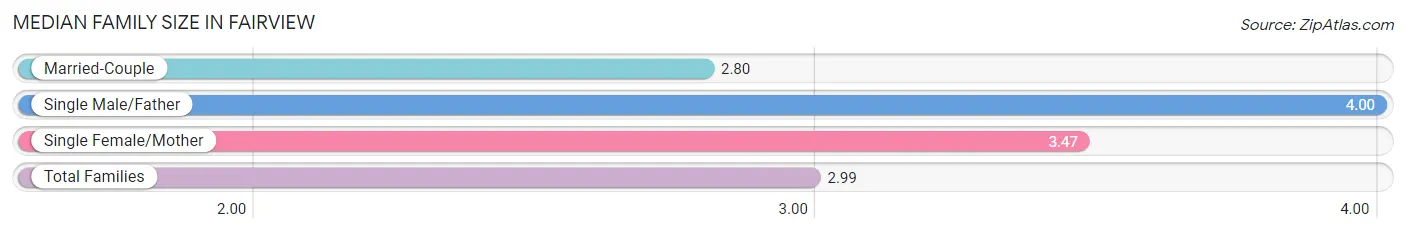
| Family Type | # Families | Family Size |
| Married-Couple | 51 (75.0%) | 2.80 |
| Single Male/Father | 2 (2.9%) | 4.00 |
| Single Female/Mother | 15 (22.1%) | 3.47 |
| Total Families | 68 (100.0%) | 2.99 |
Median Household Size in Fairview
The median household size in Fairview is 1.78 persons per household, with single male/father households (2 | 1.1%) accounting for the largest median household size of 4 persons per household. non-family households (120 | 63.8%) represent the smallest median household size with 1.05 persons per household.
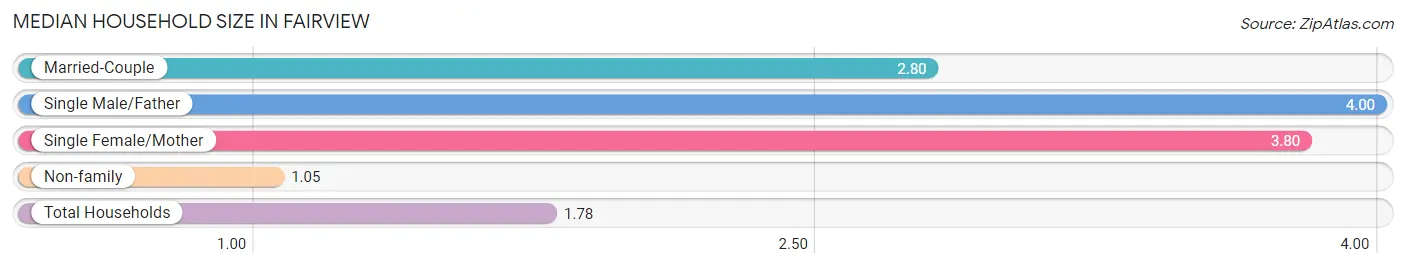
| Household Type | # Households | Household Size |
| Married-Couple | 51 (27.1%) | 2.80 |
| Single Male/Father | 2 (1.1%) | 4.00 |
| Single Female/Mother | 15 (8.0%) | 3.80 |
| Non-family | 120 (63.8%) | 1.05 |
| Total Households | 188 (100.0%) | 1.78 |
Household Size by Marriage Status in Fairview
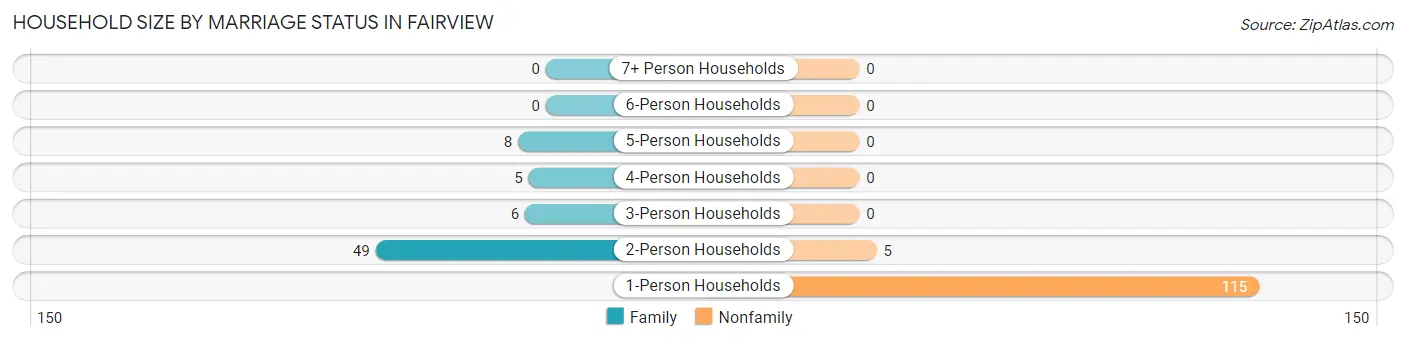
Out of a total of 188 households in Fairview, 68 (36.2%) are family households, while 120 (63.8%) are nonfamily households. The most numerous type of family households are 2-person households, comprising 49, and the most common type of nonfamily households are 1-person households, comprising 115.
| Household Size | Family Households | Nonfamily Households |
| 1-Person Households | - | 115 (61.2%) |
| 2-Person Households | 49 (26.1%) | 5 (2.7%) |
| 3-Person Households | 6 (3.2%) | 0 (0.0%) |
| 4-Person Households | 5 (2.7%) | 0 (0.0%) |
| 5-Person Households | 8 (4.3%) | 0 (0.0%) |
| 6-Person Households | 0 (0.0%) | 0 (0.0%) |
| 7+ Person Households | 0 (0.0%) | 0 (0.0%) |
| Total | 68 (36.2%) | 120 (63.8%) |
Female Fertility in Fairview
Fertility by Age in Fairview
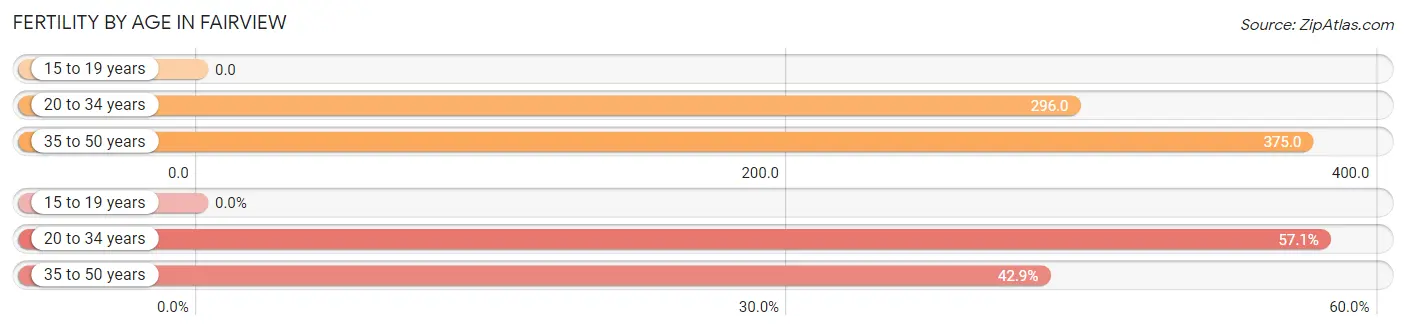
Average fertility rate in Fairview is 326.0 births per 1,000 women. Women in the age bracket of 35 to 50 years have the highest fertility rate with 375.0 births per 1,000 women. Women in the age bracket of 20 to 34 years acount for 57.1% of all women with births.
| Age Bracket | Women with Births | Births / 1,000 Women |
| 15 to 19 years | 0 (0.0%) | 0.0 |
| 20 to 34 years | 8 (57.1%) | 296.0 |
| 35 to 50 years | 6 (42.9%) | 375.0 |
| Total | 14 (100.0%) | 326.0 |
Fertility by Age by Marriage Status in Fairview
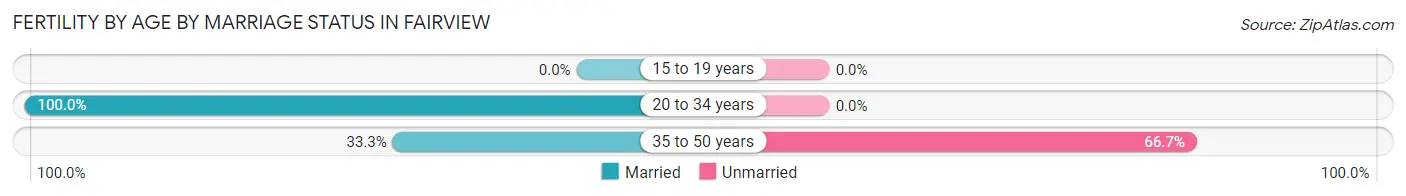
71.4% of women with births (14) in Fairview are married. The highest percentage of unmarried women with births falls into 35 to 50 years age bracket with 66.7% of them unmarried at the time of birth, while the lowest percentage of unmarried women with births belong to 20 to 34 years age bracket with 0.0% of them unmarried.
| Age Bracket | Married | Unmarried |
| 15 to 19 years | 0 (0.0%) | 0 (0.0%) |
| 20 to 34 years | 8 (100.0%) | 0 (0.0%) |
| 35 to 50 years | 2 (33.3%) | 4 (66.7%) |
| Total | 10 (71.4%) | 4 (28.6%) |
Fertility by Education in Fairview
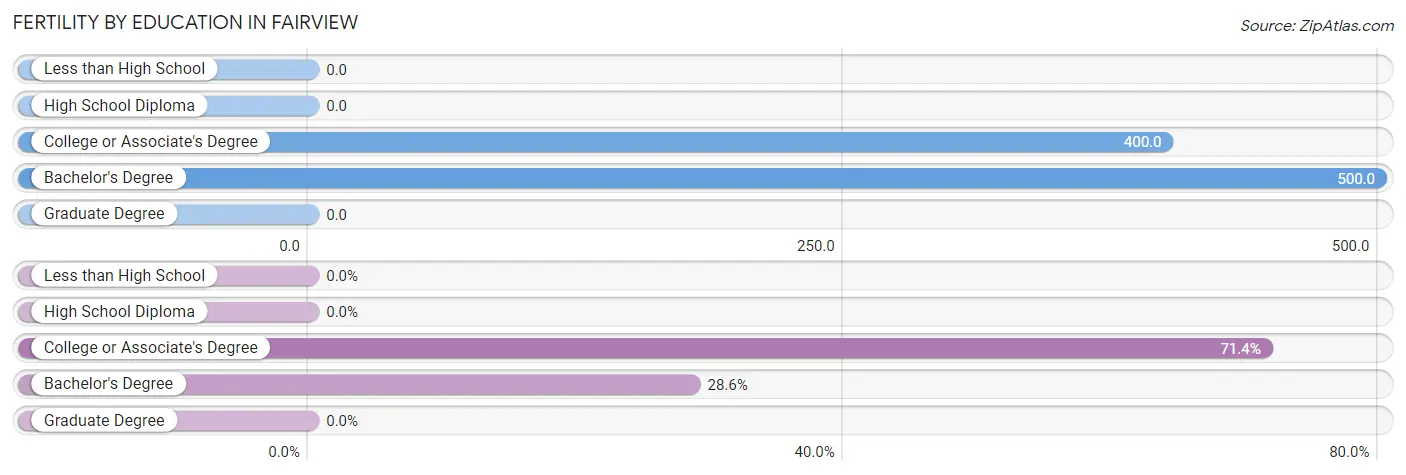
| Educational Attainment | Women with Births | Births / 1,000 Women |
| Less than High School | 0 (0.0%) | 0.0 |
| High School Diploma | 0 (0.0%) | 0.0 |
| College or Associate's Degree | 10 (71.4%) | 400.0 |
| Bachelor's Degree | 4 (28.6%) | 500.0 |
| Graduate Degree | 0 (0.0%) | 0.0 |
| Total | 14 (100.0%) | 326.0 |
Fertility by Education by Marriage Status in Fairview
28.6% of women with births in Fairview are unmarried. Women with the educational attainment of college or associate's degree are most likely to be married with 100.0% of them married at childbirth, while women with the educational attainment of bachelor's degree are least likely to be married with 100.0% of them unmarried at childbirth.
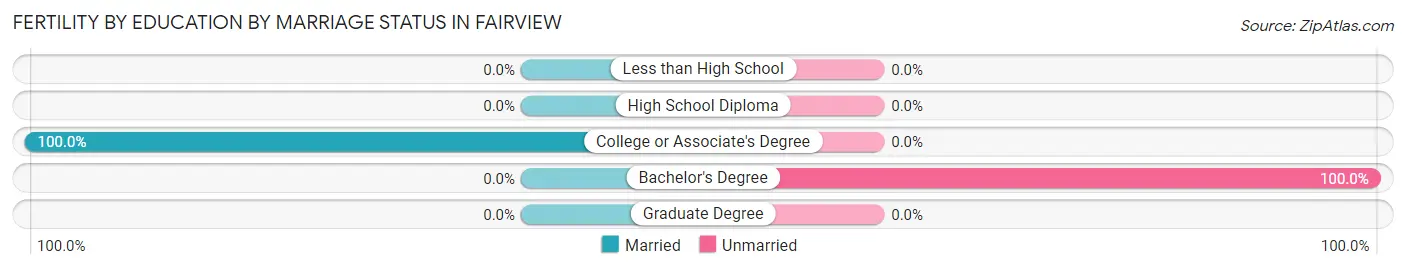
| Educational Attainment | Married | Unmarried |
| Less than High School | 0 (0.0%) | 0 (0.0%) |
| High School Diploma | 0 (0.0%) | 0 (0.0%) |
| College or Associate's Degree | 10 (100.0%) | 0 (0.0%) |
| Bachelor's Degree | 0 (0.0%) | 4 (100.0%) |
| Graduate Degree | 0 (0.0%) | 0 (0.0%) |
| Total | 10 (71.4%) | 4 (28.6%) |
Employment Characteristics in Fairview
Employment by Class of Employer in Fairview
Among the 219 employed individuals in Fairview, private company employees (168 | 76.7%), self-employed (not incorporated) (20 | 9.1%), and not-for-profit organizations (14 | 6.4%) make up the most common classes of employment.
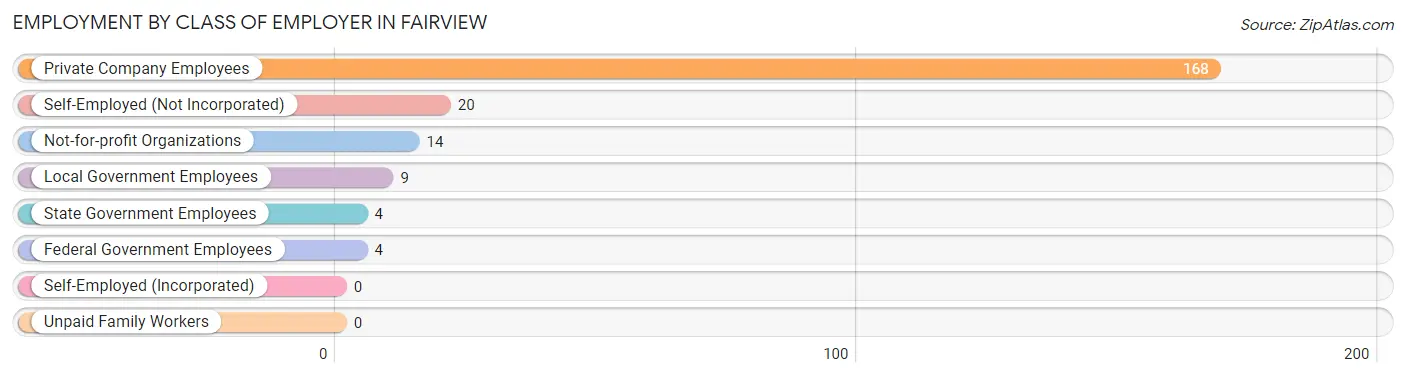
| Employer Class | # Employees | % Employees |
| Private Company Employees | 168 | 76.7% |
| Self-Employed (Incorporated) | 0 | 0.0% |
| Self-Employed (Not Incorporated) | 20 | 9.1% |
| Not-for-profit Organizations | 14 | 6.4% |
| Local Government Employees | 9 | 4.1% |
| State Government Employees | 4 | 1.8% |
| Federal Government Employees | 4 | 1.8% |
| Unpaid Family Workers | 0 | 0.0% |
| Total | 219 | 100.0% |
Employment Status by Age in Fairview
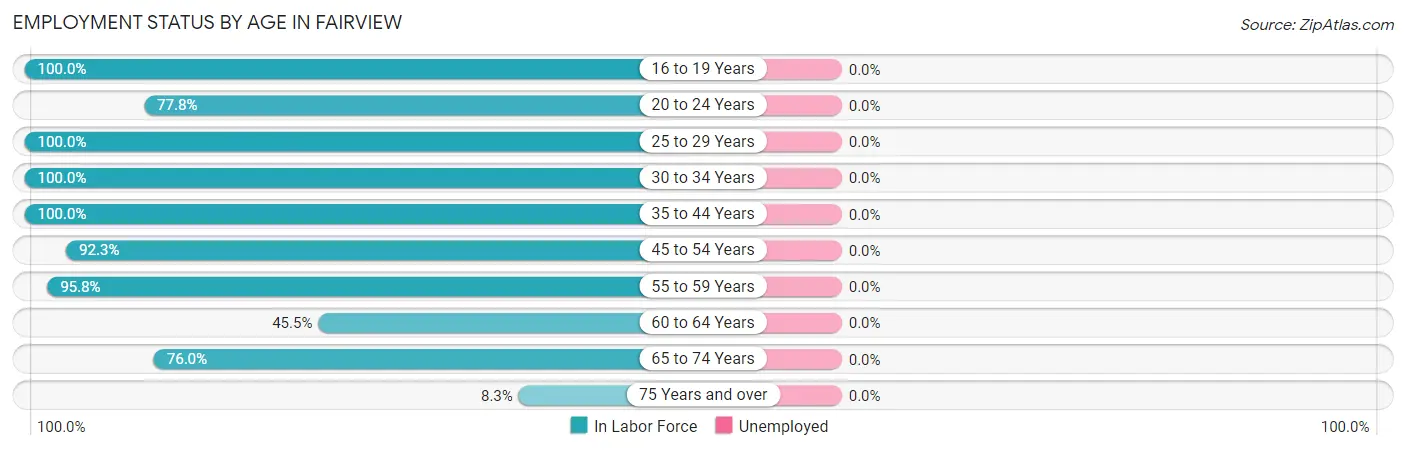
| Age Bracket | In Labor Force | Unemployed |
| 16 to 19 Years | 5 (100.0%) | 0 (0.0%) |
| 20 to 24 Years | 14 (77.8%) | 0 (0.0%) |
| 25 to 29 Years | 31 (100.0%) | 0 (0.0%) |
| 30 to 34 Years | 24 (100.0%) | 0 (0.0%) |
| 35 to 44 Years | 18 (100.0%) | 0 (0.0%) |
| 45 to 54 Years | 12 (92.3%) | 0 (0.0%) |
| 55 to 59 Years | 23 (95.8%) | 0 (0.0%) |
| 60 to 64 Years | 20 (45.5%) | 0 (0.0%) |
| 65 to 74 Years | 73 (76.0%) | 0 (0.0%) |
| 75 Years and over | 1 (8.3%) | 0 (0.0%) |
| Total | 221 (77.5%) | 0 (0.0%) |
Employment Status by Educational Attainment in Fairview
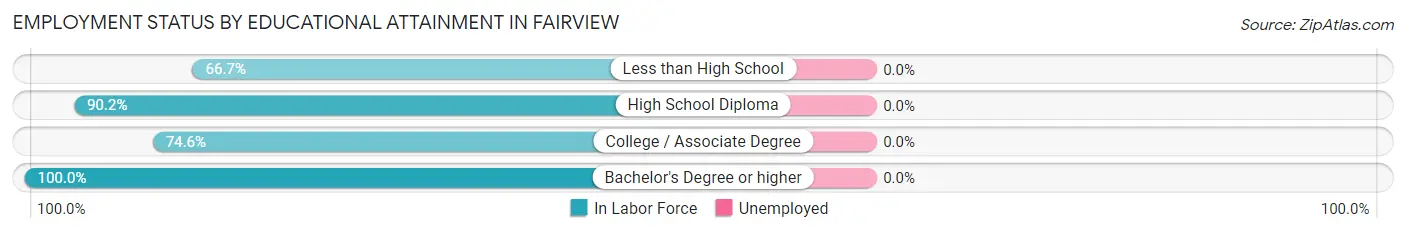
| Educational Attainment | In Labor Force | Unemployed |
| Less than High School | 8 (66.7%) | 0 (0.0%) |
| High School Diploma | 46 (90.2%) | 0 (0.0%) |
| College / Associate Degree | 50 (74.6%) | 0 (0.0%) |
| Bachelor's Degree or higher | 24 (100.0%) | 0 (0.0%) |
| Total | 128 (83.1%) | 0 (0.0%) |
Employment Occupations by Sex in Fairview
Management, Business, Science and Arts Occupations
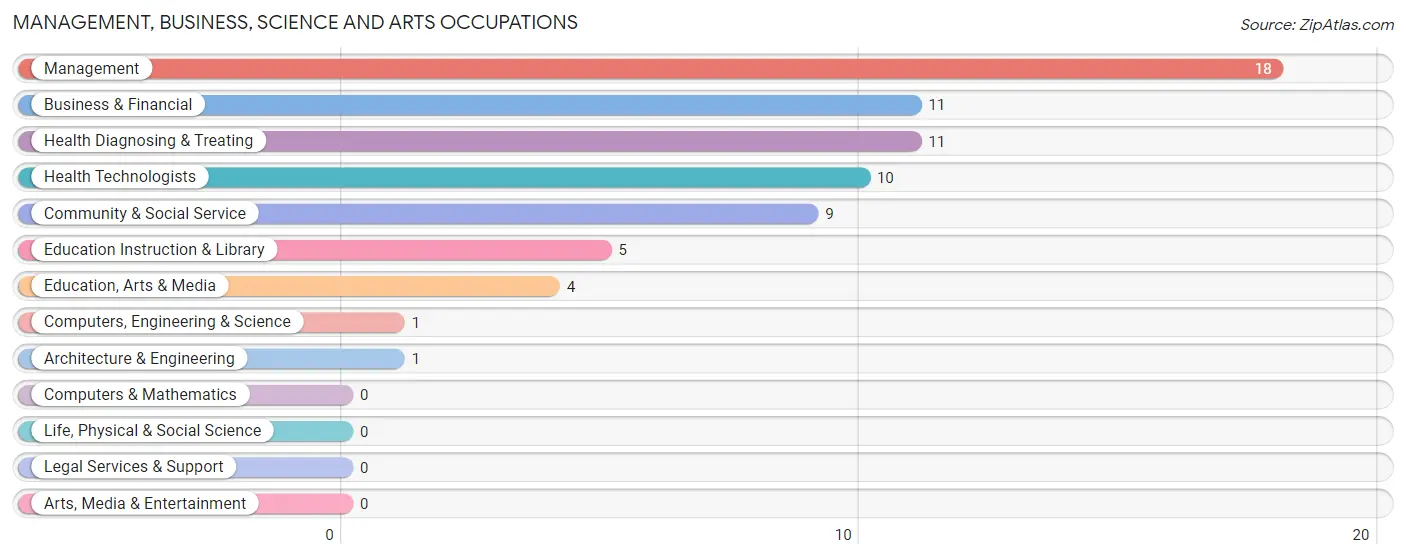
The most common Management, Business, Science and Arts occupations in Fairview are Management (18 | 8.1%), Business & Financial (11 | 5.0%), Health Diagnosing & Treating (11 | 5.0%), Health Technologists (10 | 4.5%), and Community & Social Service (9 | 4.1%).
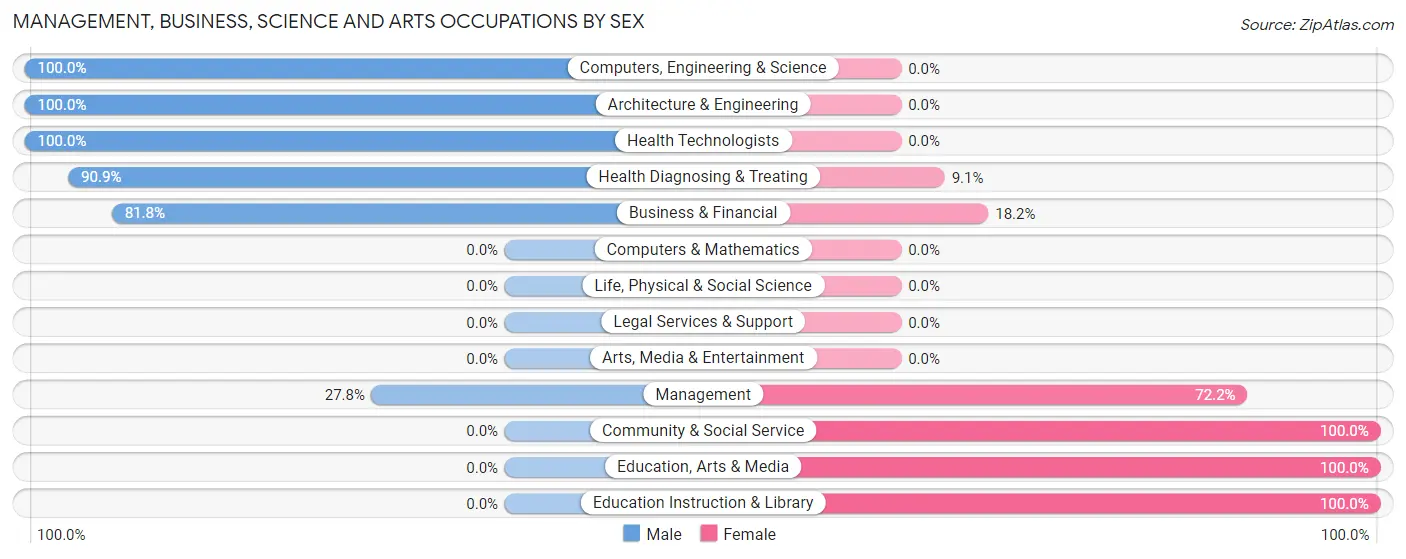
Management, Business, Science and Arts Occupations by Sex
Within the Management, Business, Science and Arts occupations in Fairview, the most male-oriented occupations are Computers, Engineering & Science (100.0%), Architecture & Engineering (100.0%), and Health Technologists (100.0%), while the most female-oriented occupations are Community & Social Service (100.0%), Education, Arts & Media (100.0%), and Education Instruction & Library (100.0%).
| Occupation | Male | Female |
| Management | 5 (27.8%) | 13 (72.2%) |
| Business & Financial | 9 (81.8%) | 2 (18.2%) |
| Computers, Engineering & Science | 1 (100.0%) | 0 (0.0%) |
| Computers & Mathematics | 0 (0.0%) | 0 (0.0%) |
| Architecture & Engineering | 1 (100.0%) | 0 (0.0%) |
| Life, Physical & Social Science | 0 (0.0%) | 0 (0.0%) |
| Community & Social Service | 0 (0.0%) | 9 (100.0%) |
| Education, Arts & Media | 0 (0.0%) | 4 (100.0%) |
| Legal Services & Support | 0 (0.0%) | 0 (0.0%) |
| Education Instruction & Library | 0 (0.0%) | 5 (100.0%) |
| Arts, Media & Entertainment | 0 (0.0%) | 0 (0.0%) |
| Health Diagnosing & Treating | 10 (90.9%) | 1 (9.1%) |
| Health Technologists | 10 (100.0%) | 0 (0.0%) |
| Total (Category) | 25 (50.0%) | 25 (50.0%) |
| Total (Overall) | 158 (71.5%) | 63 (28.5%) |
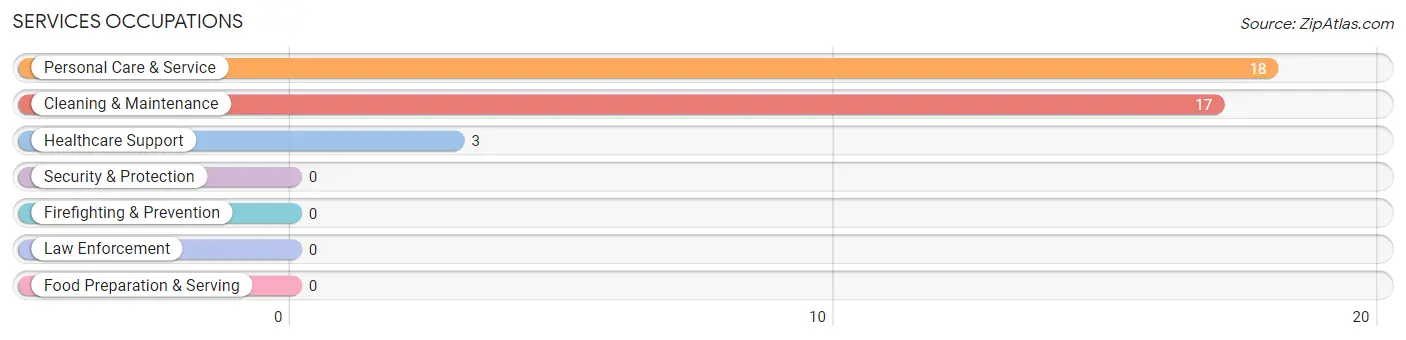
Services Occupations
The most common Services occupations in Fairview are Personal Care & Service (18 | 8.1%), Cleaning & Maintenance (17 | 7.7%), and Healthcare Support (3 | 1.4%).
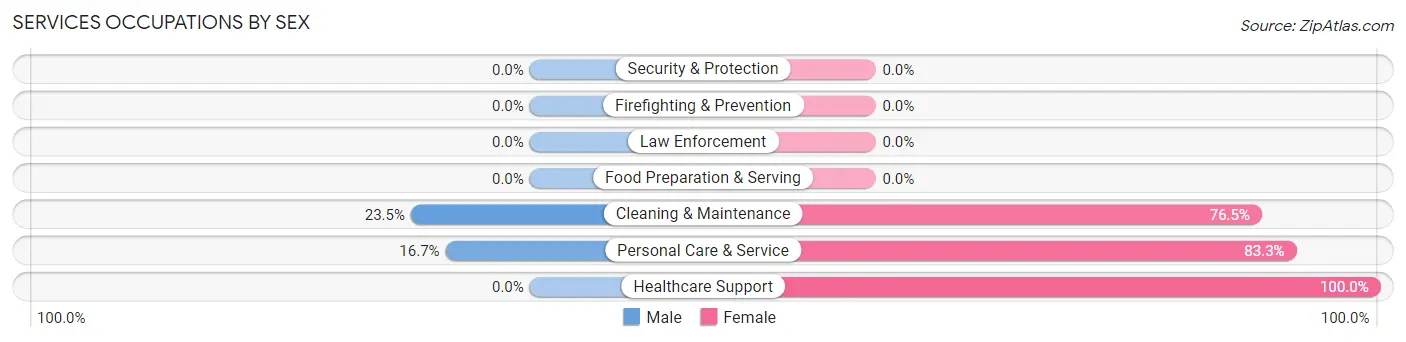
Services Occupations by Sex
Within the Services occupations in Fairview, the most male-oriented occupations are Cleaning & Maintenance (23.5%), and Personal Care & Service (16.7%), while the most female-oriented occupations are Healthcare Support (100.0%), Personal Care & Service (83.3%), and Cleaning & Maintenance (76.5%).
| Occupation | Male | Female |
| Healthcare Support | 0 (0.0%) | 3 (100.0%) |
| Security & Protection | 0 (0.0%) | 0 (0.0%) |
| Firefighting & Prevention | 0 (0.0%) | 0 (0.0%) |
| Law Enforcement | 0 (0.0%) | 0 (0.0%) |
| Food Preparation & Serving | 0 (0.0%) | 0 (0.0%) |
| Cleaning & Maintenance | 4 (23.5%) | 13 (76.5%) |
| Personal Care & Service | 3 (16.7%) | 15 (83.3%) |
| Total (Category) | 7 (18.4%) | 31 (81.6%) |
| Total (Overall) | 158 (71.5%) | 63 (28.5%) |
Sales and Office Occupations
The most common Sales and Office occupations in Fairview are Office & Administration (16 | 7.2%), and Sales & Related (1 | 0.4%).
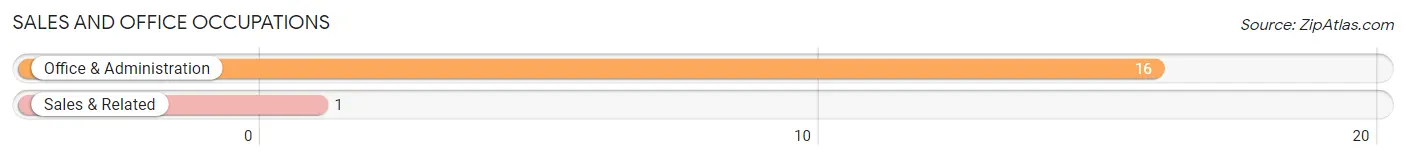
Sales and Office Occupations by Sex

| Occupation | Male | Female |
| Sales & Related | 1 (100.0%) | 0 (0.0%) |
| Office & Administration | 9 (56.2%) | 7 (43.8%) |
| Total (Category) | 10 (58.8%) | 7 (41.2%) |
| Total (Overall) | 158 (71.5%) | 63 (28.5%) |
Natural Resources, Construction and Maintenance Occupations
The most common Natural Resources, Construction and Maintenance occupations in Fairview are , and Construction & Extraction (4 | 1.8%).
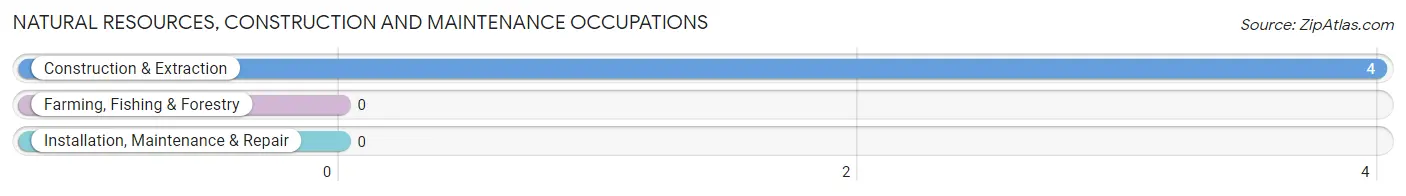
Natural Resources, Construction and Maintenance Occupations by Sex
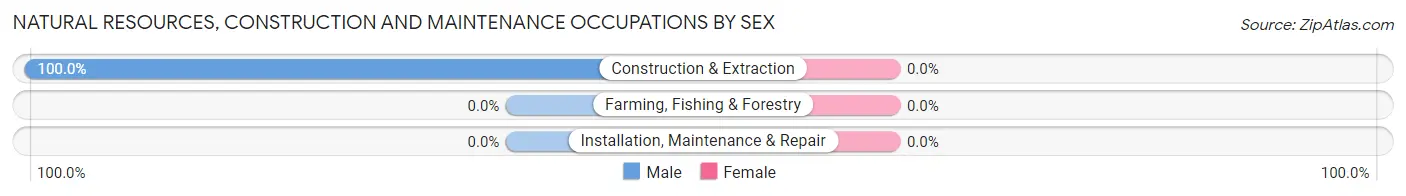
| Occupation | Male | Female |
| Farming, Fishing & Forestry | 0 (0.0%) | 0 (0.0%) |
| Construction & Extraction | 4 (100.0%) | 0 (0.0%) |
| Installation, Maintenance & Repair | 0 (0.0%) | 0 (0.0%) |
| Total (Category) | 4 (100.0%) | 0 (0.0%) |
| Total (Overall) | 158 (71.5%) | 63 (28.5%) |
Production, Transportation and Moving Occupations
The most common Production, Transportation and Moving occupations in Fairview are Transportation (75 | 33.9%), Production (26 | 11.8%), and Material Moving (11 | 5.0%).
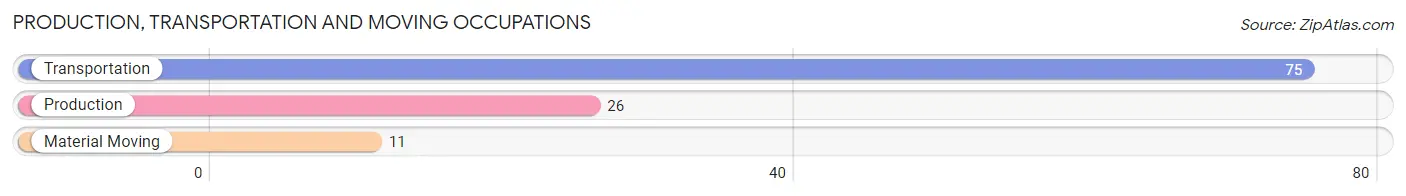
Production, Transportation and Moving Occupations by Sex
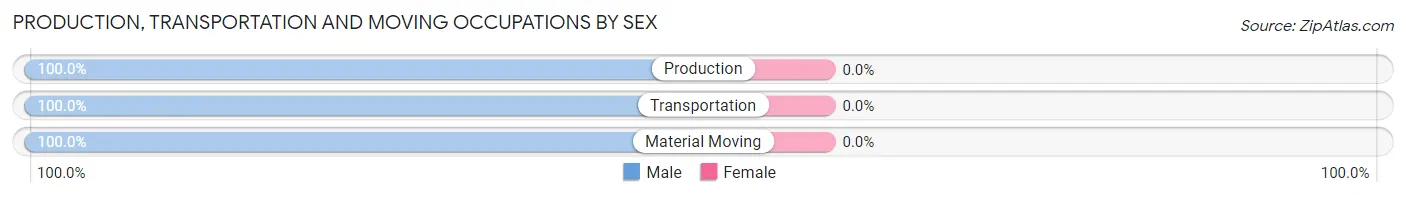
| Occupation | Male | Female |
| Production | 26 (100.0%) | 0 (0.0%) |
| Transportation | 75 (100.0%) | 0 (0.0%) |
| Material Moving | 11 (100.0%) | 0 (0.0%) |
| Total (Category) | 112 (100.0%) | 0 (0.0%) |
| Total (Overall) | 158 (71.5%) | 63 (28.5%) |
Employment Industries by Sex in Fairview
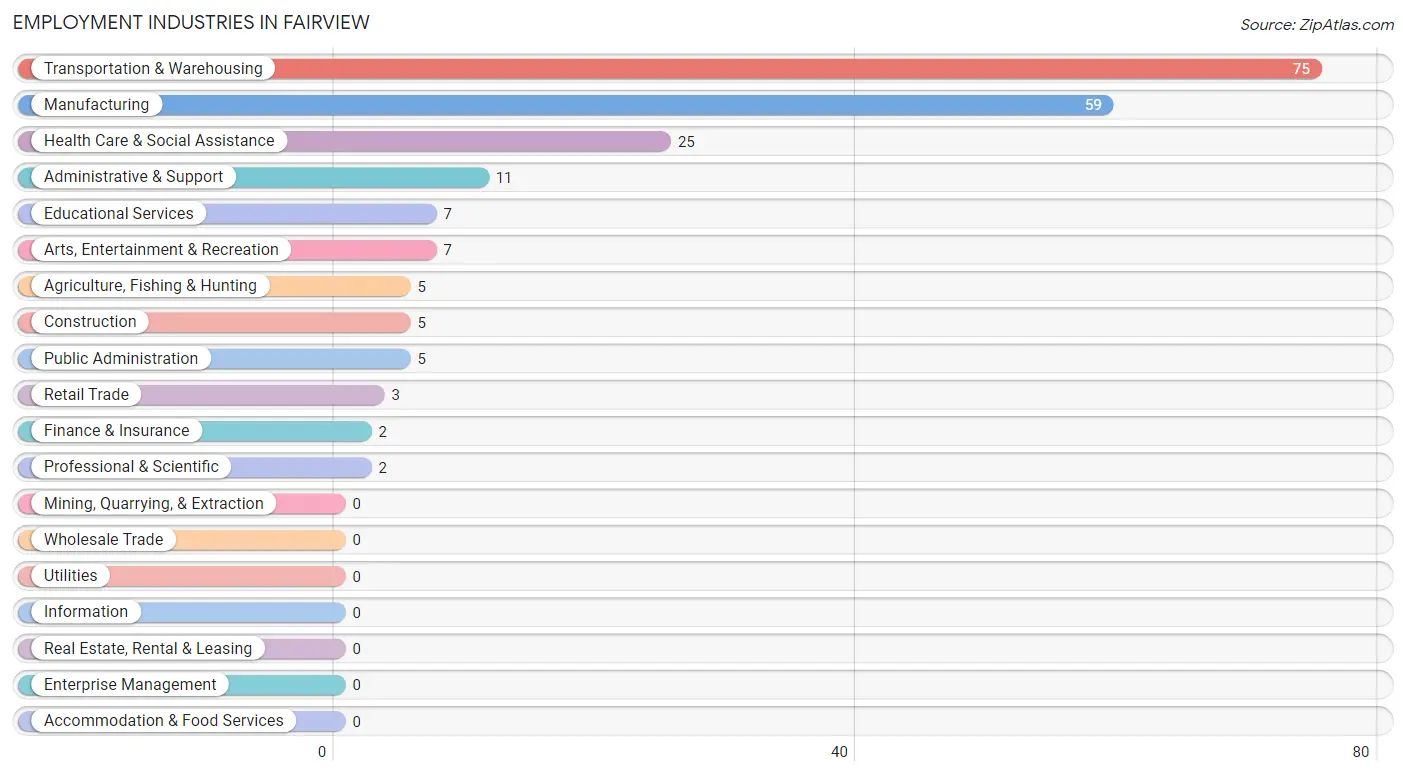
Employment Industries in Fairview
The major employment industries in Fairview include Transportation & Warehousing (75 | 33.9%), Manufacturing (59 | 26.7%), Health Care & Social Assistance (25 | 11.3%), Administrative & Support (11 | 5.0%), and Educational Services (7 | 3.2%).
Employment Industries by Sex in Fairview
The Fairview industries that see more men than women are Agriculture, Fishing & Hunting (100.0%), Construction (100.0%), and Retail Trade (100.0%), whereas the industries that tend to have a higher number of women are Finance & Insurance (100.0%), Professional & Scientific (100.0%), and Administrative & Support (100.0%).
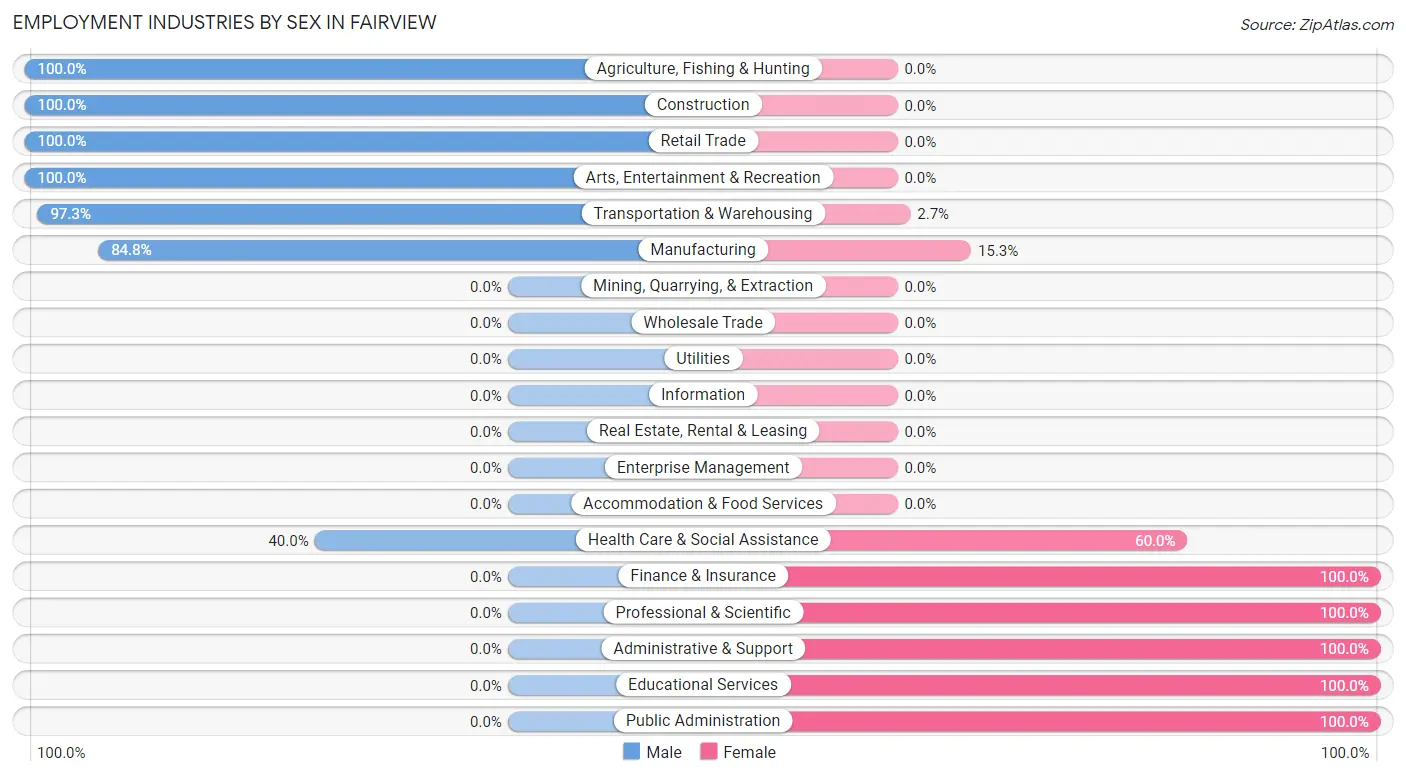
| Industry | Male | Female |
| Agriculture, Fishing & Hunting | 5 (100.0%) | 0 (0.0%) |
| Mining, Quarrying, & Extraction | 0 (0.0%) | 0 (0.0%) |
| Construction | 5 (100.0%) | 0 (0.0%) |
| Manufacturing | 50 (84.8%) | 9 (15.2%) |
| Wholesale Trade | 0 (0.0%) | 0 (0.0%) |
| Retail Trade | 3 (100.0%) | 0 (0.0%) |
| Transportation & Warehousing | 73 (97.3%) | 2 (2.7%) |
| Utilities | 0 (0.0%) | 0 (0.0%) |
| Information | 0 (0.0%) | 0 (0.0%) |
| Finance & Insurance | 0 (0.0%) | 2 (100.0%) |
| Real Estate, Rental & Leasing | 0 (0.0%) | 0 (0.0%) |
| Professional & Scientific | 0 (0.0%) | 2 (100.0%) |
| Enterprise Management | 0 (0.0%) | 0 (0.0%) |
| Administrative & Support | 0 (0.0%) | 11 (100.0%) |
| Educational Services | 0 (0.0%) | 7 (100.0%) |
| Health Care & Social Assistance | 10 (40.0%) | 15 (60.0%) |
| Arts, Entertainment & Recreation | 7 (100.0%) | 0 (0.0%) |
| Accommodation & Food Services | 0 (0.0%) | 0 (0.0%) |
| Public Administration | 0 (0.0%) | 5 (100.0%) |
| Total | 158 (71.5%) | 63 (28.5%) |
Education in Fairview
School Enrollment in Fairview
The most common levels of schooling among the 44 students in Fairview are middle school (13 | 29.5%), college / undergraduate (12 | 27.3%), and graduate / professional (10 | 22.7%).
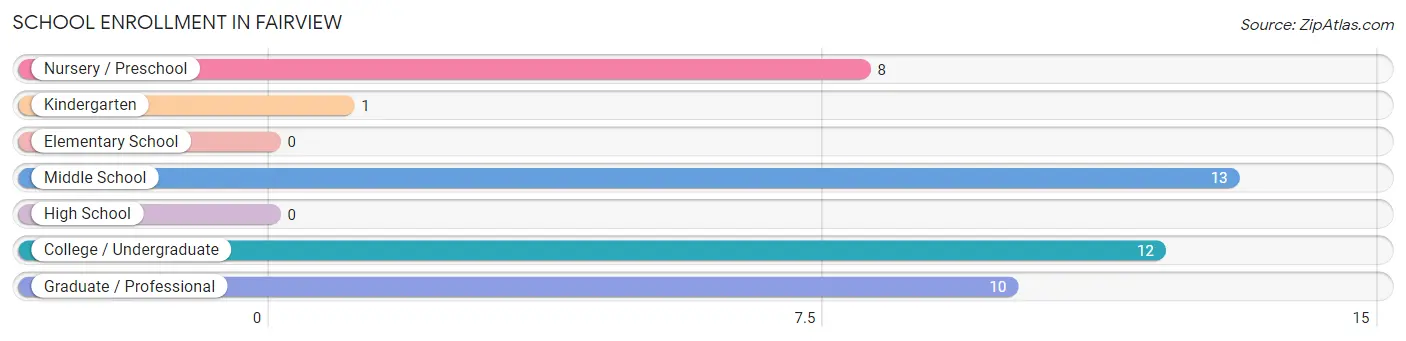
| School Level | # Students | % Students |
| Nursery / Preschool | 8 | 18.2% |
| Kindergarten | 1 | 2.3% |
| Elementary School | 0 | 0.0% |
| Middle School | 13 | 29.5% |
| High School | 0 | 0.0% |
| College / Undergraduate | 12 | 27.3% |
| Graduate / Professional | 10 | 22.7% |
| Total | 44 | 100.0% |
School Enrollment by Age by Funding Source in Fairview
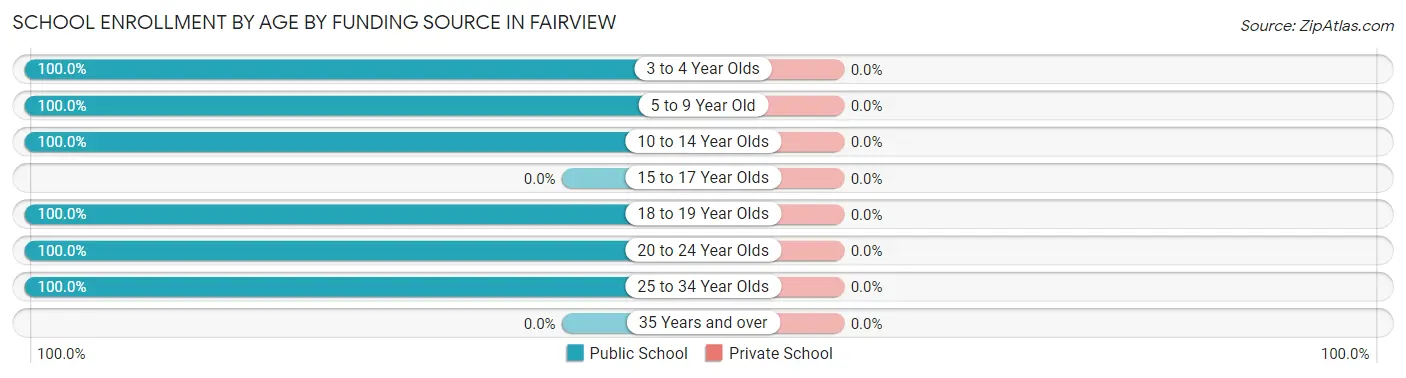
| Age Bracket | Public School | Private School |
| 3 to 4 Year Olds | 8 (100.0%) | 0 (0.0%) |
| 5 to 9 Year Old | 1 (100.0%) | 0 (0.0%) |
| 10 to 14 Year Olds | 13 (100.0%) | 0 (0.0%) |
| 15 to 17 Year Olds | 0 (0.0%) | 0 (0.0%) |
| 18 to 19 Year Olds | 5 (100.0%) | 0 (0.0%) |
| 20 to 24 Year Olds | 1 (100.0%) | 0 (0.0%) |
| 25 to 34 Year Olds | 16 (100.0%) | 0 (0.0%) |
| 35 Years and over | 0 (0.0%) | 0 (0.0%) |
| Total | 44 (100.0%) | 0 (0.0%) |
Educational Attainment by Field of Study in Fairview
Science & technology (10 | 38.5%), bio, nature & agricultural (6 | 23.1%), arts & humanities (4 | 15.4%), psychology (2 | 7.7%), and business (2 | 7.7%) are the most common fields of study among 26 individuals in Fairview who have obtained a bachelor's degree or higher.
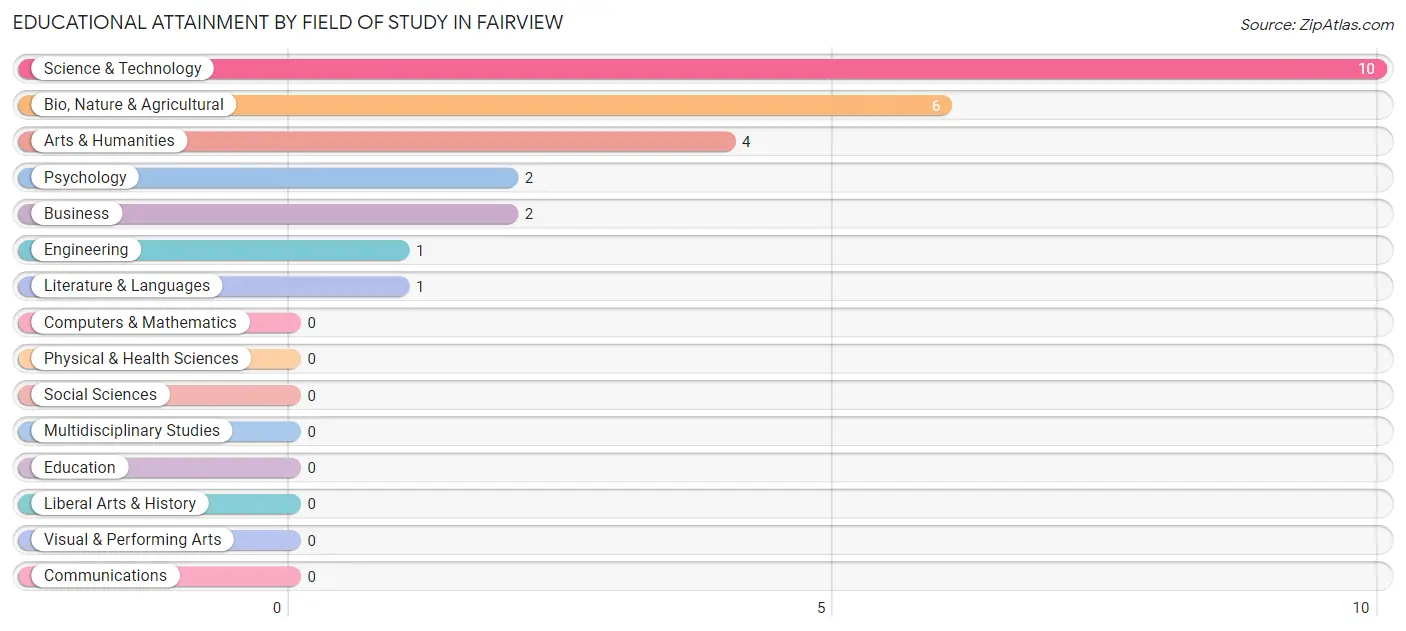
| Field of Study | # Graduates | % Graduates |
| Computers & Mathematics | 0 | 0.0% |
| Bio, Nature & Agricultural | 6 | 23.1% |
| Physical & Health Sciences | 0 | 0.0% |
| Psychology | 2 | 7.7% |
| Social Sciences | 0 | 0.0% |
| Engineering | 1 | 3.8% |
| Multidisciplinary Studies | 0 | 0.0% |
| Science & Technology | 10 | 38.5% |
| Business | 2 | 7.7% |
| Education | 0 | 0.0% |
| Literature & Languages | 1 | 3.8% |
| Liberal Arts & History | 0 | 0.0% |
| Visual & Performing Arts | 0 | 0.0% |
| Communications | 0 | 0.0% |
| Arts & Humanities | 4 | 15.4% |
| Total | 26 | 100.0% |
Transportation & Commute in Fairview
Vehicle Availability by Sex in Fairview
The most prevalent vehicle ownership categories in Fairview are males with 2 vehicles (96, accounting for 61.5%) and females with 2 vehicles (26, making up 152.4%).
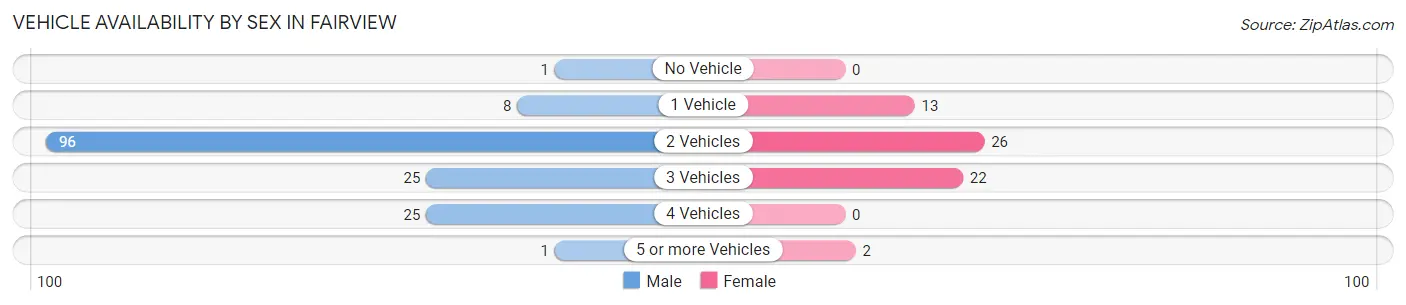
| Vehicles Available | Male | Female |
| No Vehicle | 1 (0.6%) | 0 (0.0%) |
| 1 Vehicle | 8 (5.1%) | 13 (20.6%) |
| 2 Vehicles | 96 (61.5%) | 26 (41.3%) |
| 3 Vehicles | 25 (16.0%) | 22 (34.9%) |
| 4 Vehicles | 25 (16.0%) | 0 (0.0%) |
| 5 or more Vehicles | 1 (0.6%) | 2 (3.2%) |
| Total | 156 (100.0%) | 63 (100.0%) |
Commute Time in Fairview
The most frequently occuring commute durations in Fairview are 15 to 19 minutes (96 commuters, 44.4%), 5 to 9 minutes (36 commuters, 16.7%), and 10 to 14 minutes (20 commuters, 9.3%).
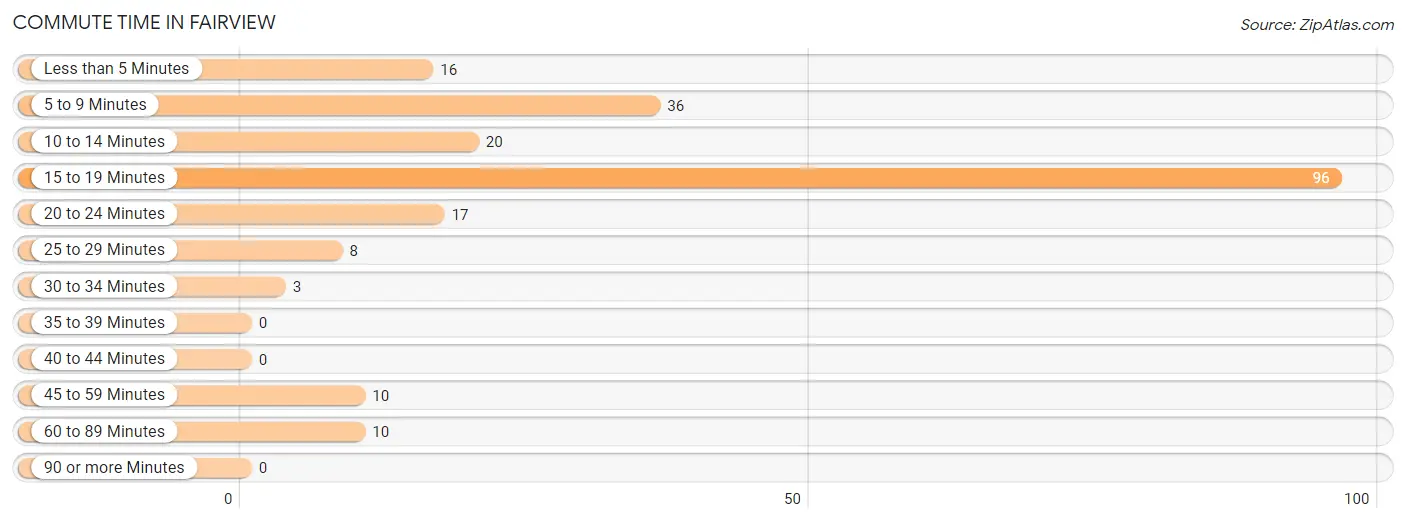
| Commute Time | # Commuters | % Commuters |
| Less than 5 Minutes | 16 | 7.4% |
| 5 to 9 Minutes | 36 | 16.7% |
| 10 to 14 Minutes | 20 | 9.3% |
| 15 to 19 Minutes | 96 | 44.4% |
| 20 to 24 Minutes | 17 | 7.9% |
| 25 to 29 Minutes | 8 | 3.7% |
| 30 to 34 Minutes | 3 | 1.4% |
| 35 to 39 Minutes | 0 | 0.0% |
| 40 to 44 Minutes | 0 | 0.0% |
| 45 to 59 Minutes | 10 | 4.6% |
| 60 to 89 Minutes | 10 | 4.6% |
| 90 or more Minutes | 0 | 0.0% |
Commute Time by Sex in Fairview
The most common commute times in Fairview are 15 to 19 minutes (77 commuters, 49.7%) for males and 15 to 19 minutes (19 commuters, 31.1%) for females.
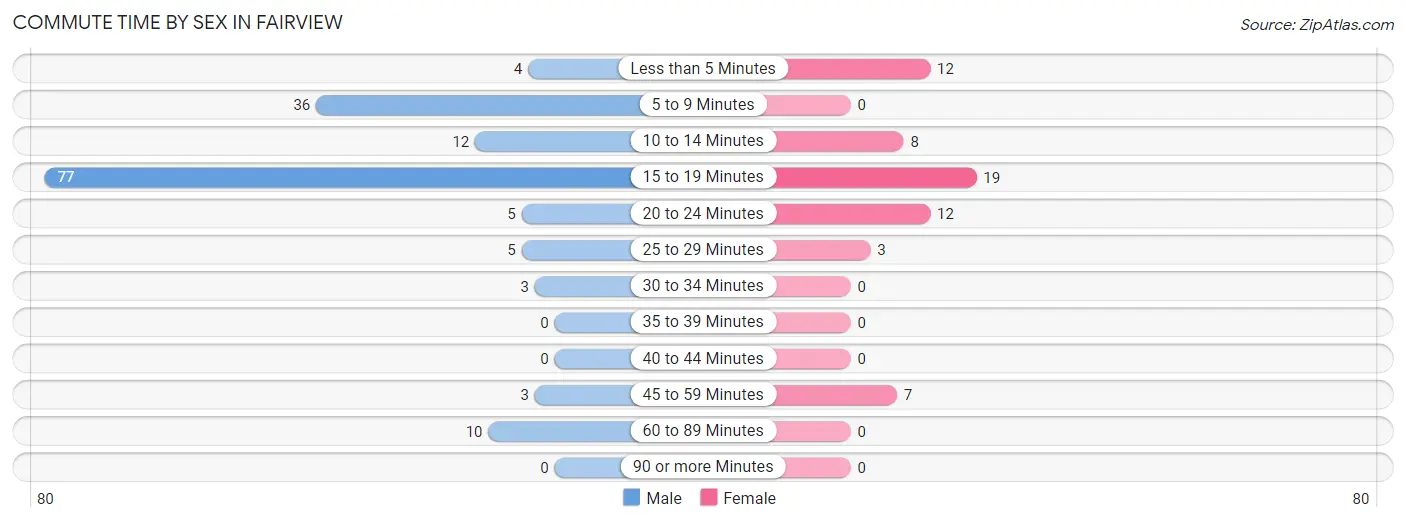
| Commute Time | Male | Female |
| Less than 5 Minutes | 4 (2.6%) | 12 (19.7%) |
| 5 to 9 Minutes | 36 (23.2%) | 0 (0.0%) |
| 10 to 14 Minutes | 12 (7.7%) | 8 (13.1%) |
| 15 to 19 Minutes | 77 (49.7%) | 19 (31.1%) |
| 20 to 24 Minutes | 5 (3.2%) | 12 (19.7%) |
| 25 to 29 Minutes | 5 (3.2%) | 3 (4.9%) |
| 30 to 34 Minutes | 3 (1.9%) | 0 (0.0%) |
| 35 to 39 Minutes | 0 (0.0%) | 0 (0.0%) |
| 40 to 44 Minutes | 0 (0.0%) | 0 (0.0%) |
| 45 to 59 Minutes | 3 (1.9%) | 7 (11.5%) |
| 60 to 89 Minutes | 10 (6.5%) | 0 (0.0%) |
| 90 or more Minutes | 0 (0.0%) | 0 (0.0%) |
Time of Departure to Work by Sex in Fairview
The most frequent times of departure to work in Fairview are 6:30 AM to 6:59 AM (74, 47.7%) for males and 7:00 AM to 7:29 AM (22, 36.1%) for females.
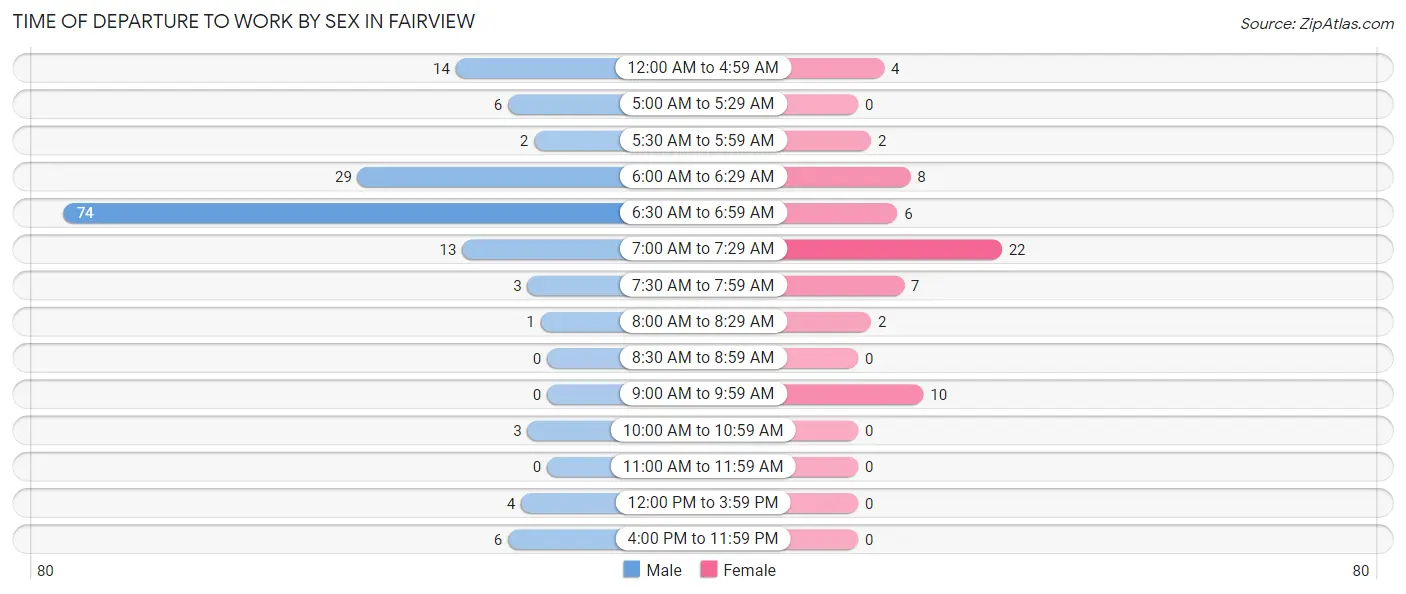
| Time of Departure | Male | Female |
| 12:00 AM to 4:59 AM | 14 (9.0%) | 4 (6.6%) |
| 5:00 AM to 5:29 AM | 6 (3.9%) | 0 (0.0%) |
| 5:30 AM to 5:59 AM | 2 (1.3%) | 2 (3.3%) |
| 6:00 AM to 6:29 AM | 29 (18.7%) | 8 (13.1%) |
| 6:30 AM to 6:59 AM | 74 (47.7%) | 6 (9.8%) |
| 7:00 AM to 7:29 AM | 13 (8.4%) | 22 (36.1%) |
| 7:30 AM to 7:59 AM | 3 (1.9%) | 7 (11.5%) |
| 8:00 AM to 8:29 AM | 1 (0.6%) | 2 (3.3%) |
| 8:30 AM to 8:59 AM | 0 (0.0%) | 0 (0.0%) |
| 9:00 AM to 9:59 AM | 0 (0.0%) | 10 (16.4%) |
| 10:00 AM to 10:59 AM | 3 (1.9%) | 0 (0.0%) |
| 11:00 AM to 11:59 AM | 0 (0.0%) | 0 (0.0%) |
| 12:00 PM to 3:59 PM | 4 (2.6%) | 0 (0.0%) |
| 4:00 PM to 11:59 PM | 6 (3.9%) | 0 (0.0%) |
| Total | 155 (100.0%) | 61 (100.0%) |
Housing Occupancy in Fairview
Occupancy by Ownership in Fairview
Of the total 188 dwellings in Fairview, owner-occupied units account for 140 (74.5%), while renter-occupied units make up 48 (25.5%).
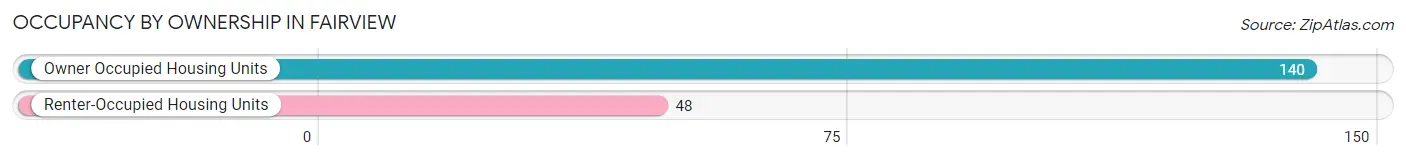
| Occupancy | # Housing Units | % Housing Units |
| Owner Occupied Housing Units | 140 | 74.5% |
| Renter-Occupied Housing Units | 48 | 25.5% |
| Total Occupied Housing Units | 188 | 100.0% |
Occupancy by Household Size in Fairview
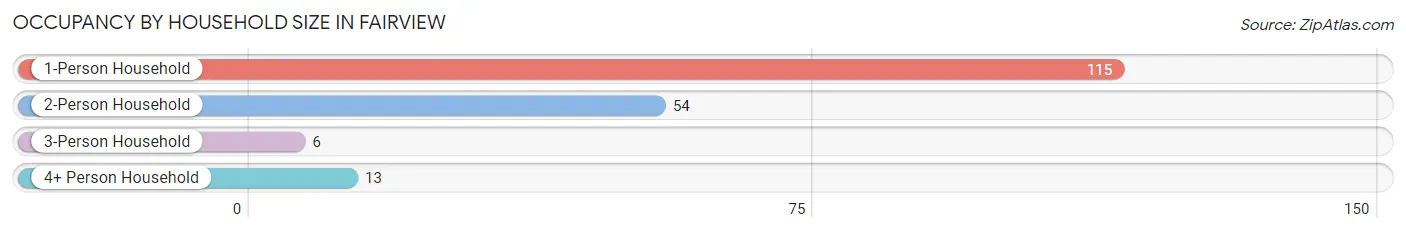
| Household Size | # Housing Units | % Housing Units |
| 1-Person Household | 115 | 61.2% |
| 2-Person Household | 54 | 28.7% |
| 3-Person Household | 6 | 3.2% |
| 4+ Person Household | 13 | 6.9% |
| Total Housing Units | 188 | 100.0% |
Occupancy by Ownership by Household Size in Fairview
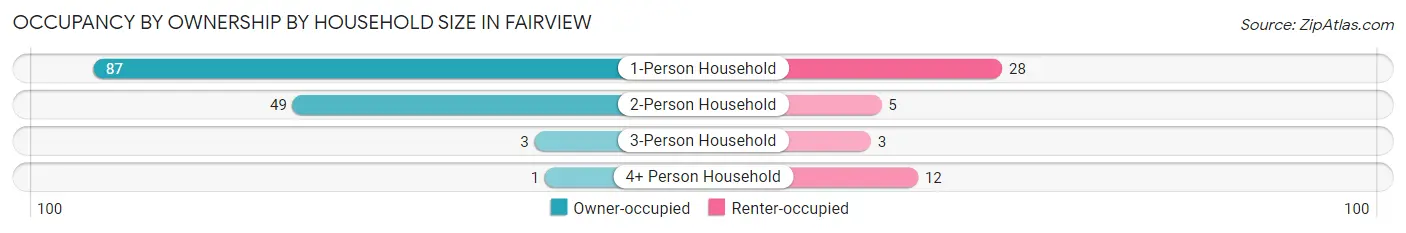
| Household Size | Owner-occupied | Renter-occupied |
| 1-Person Household | 87 (75.6%) | 28 (24.3%) |
| 2-Person Household | 49 (90.7%) | 5 (9.3%) |
| 3-Person Household | 3 (50.0%) | 3 (50.0%) |
| 4+ Person Household | 1 (7.7%) | 12 (92.3%) |
| Total Housing Units | 140 (74.5%) | 48 (25.5%) |
Occupancy by Educational Attainment in Fairview
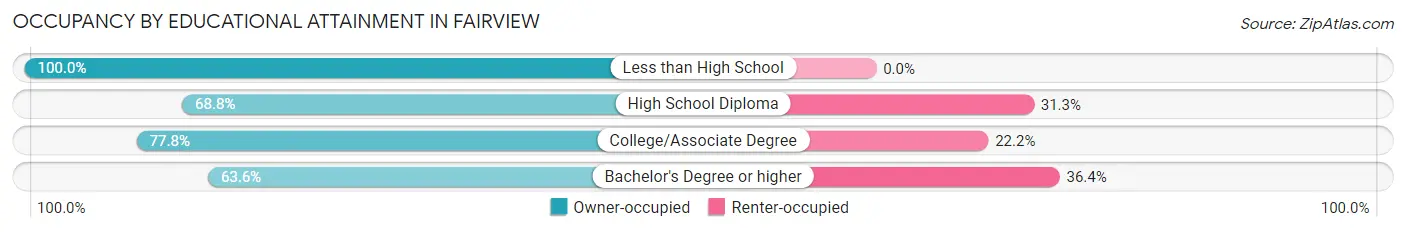
| Household Size | Owner-occupied | Renter-occupied |
| Less than High School | 5 (100.0%) | 0 (0.0%) |
| High School Diploma | 44 (68.8%) | 20 (31.2%) |
| College/Associate Degree | 84 (77.8%) | 24 (22.2%) |
| Bachelor's Degree or higher | 7 (63.6%) | 4 (36.4%) |
Occupancy by Age of Householder in Fairview
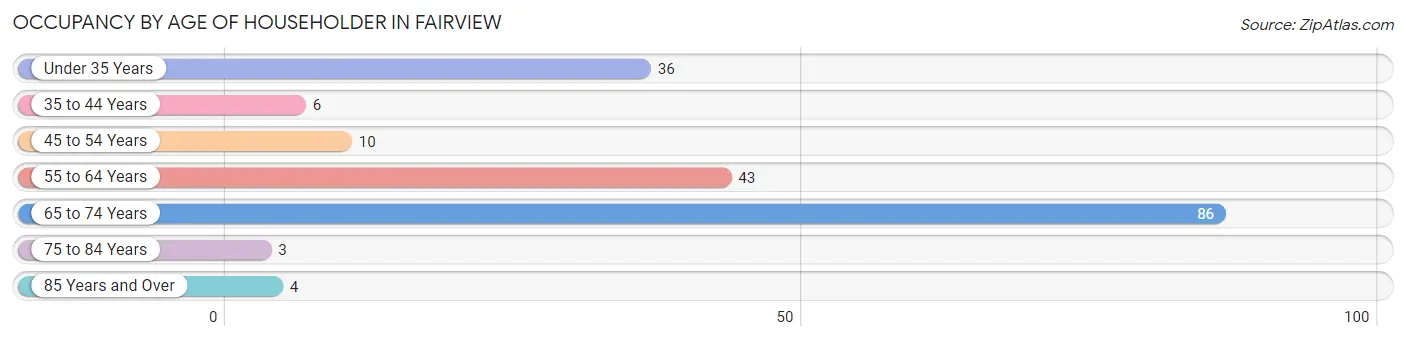
| Age Bracket | # Households | % Households |
| Under 35 Years | 36 | 19.2% |
| 35 to 44 Years | 6 | 3.2% |
| 45 to 54 Years | 10 | 5.3% |
| 55 to 64 Years | 43 | 22.9% |
| 65 to 74 Years | 86 | 45.7% |
| 75 to 84 Years | 3 | 1.6% |
| 85 Years and Over | 4 | 2.1% |
| Total | 188 | 100.0% |
Housing Finances in Fairview
Median Income by Occupancy in Fairview
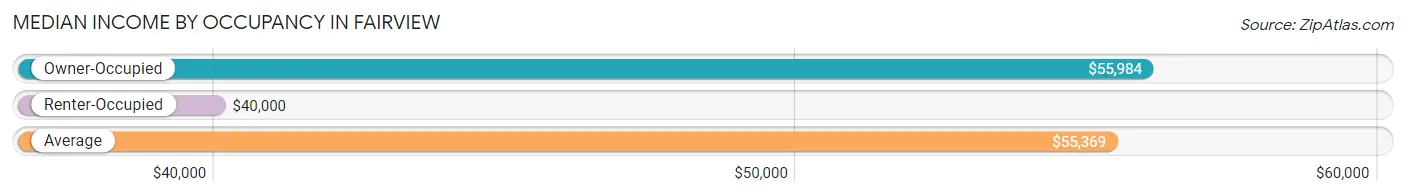
| Occupancy Type | # Households | Median Income |
| Owner-Occupied | 140 (74.5%) | $55,984 |
| Renter-Occupied | 48 (25.5%) | $40,000 |
| Average | 188 (100.0%) | $55,369 |
Occupancy by Householder Income Bracket in Fairview
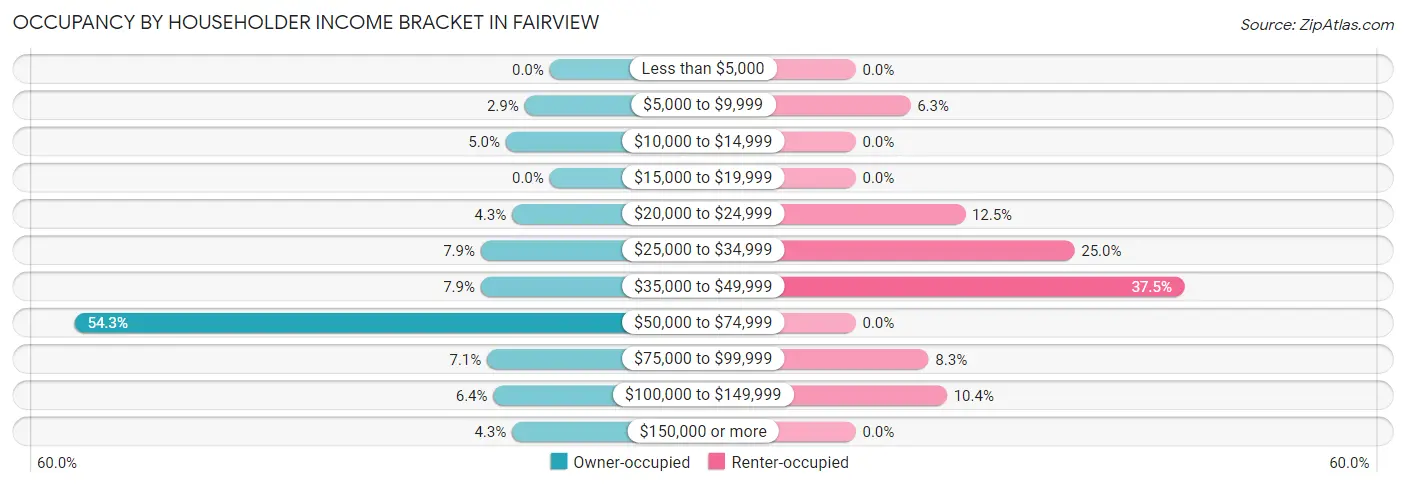
| Income Bracket | Owner-occupied | Renter-occupied |
| Less than $5,000 | 0 (0.0%) | 0 (0.0%) |
| $5,000 to $9,999 | 4 (2.9%) | 3 (6.2%) |
| $10,000 to $14,999 | 7 (5.0%) | 0 (0.0%) |
| $15,000 to $19,999 | 0 (0.0%) | 0 (0.0%) |
| $20,000 to $24,999 | 6 (4.3%) | 6 (12.5%) |
| $25,000 to $34,999 | 11 (7.9%) | 12 (25.0%) |
| $35,000 to $49,999 | 11 (7.9%) | 18 (37.5%) |
| $50,000 to $74,999 | 76 (54.3%) | 0 (0.0%) |
| $75,000 to $99,999 | 10 (7.1%) | 4 (8.3%) |
| $100,000 to $149,999 | 9 (6.4%) | 5 (10.4%) |
| $150,000 or more | 6 (4.3%) | 0 (0.0%) |
| Total | 140 (100.0%) | 48 (100.0%) |
Monthly Housing Cost Tiers in Fairview
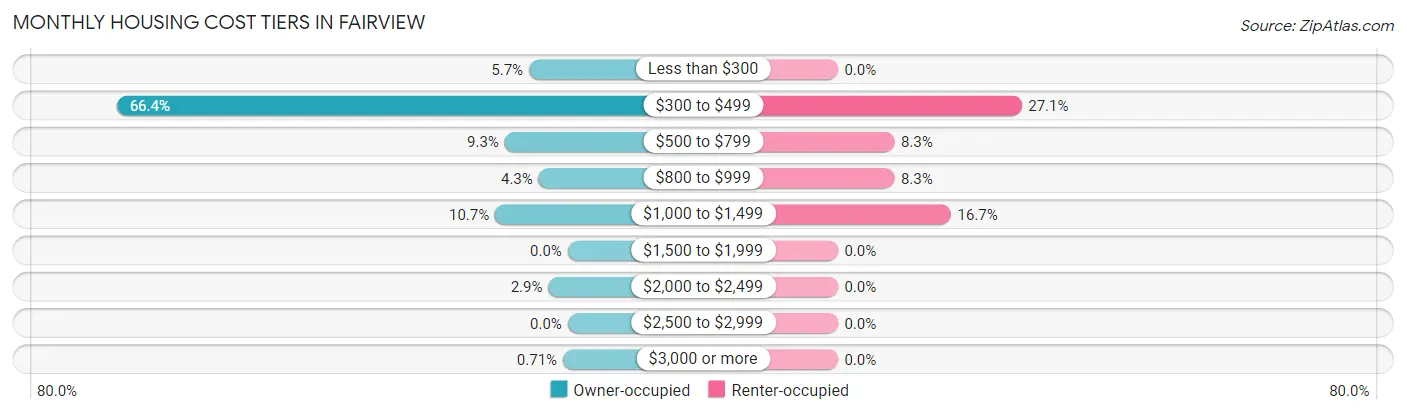
| Monthly Cost | Owner-occupied | Renter-occupied |
| Less than $300 | 8 (5.7%) | 0 (0.0%) |
| $300 to $499 | 93 (66.4%) | 13 (27.1%) |
| $500 to $799 | 13 (9.3%) | 4 (8.3%) |
| $800 to $999 | 6 (4.3%) | 4 (8.3%) |
| $1,000 to $1,499 | 15 (10.7%) | 8 (16.7%) |
| $1,500 to $1,999 | 0 (0.0%) | 0 (0.0%) |
| $2,000 to $2,499 | 4 (2.9%) | 0 (0.0%) |
| $2,500 to $2,999 | 0 (0.0%) | 0 (0.0%) |
| $3,000 or more | 1 (0.7%) | 0 (0.0%) |
| Total | 140 (100.0%) | 48 (100.0%) |
Physical Housing Characteristics in Fairview
Housing Structures in Fairview
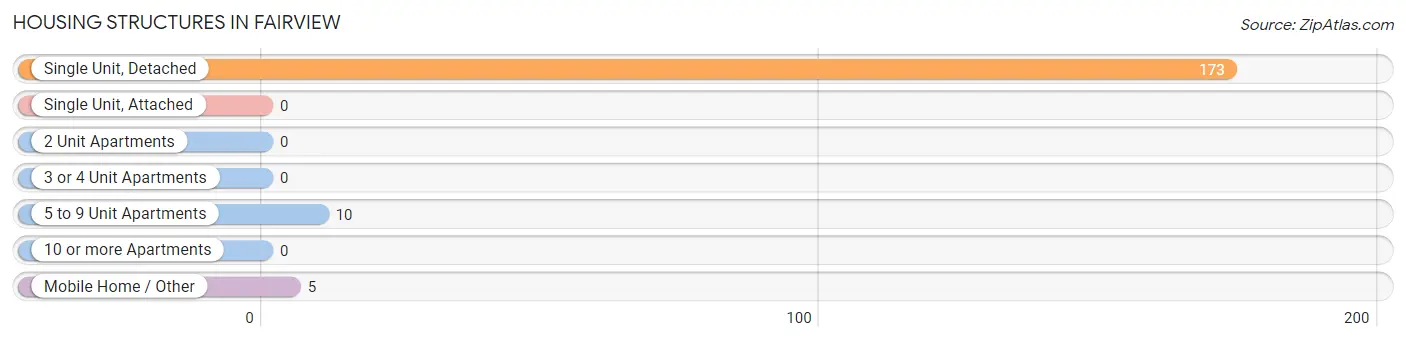
| Structure Type | # Housing Units | % Housing Units |
| Single Unit, Detached | 173 | 92.0% |
| Single Unit, Attached | 0 | 0.0% |
| 2 Unit Apartments | 0 | 0.0% |
| 3 or 4 Unit Apartments | 0 | 0.0% |
| 5 to 9 Unit Apartments | 10 | 5.3% |
| 10 or more Apartments | 0 | 0.0% |
| Mobile Home / Other | 5 | 2.7% |
| Total | 188 | 100.0% |
Housing Structures by Occupancy in Fairview
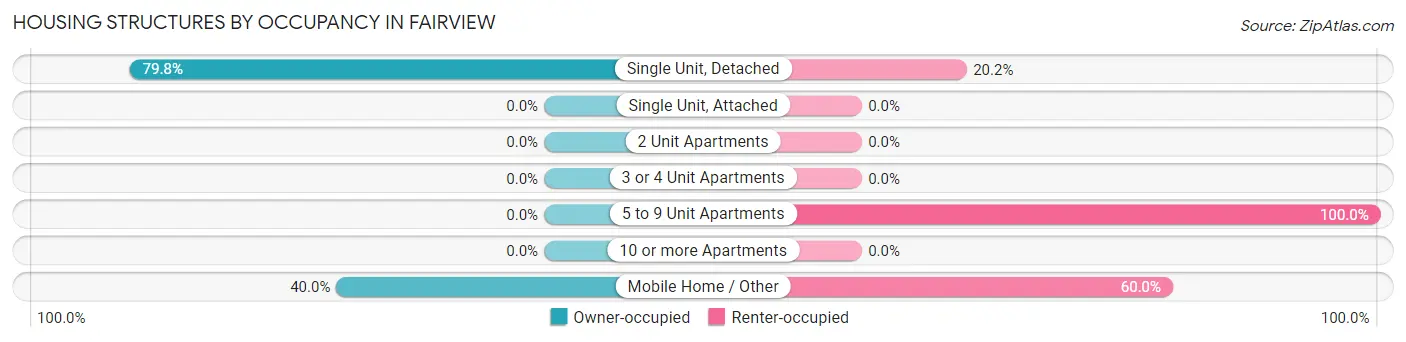
| Structure Type | Owner-occupied | Renter-occupied |
| Single Unit, Detached | 138 (79.8%) | 35 (20.2%) |
| Single Unit, Attached | 0 (0.0%) | 0 (0.0%) |
| 2 Unit Apartments | 0 (0.0%) | 0 (0.0%) |
| 3 or 4 Unit Apartments | 0 (0.0%) | 0 (0.0%) |
| 5 to 9 Unit Apartments | 0 (0.0%) | 10 (100.0%) |
| 10 or more Apartments | 0 (0.0%) | 0 (0.0%) |
| Mobile Home / Other | 2 (40.0%) | 3 (60.0%) |
| Total | 140 (74.5%) | 48 (25.5%) |
Housing Structures by Number of Rooms in Fairview
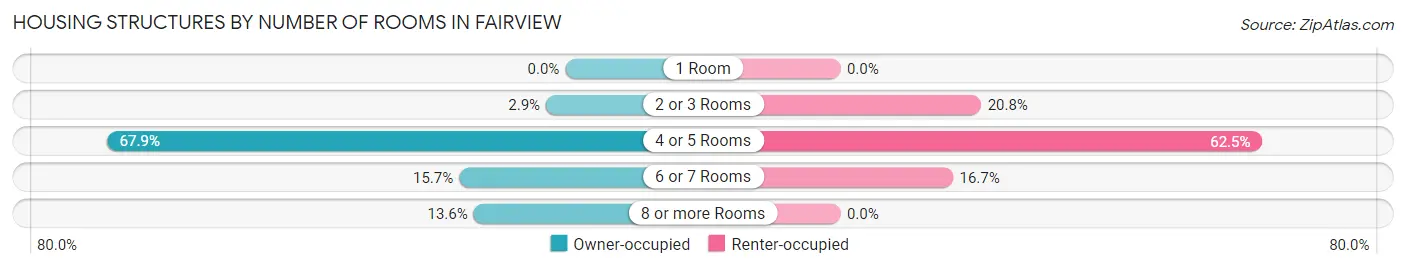
| Number of Rooms | Owner-occupied | Renter-occupied |
| 1 Room | 0 (0.0%) | 0 (0.0%) |
| 2 or 3 Rooms | 4 (2.9%) | 10 (20.8%) |
| 4 or 5 Rooms | 95 (67.9%) | 30 (62.5%) |
| 6 or 7 Rooms | 22 (15.7%) | 8 (16.7%) |
| 8 or more Rooms | 19 (13.6%) | 0 (0.0%) |
| Total | 140 (100.0%) | 48 (100.0%) |
Housing Structure by Heating Type in Fairview
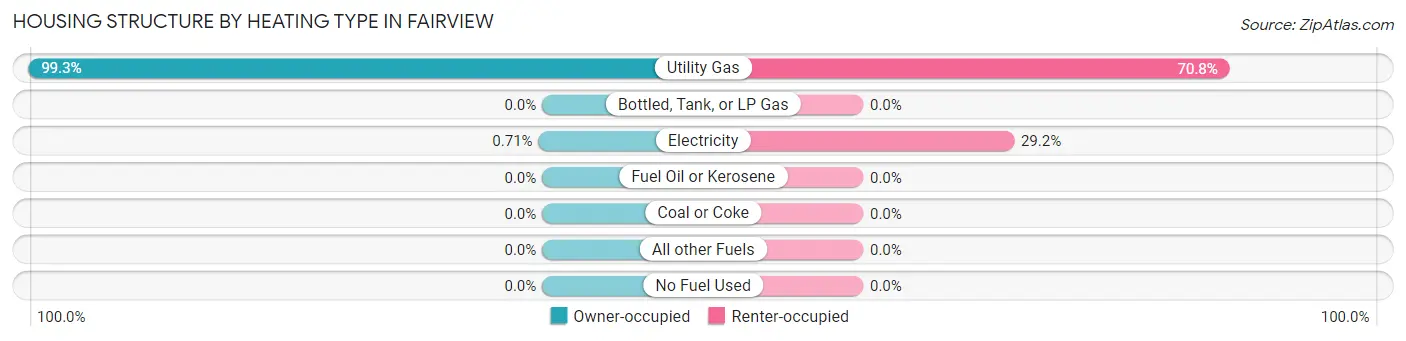
| Heating Type | Owner-occupied | Renter-occupied |
| Utility Gas | 139 (99.3%) | 34 (70.8%) |
| Bottled, Tank, or LP Gas | 0 (0.0%) | 0 (0.0%) |
| Electricity | 1 (0.7%) | 14 (29.2%) |
| Fuel Oil or Kerosene | 0 (0.0%) | 0 (0.0%) |
| Coal or Coke | 0 (0.0%) | 0 (0.0%) |
| All other Fuels | 0 (0.0%) | 0 (0.0%) |
| No Fuel Used | 0 (0.0%) | 0 (0.0%) |
| Total | 140 (100.0%) | 48 (100.0%) |
Household Vehicle Usage in Fairview
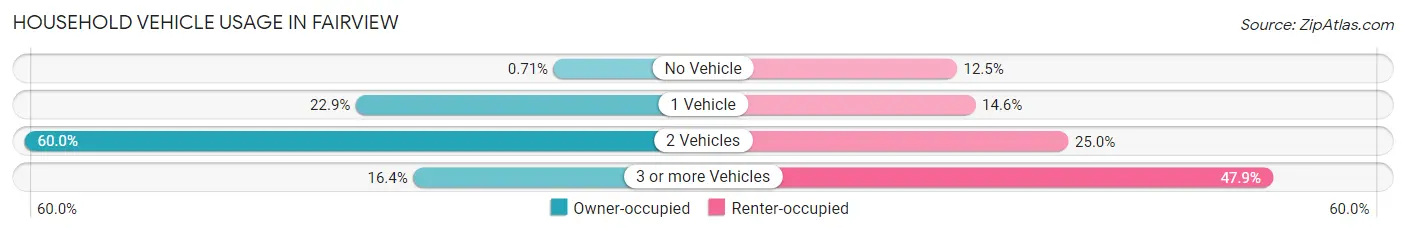
| Vehicles per Household | Owner-occupied | Renter-occupied |
| No Vehicle | 1 (0.7%) | 6 (12.5%) |
| 1 Vehicle | 32 (22.9%) | 7 (14.6%) |
| 2 Vehicles | 84 (60.0%) | 12 (25.0%) |
| 3 or more Vehicles | 23 (16.4%) | 23 (47.9%) |
| Total | 140 (100.0%) | 48 (100.0%) |
Real Estate & Mortgages in Fairview
Real Estate and Mortgage Overview in Fairview
| Characteristic | Without Mortgage | With Mortgage |
| Housing Units | 105 | 35 |
| Median Property Value | $111,300 | $123,400 |
| Median Household Income | $55,938 | $2 |
| Monthly Housing Costs | $435 | $1 |
| Real Estate Taxes | $1,208 | $0 |
Property Value by Mortgage Status in Fairview
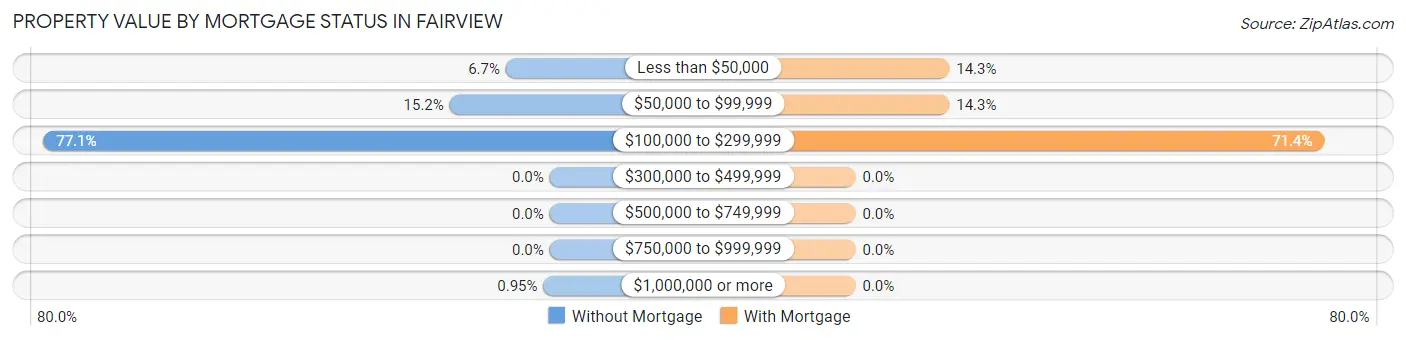
| Property Value | Without Mortgage | With Mortgage |
| Less than $50,000 | 7 (6.7%) | 5 (14.3%) |
| $50,000 to $99,999 | 16 (15.2%) | 5 (14.3%) |
| $100,000 to $299,999 | 81 (77.1%) | 25 (71.4%) |
| $300,000 to $499,999 | 0 (0.0%) | 0 (0.0%) |
| $500,000 to $749,999 | 0 (0.0%) | 0 (0.0%) |
| $750,000 to $999,999 | 0 (0.0%) | 0 (0.0%) |
| $1,000,000 or more | 1 (0.9%) | 0 (0.0%) |
| Total | 105 (100.0%) | 35 (100.0%) |
Household Income by Mortgage Status in Fairview
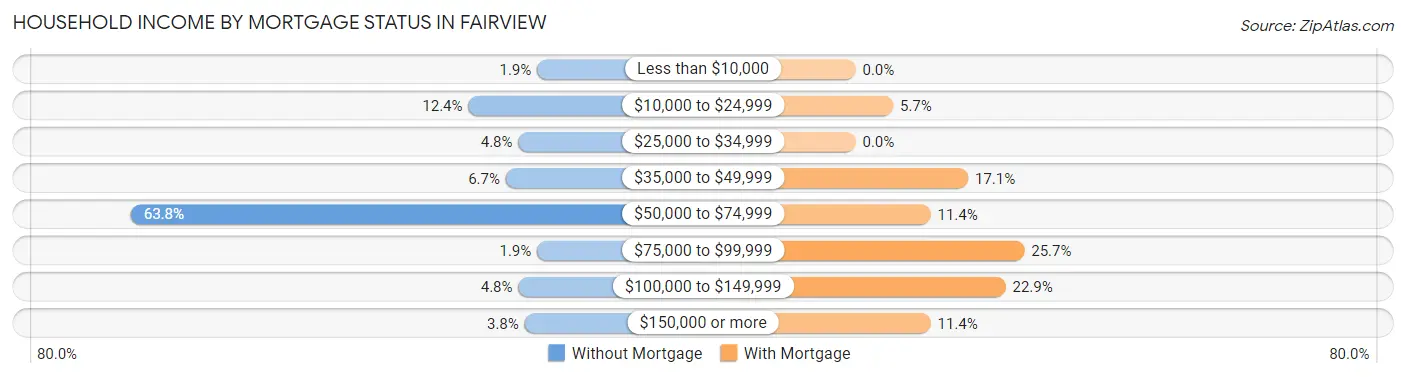
| Household Income | Without Mortgage | With Mortgage |
| Less than $10,000 | 2 (1.9%) | 0 (0.0%) |
| $10,000 to $24,999 | 13 (12.4%) | 2 (5.7%) |
| $25,000 to $34,999 | 5 (4.8%) | 0 (0.0%) |
| $35,000 to $49,999 | 7 (6.7%) | 6 (17.1%) |
| $50,000 to $74,999 | 67 (63.8%) | 4 (11.4%) |
| $75,000 to $99,999 | 2 (1.9%) | 9 (25.7%) |
| $100,000 to $149,999 | 5 (4.8%) | 8 (22.9%) |
| $150,000 or more | 4 (3.8%) | 4 (11.4%) |
| Total | 105 (100.0%) | 35 (100.0%) |
Property Value to Household Income Ratio in Fairview
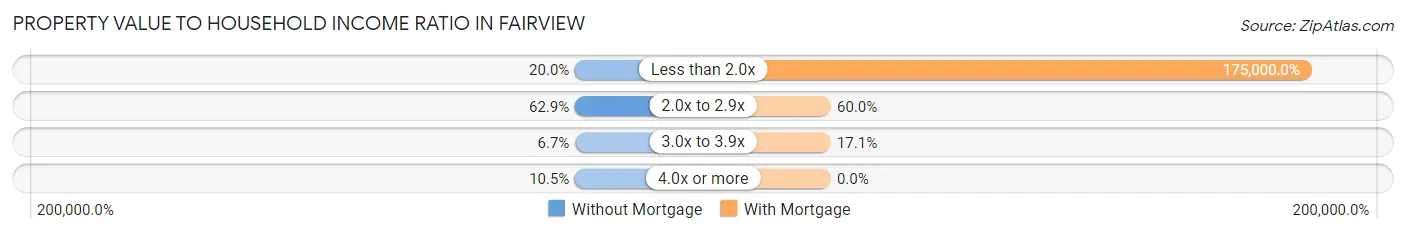
| Value-to-Income Ratio | Without Mortgage | With Mortgage |
| Less than 2.0x | 21 (20.0%) | 61,250 (175,000.0%) |
| 2.0x to 2.9x | 66 (62.9%) | 21 (60.0%) |
| 3.0x to 3.9x | 7 (6.7%) | 6 (17.1%) |
| 4.0x or more | 11 (10.5%) | 0 (0.0%) |
| Total | 105 (100.0%) | 35 (100.0%) |
Real Estate Taxes by Mortgage Status in Fairview
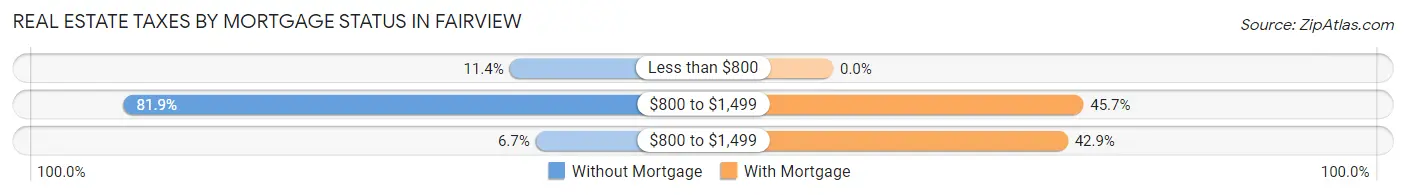
| Property Taxes | Without Mortgage | With Mortgage |
| Less than $800 | 12 (11.4%) | 0 (0.0%) |
| $800 to $1,499 | 86 (81.9%) | 16 (45.7%) |
| $800 to $1,499 | 7 (6.7%) | 15 (42.9%) |
| Total | 105 (100.0%) | 35 (100.0%) |
Health & Disability in Fairview
Health Insurance Coverage by Age in Fairview
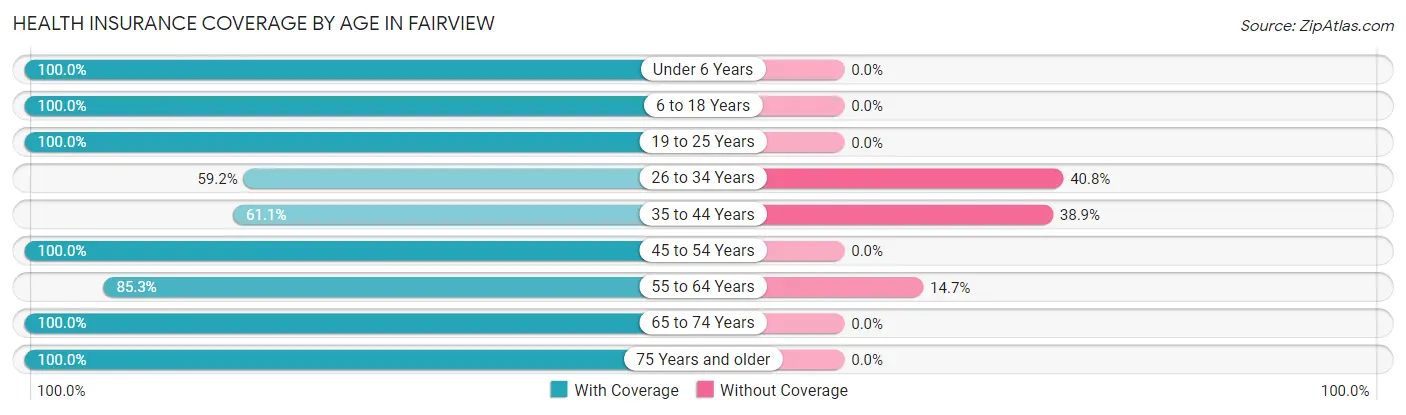
| Age Bracket | With Coverage | Without Coverage |
| Under 6 Years | 35 (100.0%) | 0 (0.0%) |
| 6 to 18 Years | 19 (100.0%) | 0 (0.0%) |
| 19 to 25 Years | 24 (100.0%) | 0 (0.0%) |
| 26 to 34 Years | 29 (59.2%) | 20 (40.8%) |
| 35 to 44 Years | 11 (61.1%) | 7 (38.9%) |
| 45 to 54 Years | 13 (100.0%) | 0 (0.0%) |
| 55 to 64 Years | 58 (85.3%) | 10 (14.7%) |
| 65 to 74 Years | 96 (100.0%) | 0 (0.0%) |
| 75 Years and older | 12 (100.0%) | 0 (0.0%) |
| Total | 297 (88.9%) | 37 (11.1%) |
Health Insurance Coverage by Citizenship Status in Fairview
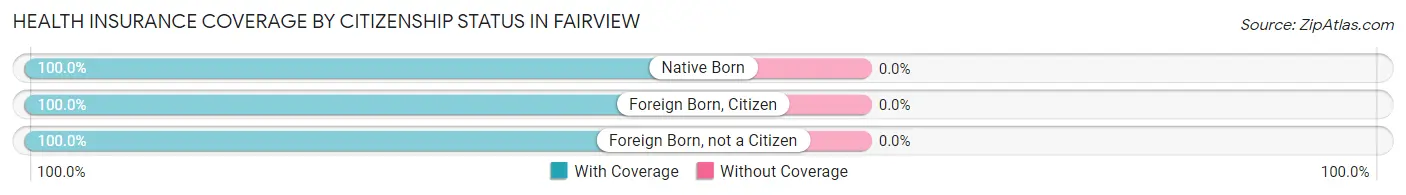
| Citizenship Status | With Coverage | Without Coverage |
| Native Born | 35 (100.0%) | 0 (0.0%) |
| Foreign Born, Citizen | 19 (100.0%) | 0 (0.0%) |
| Foreign Born, not a Citizen | 24 (100.0%) | 0 (0.0%) |
Health Insurance Coverage by Household Income in Fairview
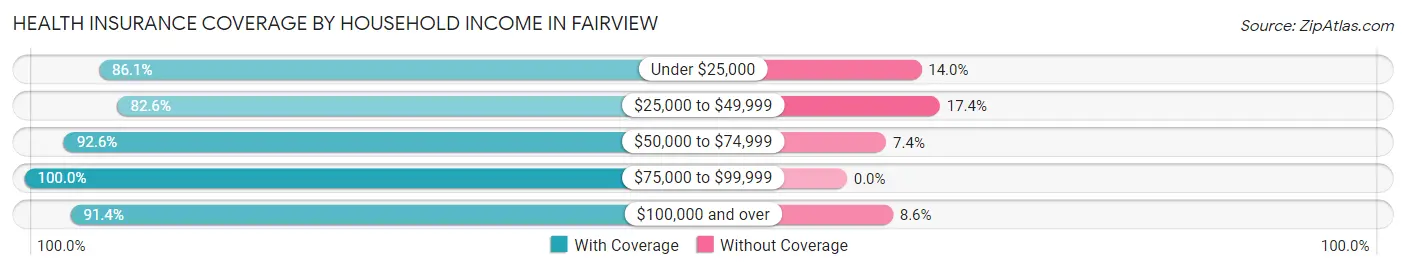
| Household Income | With Coverage | Without Coverage |
| Under $25,000 | 37 (86.1%) | 6 (14.0%) |
| $25,000 to $49,999 | 90 (82.6%) | 19 (17.4%) |
| $50,000 to $74,999 | 88 (92.6%) | 7 (7.4%) |
| $75,000 to $99,999 | 29 (100.0%) | 0 (0.0%) |
| $100,000 and over | 53 (91.4%) | 5 (8.6%) |
Public vs Private Health Insurance Coverage by Age in Fairview
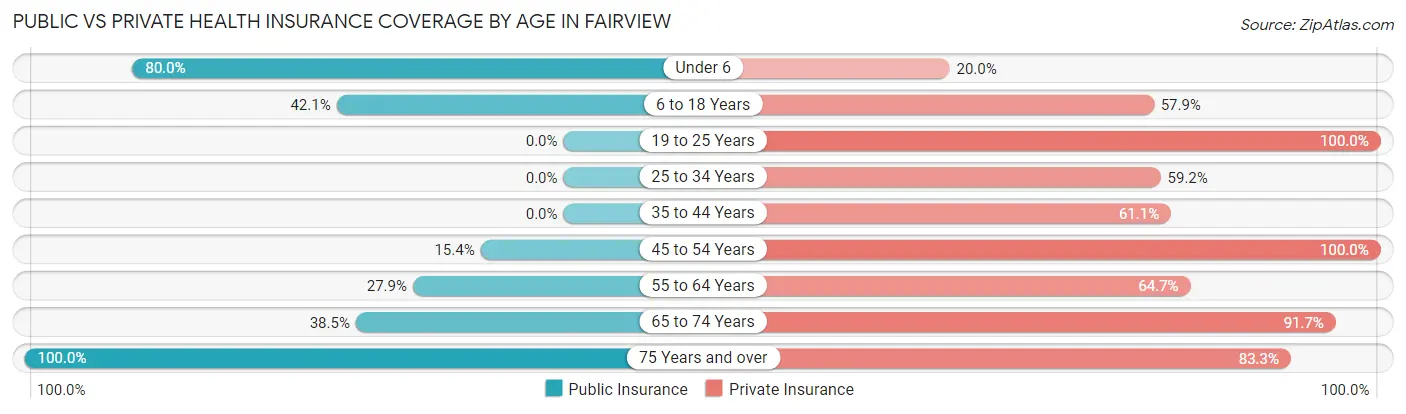
| Age Bracket | Public Insurance | Private Insurance |
| Under 6 | 28 (80.0%) | 7 (20.0%) |
| 6 to 18 Years | 8 (42.1%) | 11 (57.9%) |
| 19 to 25 Years | 0 (0.0%) | 24 (100.0%) |
| 25 to 34 Years | 0 (0.0%) | 29 (59.2%) |
| 35 to 44 Years | 0 (0.0%) | 11 (61.1%) |
| 45 to 54 Years | 2 (15.4%) | 13 (100.0%) |
| 55 to 64 Years | 19 (27.9%) | 44 (64.7%) |
| 65 to 74 Years | 37 (38.5%) | 88 (91.7%) |
| 75 Years and over | 12 (100.0%) | 10 (83.3%) |
| Total | 106 (31.7%) | 237 (71.0%) |
Disability Status by Sex by Age in Fairview
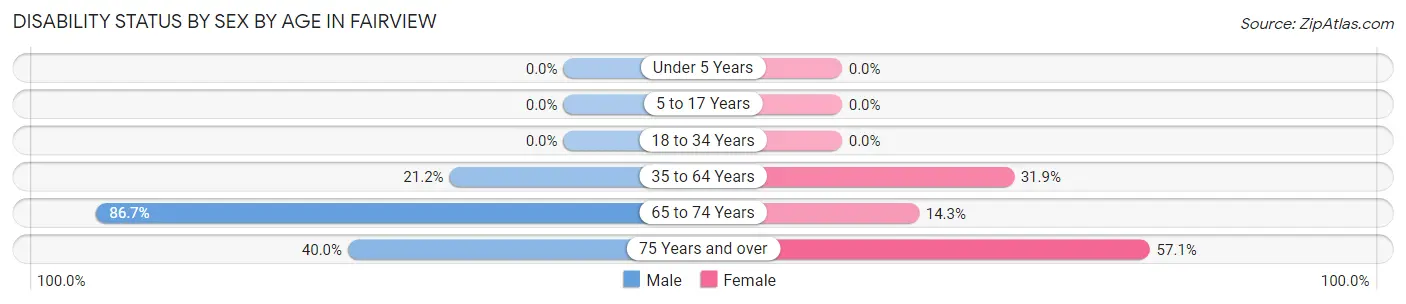
| Age Bracket | Male | Female |
| Under 5 Years | 0 (0.0%) | 0 (0.0%) |
| 5 to 17 Years | 0 (0.0%) | 0 (0.0%) |
| 18 to 34 Years | 0 (0.0%) | 0 (0.0%) |
| 35 to 64 Years | 11 (21.1%) | 15 (31.9%) |
| 65 to 74 Years | 65 (86.7%) | 3 (14.3%) |
| 75 Years and over | 2 (40.0%) | 4 (57.1%) |
Disability Class by Sex by Age in Fairview
Disability Class: Hearing Difficulty
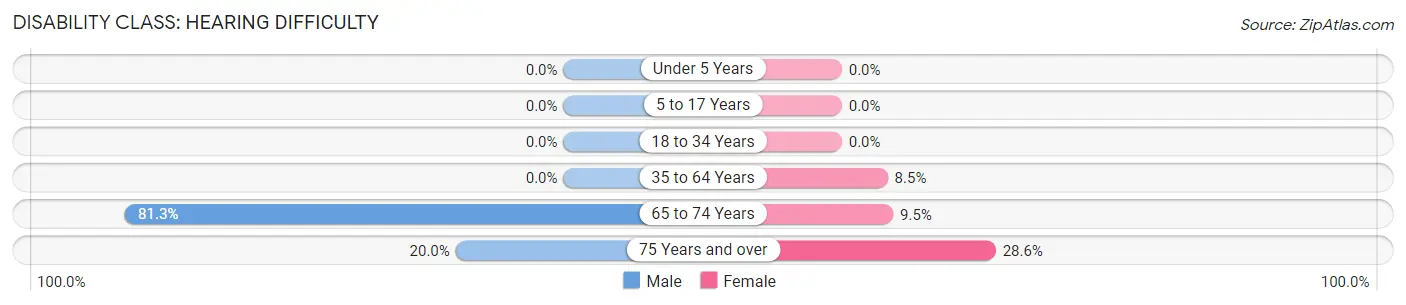
| Age Bracket | Male | Female |
| Under 5 Years | 0 (0.0%) | 0 (0.0%) |
| 5 to 17 Years | 0 (0.0%) | 0 (0.0%) |
| 18 to 34 Years | 0 (0.0%) | 0 (0.0%) |
| 35 to 64 Years | 0 (0.0%) | 4 (8.5%) |
| 65 to 74 Years | 61 (81.3%) | 2 (9.5%) |
| 75 Years and over | 1 (20.0%) | 2 (28.6%) |
Disability Class: Vision Difficulty
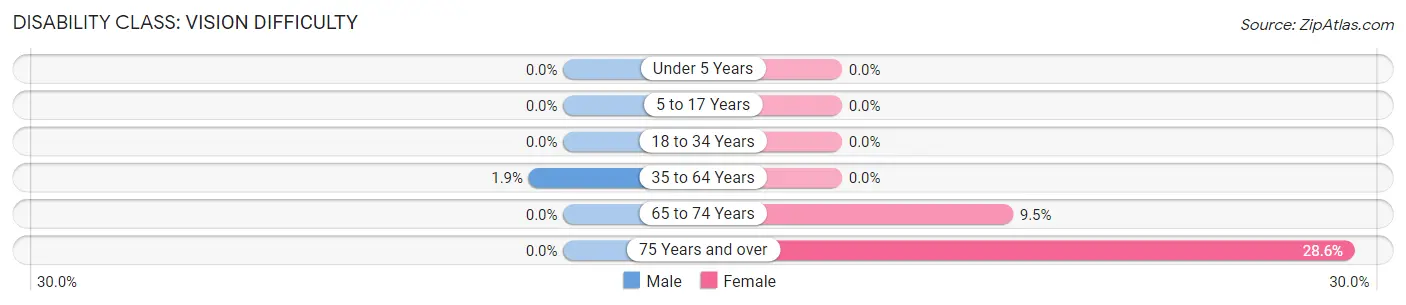
| Age Bracket | Male | Female |
| Under 5 Years | 0 (0.0%) | 0 (0.0%) |
| 5 to 17 Years | 0 (0.0%) | 0 (0.0%) |
| 18 to 34 Years | 0 (0.0%) | 0 (0.0%) |
| 35 to 64 Years | 1 (1.9%) | 0 (0.0%) |
| 65 to 74 Years | 0 (0.0%) | 2 (9.5%) |
| 75 Years and over | 0 (0.0%) | 2 (28.6%) |
Disability Class: Cognitive Difficulty
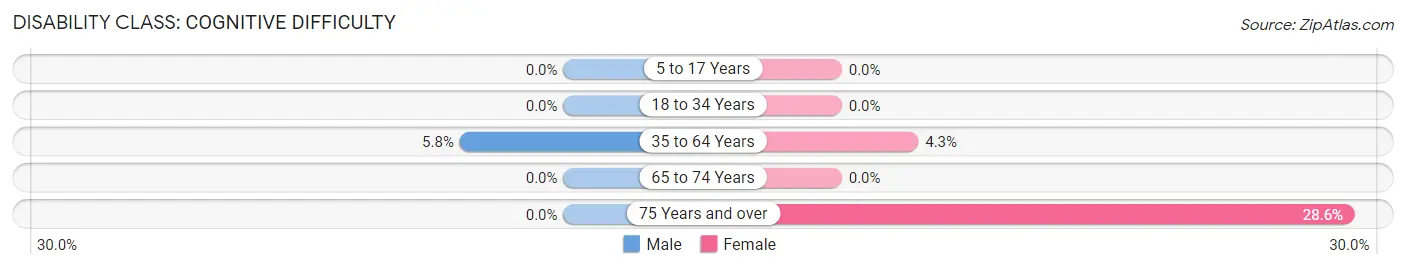
| Age Bracket | Male | Female |
| 5 to 17 Years | 0 (0.0%) | 0 (0.0%) |
| 18 to 34 Years | 0 (0.0%) | 0 (0.0%) |
| 35 to 64 Years | 3 (5.8%) | 2 (4.3%) |
| 65 to 74 Years | 0 (0.0%) | 0 (0.0%) |
| 75 Years and over | 0 (0.0%) | 2 (28.6%) |
Disability Class: Ambulatory Difficulty
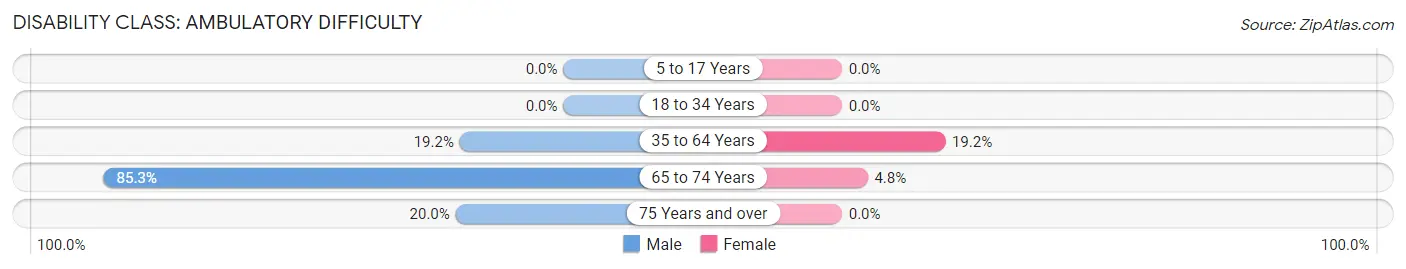
| Age Bracket | Male | Female |
| 5 to 17 Years | 0 (0.0%) | 0 (0.0%) |
| 18 to 34 Years | 0 (0.0%) | 0 (0.0%) |
| 35 to 64 Years | 10 (19.2%) | 9 (19.2%) |
| 65 to 74 Years | 64 (85.3%) | 1 (4.8%) |
| 75 Years and over | 1 (20.0%) | 0 (0.0%) |
Disability Class: Self-Care Difficulty
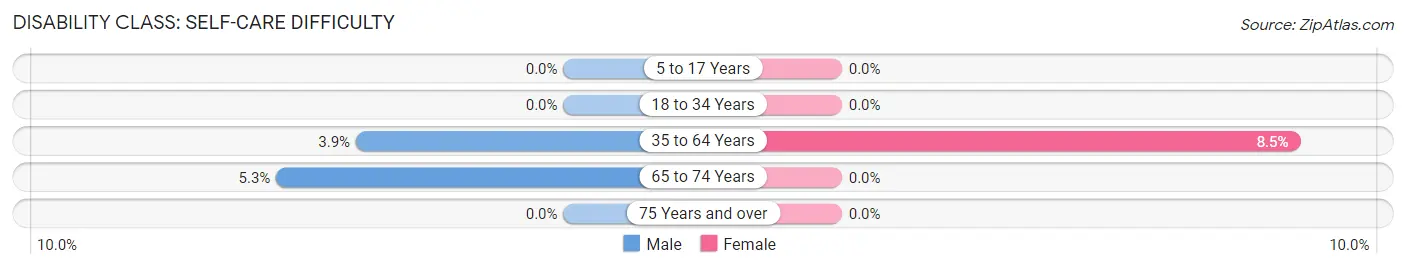
| Age Bracket | Male | Female |
| 5 to 17 Years | 0 (0.0%) | 0 (0.0%) |
| 18 to 34 Years | 0 (0.0%) | 0 (0.0%) |
| 35 to 64 Years | 2 (3.8%) | 4 (8.5%) |
| 65 to 74 Years | 4 (5.3%) | 0 (0.0%) |
| 75 Years and over | 0 (0.0%) | 0 (0.0%) |
Technology Access in Fairview
Computing Device Access in Fairview
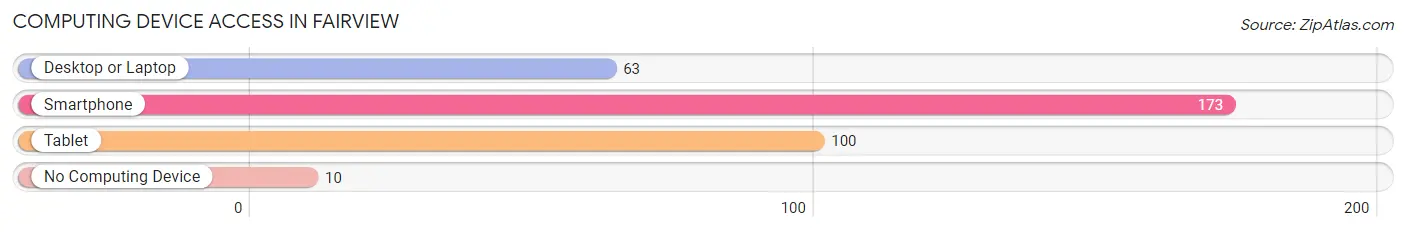
| Device Type | # Households | % Households |
| Desktop or Laptop | 63 | 33.5% |
| Smartphone | 173 | 92.0% |
| Tablet | 100 | 53.2% |
| No Computing Device | 10 | 5.3% |
| Total | 188 | 100.0% |
Internet Access in Fairview
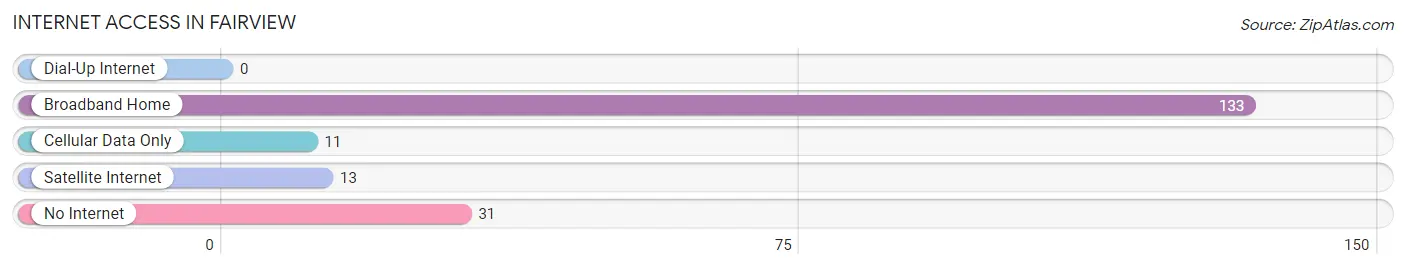
| Internet Type | # Households | % Households |
| Dial-Up Internet | 0 | 0.0% |
| Broadband Home | 133 | 70.7% |
| Cellular Data Only | 11 | 5.9% |
| Satellite Internet | 13 | 6.9% |
| No Internet | 31 | 16.5% |
| Total | 188 | 100.0% |
Fairview Summary
History
The small town of Fairview, Kansas is located in the northeast corner of the state, just south of the Nebraska border. It is part of the Clay County area and is situated on the banks of the Republican River. The town was founded in 1871 by a group of settlers from Ohio, who were looking for a place to settle and start a new life. The town was originally called Fairview because of the beautiful views of the surrounding countryside.
The town was originally a farming community, with the main crops being wheat, corn, and hay. The town also had a few small businesses, such as a general store, a blacksmith, and a post office. The town grew slowly over the years, and by the early 1900s, it had a population of around 500 people.
In the 1920s, the town began to experience a period of growth and prosperity. The population increased to over 1,000 people, and the town had several new businesses, including a bank, a hotel, and a movie theater. The town also had a school, a library, and a hospital.
The Great Depression hit Fairview hard, and the population declined to around 500 people. The town was able to survive, however, and by the 1950s, the population had grown to over 1,000 people again. The town continued to grow and prosper throughout the rest of the 20th century, and by the year 2000, the population had reached 1,717 people.
Geography
Fairview is located in the northeast corner of Kansas, just south of the Nebraska border. It is situated on the banks of the Republican River, which flows through the town. The town is located in the Clay County area, and is surrounded by rolling hills and farmland. The town is located about 25 miles from the nearest major city, Hastings, Nebraska.
The climate in Fairview is generally mild, with hot summers and cold winters. The average temperature in the summer is around 80 degrees Fahrenheit, and the average temperature in the winter is around 30 degrees Fahrenheit. The town receives an average of about 30 inches of precipitation each year.
Economy
The economy of Fairview is largely based on agriculture. The town is surrounded by farmland, and the main crops grown in the area are wheat, corn, and hay. The town also has several small businesses, including a general store, a bank, a hotel, and a movie theater.
The town also has a few manufacturing businesses, including a furniture factory and a metal fabrication plant. The town also has a few service-based businesses, such as a gas station, a restaurant, and a bar.
Demographics
As of the year 2000, the population of Fairview was 1,717 people. The town is predominantly white, with about 95% of the population being Caucasian. The remaining 5% of the population is made up of African Americans, Hispanics, and Native Americans.
The median household income in Fairview is around $35,000 per year. The town has a relatively low unemployment rate, with only about 4% of the population being unemployed. The town also has a relatively low crime rate, with only about 1.5 crimes per 1,000 people.
Common Questions
What is Per Capita Income in Fairview?
Per Capita income in Fairview is $37,267.
What is the Median Family Income in Fairview?
Median Family Income in Fairview is $63,750.
What is the Median Household income in Fairview?
Median Household Income in Fairview is $55,369.
What is Income or Wage Gap in Fairview?
Income or Wage Gap in Fairview is 59.6%.
Women in Fairview earn 40.4 cents for every dollar earned by a man.
What is Inequality or Gini Index in Fairview?
Inequality or Gini Index in Fairview is 0.36.
What is the Total Population of Fairview?
Total Population of Fairview is 334.
What is the Total Male Population of Fairview?
Total Male Population of Fairview is 200.
What is the Total Female Population of Fairview?
Total Female Population of Fairview is 134.
What is the Ratio of Males per 100 Females in Fairview?
There are 149.25 Males per 100 Females in Fairview.
What is the Ratio of Females per 100 Males in Fairview?
There are 67.00 Females per 100 Males in Fairview.
What is the Median Population Age in Fairview?
Median Population Age in Fairview is 57.5 Years.
What is the Average Family Size in Fairview
Average Family Size in Fairview is 3.0 People.
What is the Average Household Size in Fairview
Average Household Size in Fairview is 1.8 People.
How Large is the Labor Force in Fairview?
There are 221 People in the Labor Forcein in Fairview.
What is the Percentage of People in the Labor Force in Fairview?
77.5% of People are in the Labor Force in Fairview.