Florence, KS Map & Demographics
Florence Map
Florence Overview
$24,454
PER CAPITA INCOME
$69,643
AVG FAMILY INCOME
$30,208
AVG HOUSEHOLD INCOME
2.0%
WAGE / INCOME GAP [ % ]
98.0¢/ $1
WAGE / INCOME GAP [ $ ]
0.38
INEQUALITY / GINI INDEX
509
TOTAL POPULATION
296
MALE POPULATION
213
FEMALE POPULATION
138.97
MALES / 100 FEMALES
71.96
FEMALES / 100 MALES
56.5
MEDIAN AGE
3.0
AVG FAMILY SIZE
2.0
AVG HOUSEHOLD SIZE
216
LABOR FORCE [ PEOPLE ]
50.5%
PERCENT IN LABOR FORCE
1.9%
UNEMPLOYMENT RATE
Florence Zip Codes
Florence Area Codes
Income in Florence
Income Overview in Florence
Per Capita Income in Florence is $24,454, while median incomes of families and households are $69,643 and $30,208 respectively.
| Characteristic | Number | Measure |
| Per Capita Income | 509 | $24,454 |
| Median Family Income | 116 | $69,643 |
| Mean Family Income | 116 | $63,470 |
| Median Household Income | 251 | $30,208 |
| Mean Household Income | 251 | $46,800 |
| Income Deficit | 116 | $0 |
| Wage / Income Gap (%) | 509 | 1.99% |
| Wage / Income Gap ($) | 509 | 98.01¢ per $1 |
| Gini / Inequality Index | 509 | 0.38 |
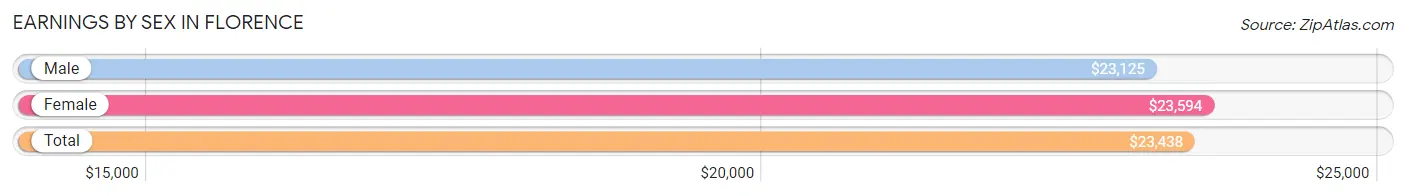
Earnings by Sex in Florence
Average Earnings in Florence are $23,438, $23,125 for men and $23,594 for women, a difference of 2.0%.
| Sex | Number | Average Earnings |
| Male | 146 (60.1%) | $23,125 |
| Female | 97 (39.9%) | $23,594 |
| Total | 243 (100.0%) | $23,438 |
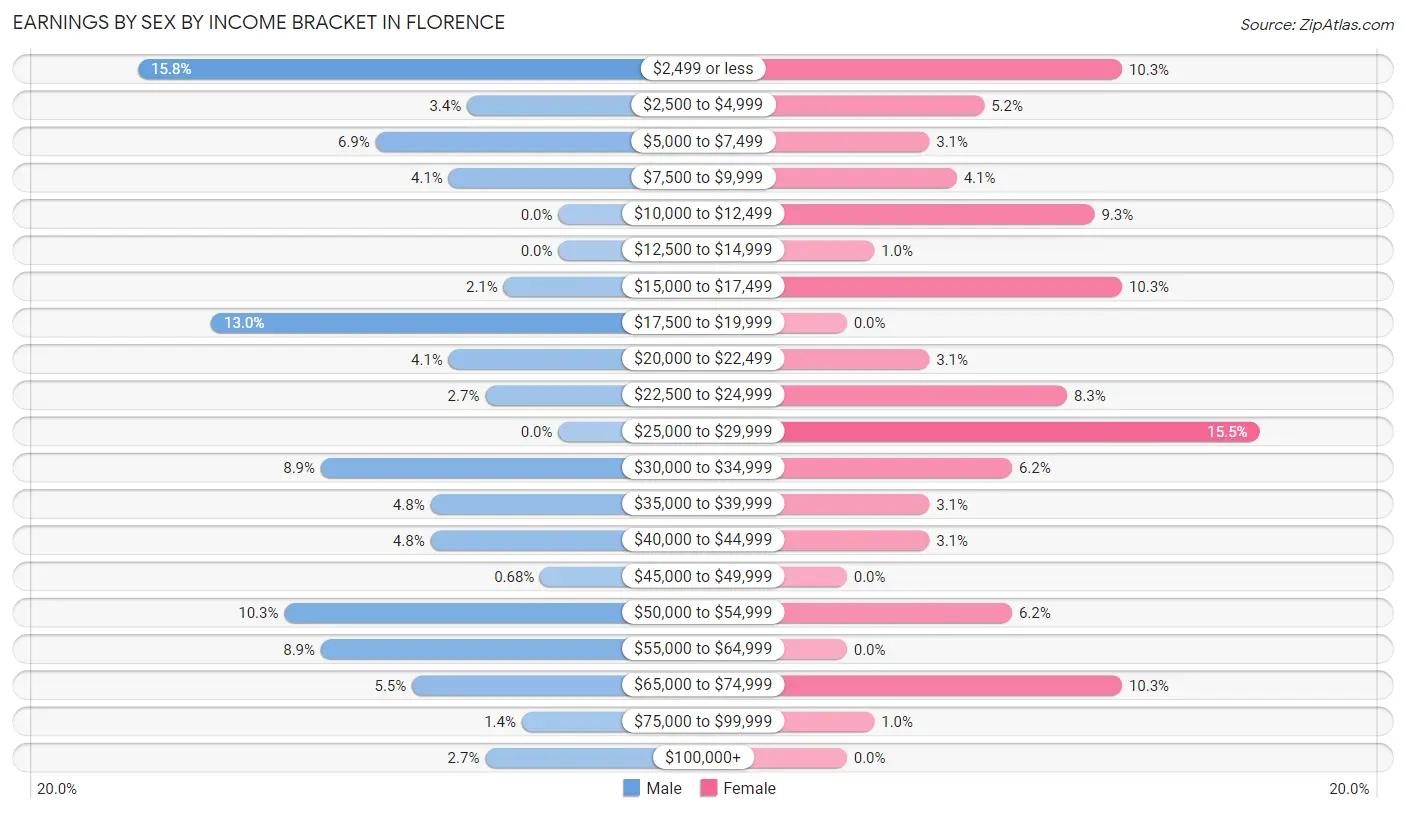
Earnings by Sex by Income Bracket in Florence
The most common earnings brackets in Florence are $2,499 or less for men (23 | 15.8%) and $25,000 to $29,999 for women (15 | 15.5%).
| Income | Male | Female |
| $2,499 or less | 23 (15.8%) | 10 (10.3%) |
| $2,500 to $4,999 | 5 (3.4%) | 5 (5.1%) |
| $5,000 to $7,499 | 10 (6.9%) | 3 (3.1%) |
| $7,500 to $9,999 | 6 (4.1%) | 4 (4.1%) |
| $10,000 to $12,499 | 0 (0.0%) | 9 (9.3%) |
| $12,500 to $14,999 | 0 (0.0%) | 1 (1.0%) |
| $15,000 to $17,499 | 3 (2.1%) | 10 (10.3%) |
| $17,500 to $19,999 | 19 (13.0%) | 0 (0.0%) |
| $20,000 to $22,499 | 6 (4.1%) | 3 (3.1%) |
| $22,500 to $24,999 | 4 (2.7%) | 8 (8.3%) |
| $25,000 to $29,999 | 0 (0.0%) | 15 (15.5%) |
| $30,000 to $34,999 | 13 (8.9%) | 6 (6.2%) |
| $35,000 to $39,999 | 7 (4.8%) | 3 (3.1%) |
| $40,000 to $44,999 | 7 (4.8%) | 3 (3.1%) |
| $45,000 to $49,999 | 1 (0.7%) | 0 (0.0%) |
| $50,000 to $54,999 | 15 (10.3%) | 6 (6.2%) |
| $55,000 to $64,999 | 13 (8.9%) | 0 (0.0%) |
| $65,000 to $74,999 | 8 (5.5%) | 10 (10.3%) |
| $75,000 to $99,999 | 2 (1.4%) | 1 (1.0%) |
| $100,000+ | 4 (2.7%) | 0 (0.0%) |
| Total | 146 (100.0%) | 97 (100.0%) |
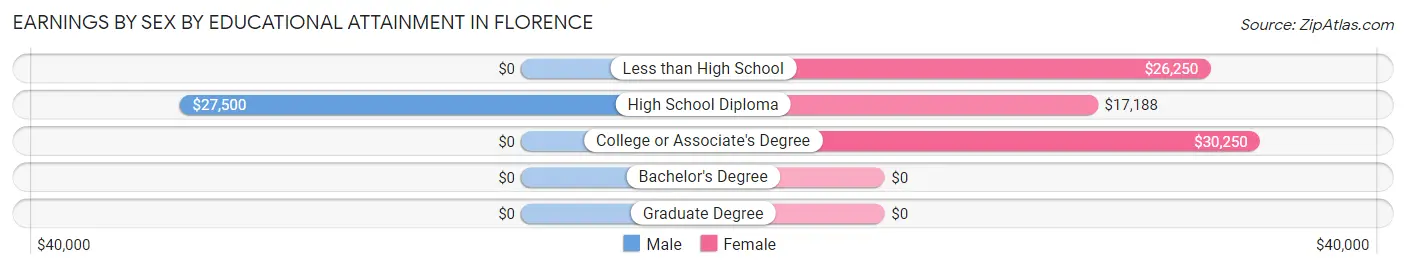
Earnings by Sex by Educational Attainment in Florence
Average earnings in Florence are $32,083 for men and $24,688 for women, a difference of 23.1%. Men with an educational attainment of high school diploma enjoy the highest average annual earnings of $27,500, while those with high school diploma education earn the least with $27,500. Women with an educational attainment of college or associate's degree earn the most with the average annual earnings of $30,250, while those with high school diploma education have the smallest earnings of $17,188.
| Educational Attainment | Male Income | Female Income |
| Less than High School | - | - |
| High School Diploma | $27,500 | $17,188 |
| College or Associate's Degree | - | - |
| Bachelor's Degree | - | - |
| Graduate Degree | - | - |
| Total | $32,083 | $24,688 |
Family Income in Florence
Family Income Brackets in Florence
According to the Florence family income data, there are 34 families falling into the $50,000 to $74,999 income range, which is the most common income bracket and makes up 29.3% of all families.
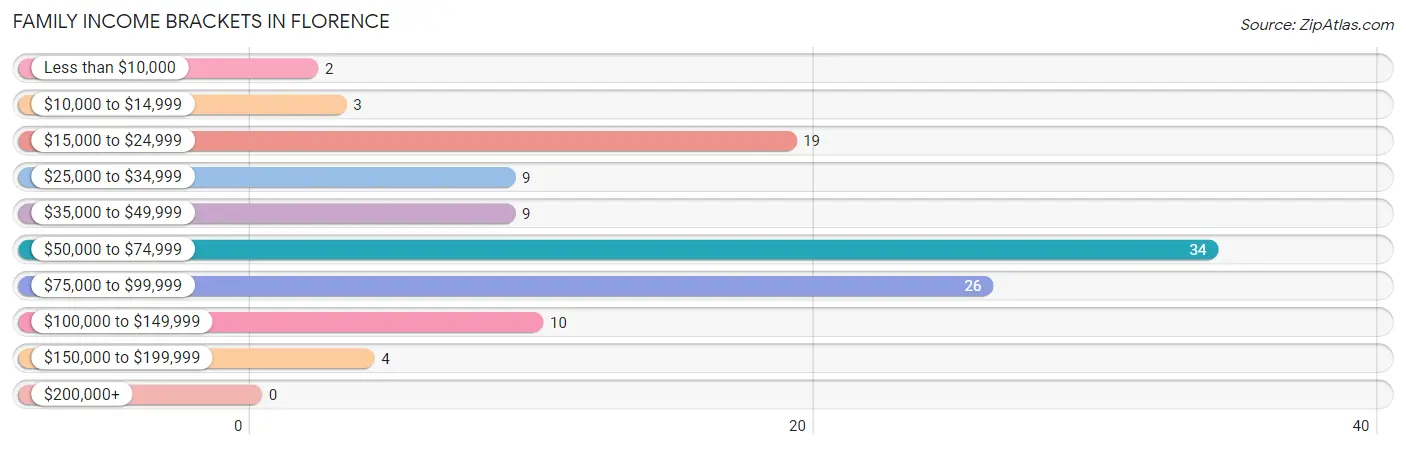
| Income Bracket | # Families | % Families |
| Less than $10,000 | 2 | 1.7% |
| $10,000 to $14,999 | 3 | 2.6% |
| $15,000 to $24,999 | 19 | 16.4% |
| $25,000 to $34,999 | 9 | 7.8% |
| $35,000 to $49,999 | 9 | 7.8% |
| $50,000 to $74,999 | 34 | 29.3% |
| $75,000 to $99,999 | 26 | 22.4% |
| $100,000 to $149,999 | 10 | 8.6% |
| $150,000 to $199,999 | 4 | 3.4% |
| $200,000+ | 0 | 0.0% |
Family Income by Famaliy Size in Florence
3-person families (20 | 17.2%) account for the highest median family income in Florence with $79,167 per family, while 2-person families (72 | 62.1%) have the highest median income of $29,286 per family member.
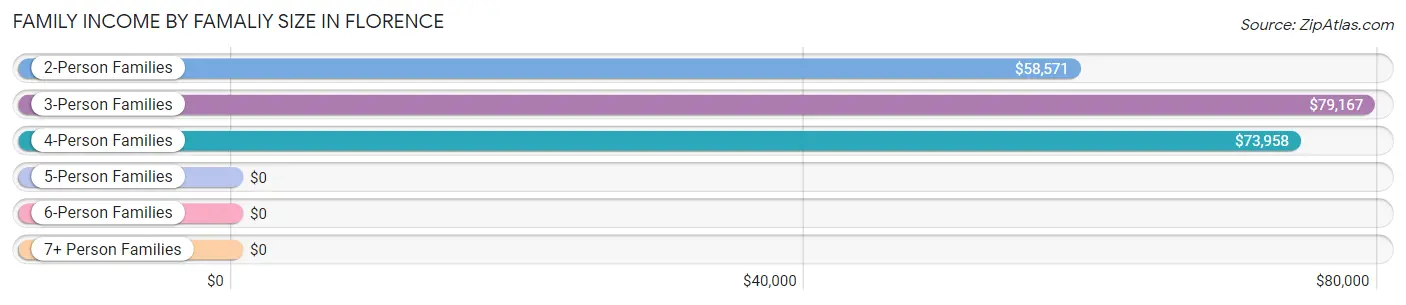
| Income Bracket | # Families | Median Income |
| 2-Person Families | 72 (62.1%) | $58,571 |
| 3-Person Families | 20 (17.2%) | $79,167 |
| 4-Person Families | 13 (11.2%) | $73,958 |
| 5-Person Families | 7 (6.0%) | $0 |
| 6-Person Families | 4 (3.5%) | $0 |
| 7+ Person Families | 0 (0.0%) | $0 |
| Total | 116 (100.0%) | $69,643 |
Family Income by Number of Earners in Florence
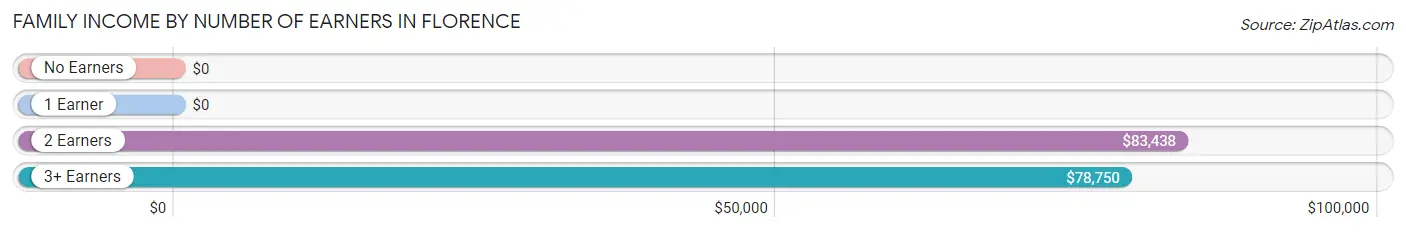
| Number of Earners | # Families | Median Income |
| No Earners | 26 (22.4%) | $0 |
| 1 Earner | 30 (25.9%) | $0 |
| 2 Earners | 45 (38.8%) | $83,438 |
| 3+ Earners | 15 (12.9%) | $78,750 |
| Total | 116 (100.0%) | $69,643 |
Household Income in Florence
Household Income Brackets in Florence
With 98 households falling in the category, the $15,000 to $24,999 income range is the most frequent in Florence, accounting for 39.0% of all households.
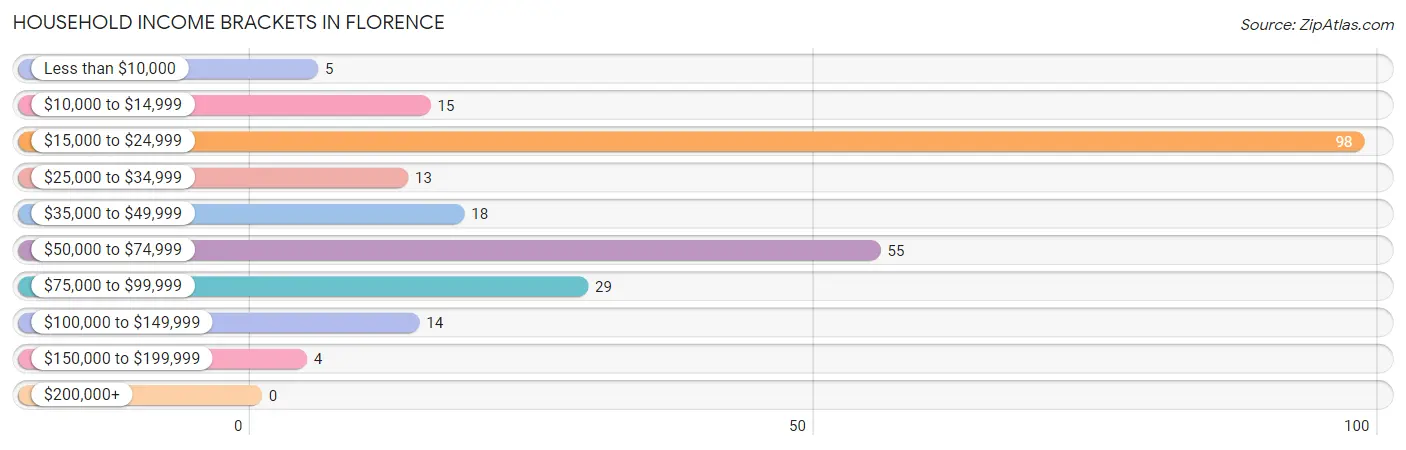
| Income Bracket | # Households | % Households |
| Less than $10,000 | 5 | 2.0% |
| $10,000 to $14,999 | 15 | 6.0% |
| $15,000 to $24,999 | 98 | 39.0% |
| $25,000 to $34,999 | 13 | 5.2% |
| $35,000 to $49,999 | 18 | 7.2% |
| $50,000 to $74,999 | 55 | 21.9% |
| $75,000 to $99,999 | 29 | 11.6% |
| $100,000 to $149,999 | 14 | 5.6% |
| $150,000 to $199,999 | 4 | 1.6% |
| $200,000+ | 0 | 0.0% |
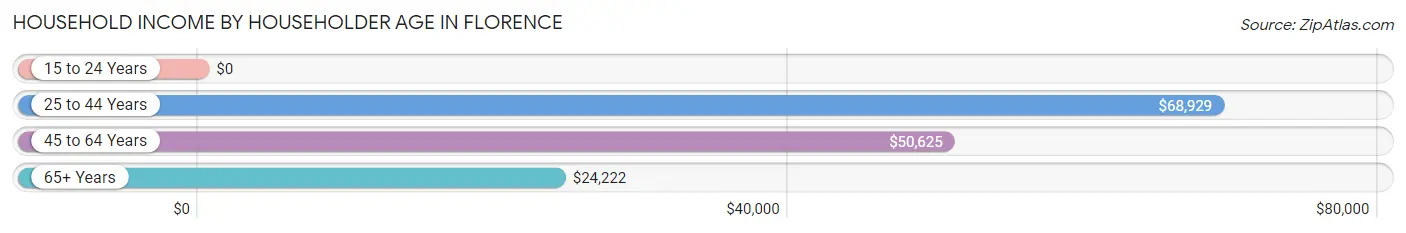
Household Income by Householder Age in Florence
The median household income in Florence is $30,208, with the highest median household income of $68,929 found in the 25 to 44 years age bracket for the primary householder. A total of 38 households (15.1%) fall into this category. Meanwhile, the 15 to 24 years age bracket for the primary householder has the lowest median household income of $0, with 5 households (2.0%) in this group.
| Income Bracket | # Households | Median Income |
| 15 to 24 Years | 5 (2.0%) | $0 |
| 25 to 44 Years | 38 (15.1%) | $68,929 |
| 45 to 64 Years | 65 (25.9%) | $50,625 |
| 65+ Years | 143 (57.0%) | $24,222 |
| Total | 251 (100.0%) | $30,208 |
Poverty in Florence
Income Below Poverty by Sex and Age in Florence
With 13.2% poverty level for males and 10.8% for females among the residents of Florence, under 5 year old males and 18 to 24 year old females are the most vulnerable to poverty, with 7 males (100.0%) and 3 females (60.0%) in their respective age groups living below the poverty level.
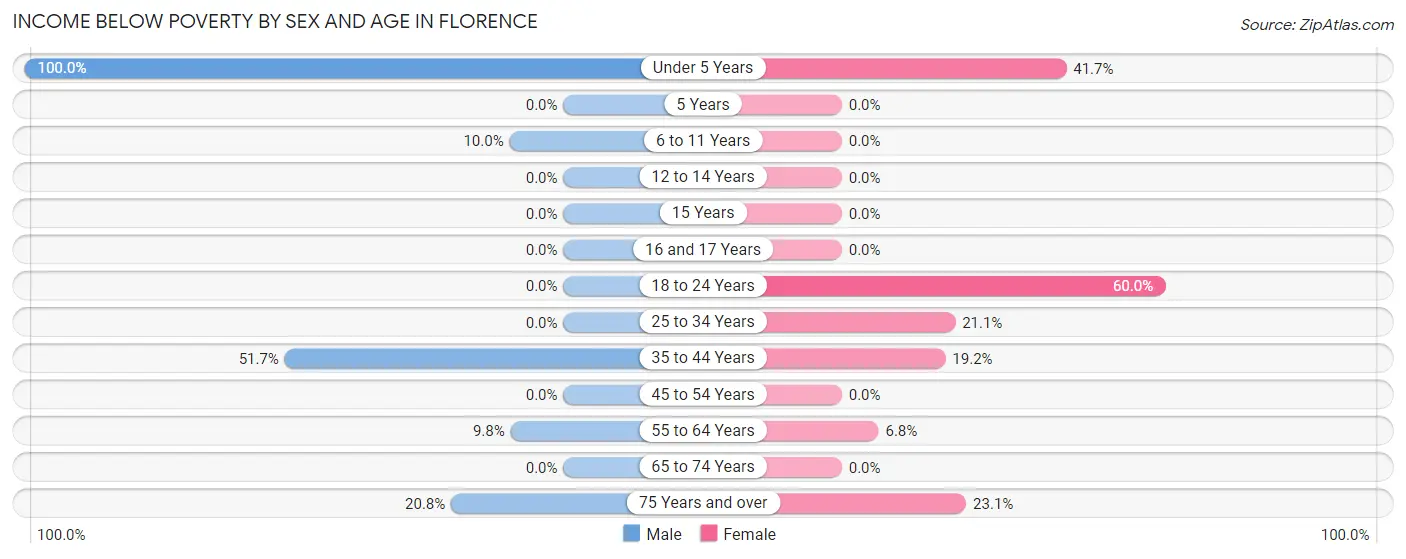
| Age Bracket | Male | Female |
| Under 5 Years | 7 (100.0%) | 5 (41.7%) |
| 5 Years | 0 (0.0%) | 0 (0.0%) |
| 6 to 11 Years | 2 (10.0%) | 0 (0.0%) |
| 12 to 14 Years | 0 (0.0%) | 0 (0.0%) |
| 15 Years | 0 (0.0%) | 0 (0.0%) |
| 16 and 17 Years | 0 (0.0%) | 0 (0.0%) |
| 18 to 24 Years | 0 (0.0%) | 3 (60.0%) |
| 25 to 34 Years | 0 (0.0%) | 4 (21.0%) |
| 35 to 44 Years | 15 (51.7%) | 5 (19.2%) |
| 45 to 54 Years | 0 (0.0%) | 0 (0.0%) |
| 55 to 64 Years | 5 (9.8%) | 3 (6.8%) |
| 65 to 74 Years | 0 (0.0%) | 0 (0.0%) |
| 75 Years and over | 10 (20.8%) | 3 (23.1%) |
| Total | 39 (13.2%) | 23 (10.8%) |
Income Above Poverty by Sex and Age in Florence
According to the poverty statistics in Florence, males aged 12 to 14 years and females aged 5 years are the age groups that are most secure financially, with 100.0% of males and 100.0% of females in these age groups living above the poverty line.
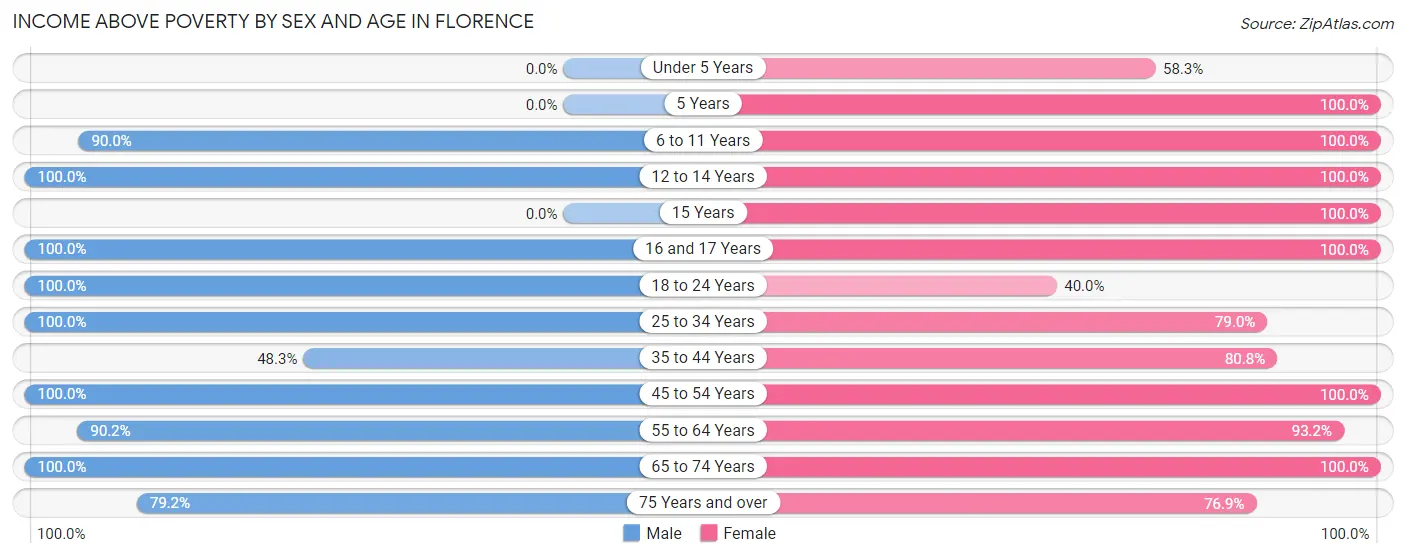
| Age Bracket | Male | Female |
| Under 5 Years | 0 (0.0%) | 7 (58.3%) |
| 5 Years | 0 (0.0%) | 10 (100.0%) |
| 6 to 11 Years | 18 (90.0%) | 8 (100.0%) |
| 12 to 14 Years | 3 (100.0%) | 13 (100.0%) |
| 15 Years | 0 (0.0%) | 8 (100.0%) |
| 16 and 17 Years | 6 (100.0%) | 8 (100.0%) |
| 18 to 24 Years | 15 (100.0%) | 2 (40.0%) |
| 25 to 34 Years | 2 (100.0%) | 15 (78.9%) |
| 35 to 44 Years | 14 (48.3%) | 21 (80.8%) |
| 45 to 54 Years | 32 (100.0%) | 12 (100.0%) |
| 55 to 64 Years | 46 (90.2%) | 41 (93.2%) |
| 65 to 74 Years | 83 (100.0%) | 35 (100.0%) |
| 75 Years and over | 38 (79.2%) | 10 (76.9%) |
| Total | 257 (86.8%) | 190 (89.2%) |
Income Below Poverty Among Married-Couple Families in Florence
The poverty statistics for married-couple families in Florence show that 8.5% or 8 of the total 94 families live below the poverty line. Families with 3 or 4 children have the highest poverty rate of 36.4%, comprising of 4 families. On the other hand, families with no children have the lowest poverty rate of 2.8%, which includes 2 families.
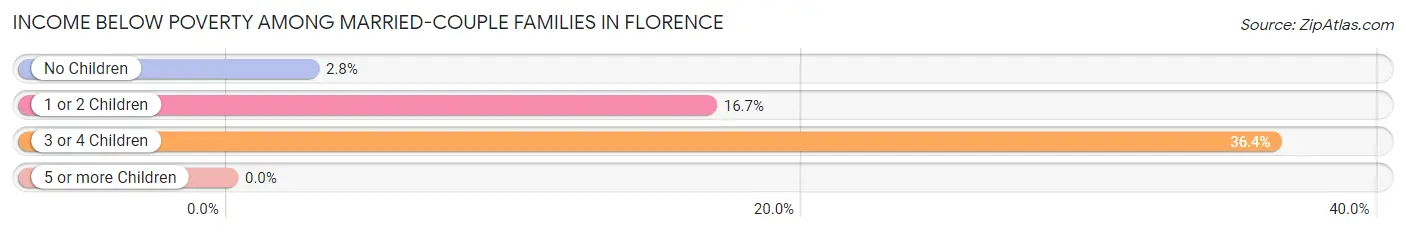
| Children | Above Poverty | Below Poverty |
| No Children | 69 (97.2%) | 2 (2.8%) |
| 1 or 2 Children | 10 (83.3%) | 2 (16.7%) |
| 3 or 4 Children | 7 (63.6%) | 4 (36.4%) |
| 5 or more Children | 0 (0.0%) | 0 (0.0%) |
| Total | 86 (91.5%) | 8 (8.5%) |
Income Below Poverty Among Single-Parent Households in Florence
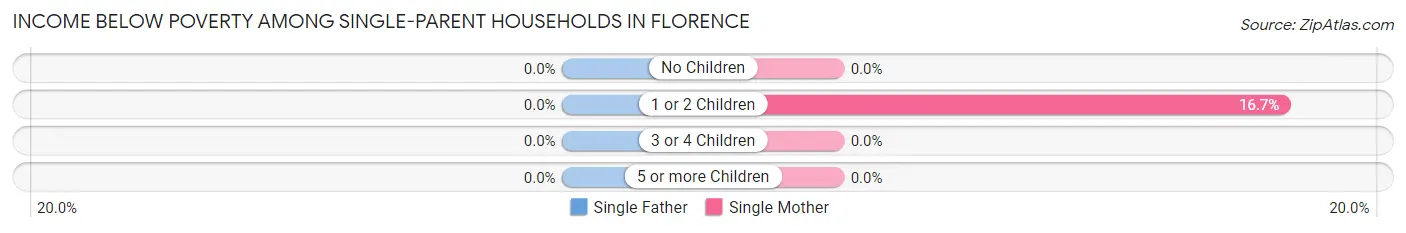
| Children | Single Father | Single Mother |
| No Children | 0 (0.0%) | 0 (0.0%) |
| 1 or 2 Children | 0 (0.0%) | 3 (16.7%) |
| 3 or 4 Children | 0 (0.0%) | 0 (0.0%) |
| 5 or more Children | 0 (0.0%) | 0 (0.0%) |
| Total | 0 (0.0%) | 3 (15.8%) |
Income Below Poverty Among Married-Couple vs Single-Parent Households in Florence
The poverty data for Florence shows that 8 of the married-couple family households (8.5%) and 3 of the single-parent households (13.6%) are living below the poverty level. Within the married-couple family households, those with 3 or 4 children have the highest poverty rate, with 4 households (36.4%) falling below the poverty line. Among the single-parent households, those with 1 or 2 children have the highest poverty rate, with 3 household (16.7%) living below poverty.
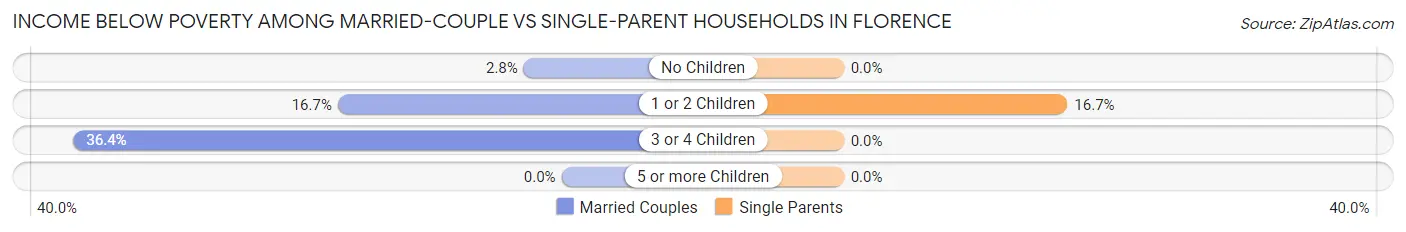
| Children | Married-Couple Families | Single-Parent Households |
| No Children | 2 (2.8%) | 0 (0.0%) |
| 1 or 2 Children | 2 (16.7%) | 3 (16.7%) |
| 3 or 4 Children | 4 (36.4%) | 0 (0.0%) |
| 5 or more Children | 0 (0.0%) | 0 (0.0%) |
| Total | 8 (8.5%) | 3 (13.6%) |
Race in Florence
The most populous races in Florence are White / Caucasian (471 | 92.5%), Hispanic or Latino (43 | 8.5%), and Native / Alaskan (22 | 4.3%).
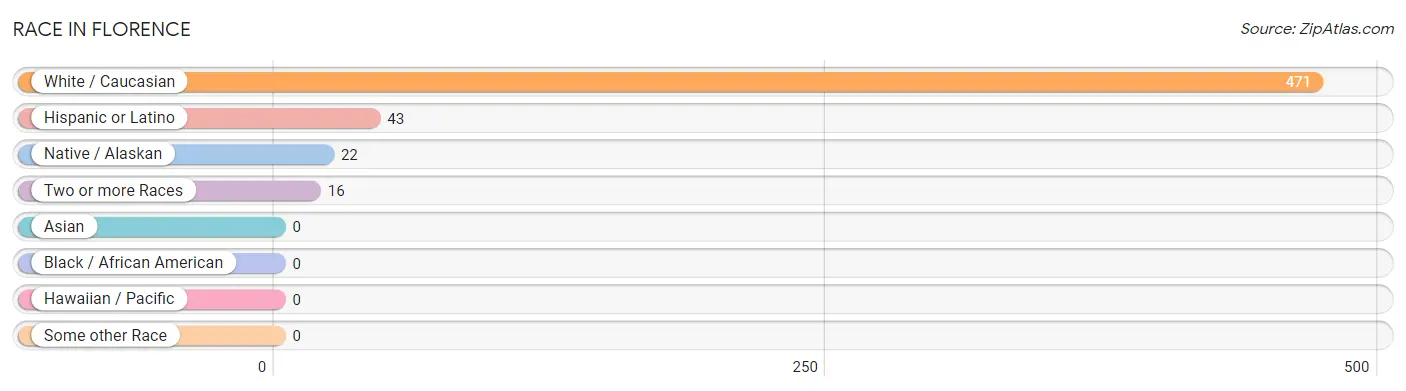
| Race | # Population | % Population |
| Asian | 0 | 0.0% |
| Black / African American | 0 | 0.0% |
| Hawaiian / Pacific | 0 | 0.0% |
| Hispanic or Latino | 43 | 8.5% |
| Native / Alaskan | 22 | 4.3% |
| White / Caucasian | 471 | 92.5% |
| Two or more Races | 16 | 3.1% |
| Some other Race | 0 | 0.0% |
| Total | 509 | 100.0% |
Ancestry in Florence
The most populous ancestries reported in Florence are German (109 | 21.4%), Irish (66 | 13.0%), English (51 | 10.0%), Scottish (27 | 5.3%), and Mexican (25 | 4.9%), together accounting for 54.6% of all Florence residents.
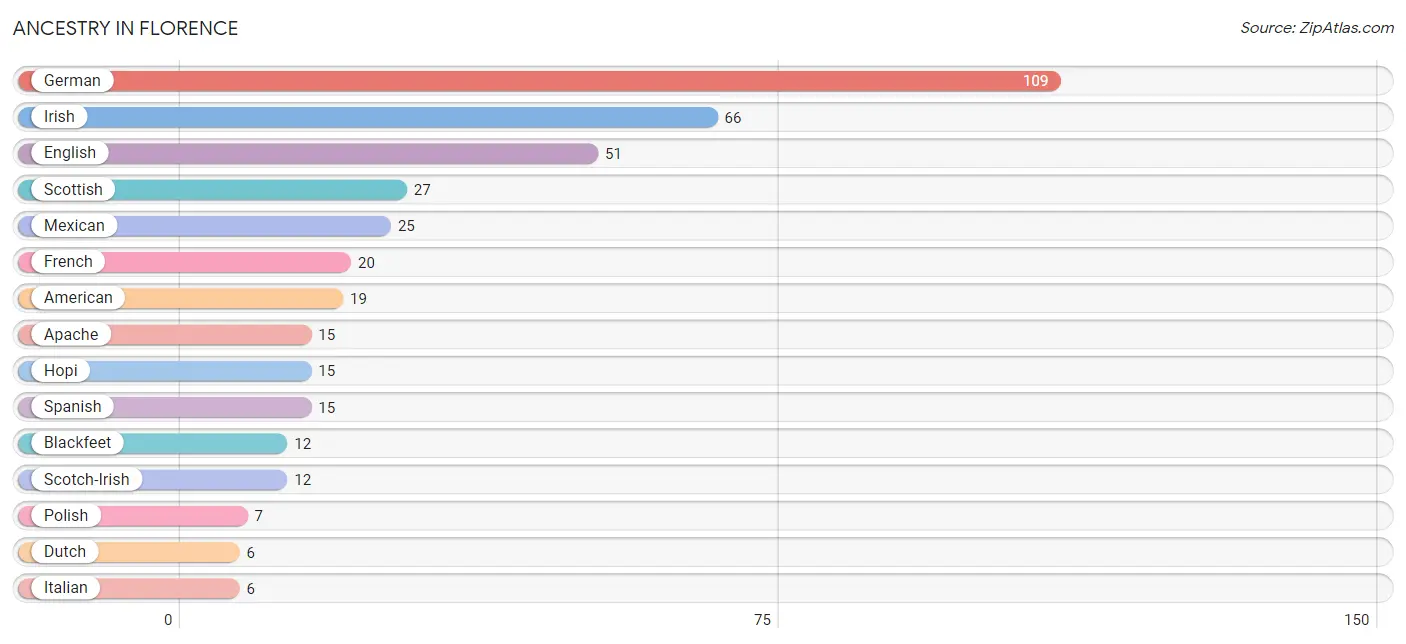
| Ancestry | # Population | % Population |
| African | 4 | 0.8% |
| American | 19 | 3.7% |
| Apache | 15 | 2.9% |
| Blackfeet | 12 | 2.4% |
| Cherokee | 3 | 0.6% |
| Choctaw | 3 | 0.6% |
| Cuban | 3 | 0.6% |
| Czech | 2 | 0.4% |
| Danish | 3 | 0.6% |
| Dutch | 6 | 1.2% |
| Eastern European | 2 | 0.4% |
| English | 51 | 10.0% |
| French | 20 | 3.9% |
| German | 109 | 21.4% |
| Hopi | 15 | 2.9% |
| Irish | 66 | 13.0% |
| Italian | 6 | 1.2% |
| Mexican | 25 | 4.9% |
| Norwegian | 3 | 0.6% |
| Pennsylvania German | 3 | 0.6% |
| Polish | 7 | 1.4% |
| Scotch-Irish | 12 | 2.4% |
| Scottish | 27 | 5.3% |
| Spanish | 15 | 2.9% |
| Subsaharan African | 4 | 0.8% | View All 25 Rows |
Immigrants in Florence

| Immigration Origin | # Population | % Population | View All 0 Rows |
Sex and Age in Florence
Sex and Age in Florence
The most populous age groups in Florence are 65 to 69 Years (65 | 22.0%) for men and 55 to 59 Years (25 | 11.7%) for women.
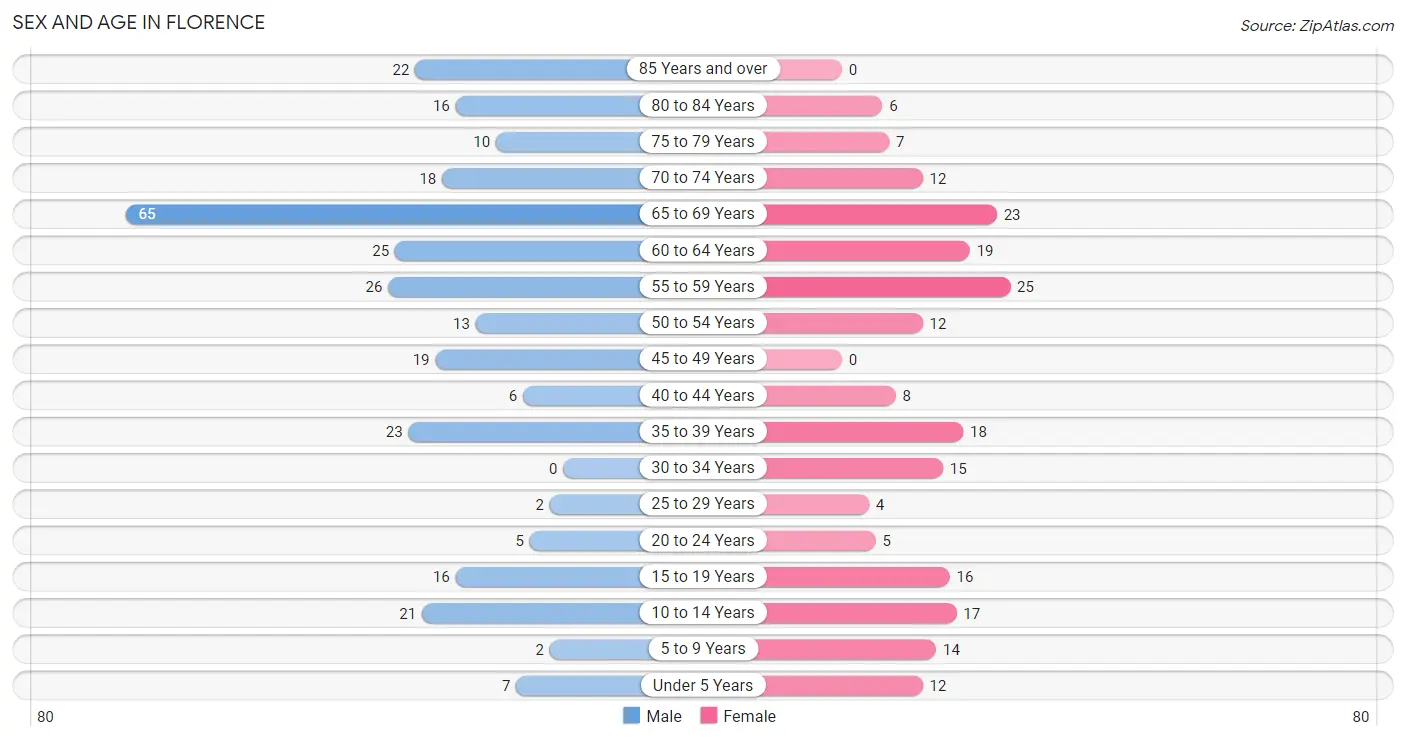
| Age Bracket | Male | Female |
| Under 5 Years | 7 (2.4%) | 12 (5.6%) |
| 5 to 9 Years | 2 (0.7%) | 14 (6.6%) |
| 10 to 14 Years | 21 (7.1%) | 17 (8.0%) |
| 15 to 19 Years | 16 (5.4%) | 16 (7.5%) |
| 20 to 24 Years | 5 (1.7%) | 5 (2.4%) |
| 25 to 29 Years | 2 (0.7%) | 4 (1.9%) |
| 30 to 34 Years | 0 (0.0%) | 15 (7.0%) |
| 35 to 39 Years | 23 (7.8%) | 18 (8.5%) |
| 40 to 44 Years | 6 (2.0%) | 8 (3.8%) |
| 45 to 49 Years | 19 (6.4%) | 0 (0.0%) |
| 50 to 54 Years | 13 (4.4%) | 12 (5.6%) |
| 55 to 59 Years | 26 (8.8%) | 25 (11.7%) |
| 60 to 64 Years | 25 (8.5%) | 19 (8.9%) |
| 65 to 69 Years | 65 (22.0%) | 23 (10.8%) |
| 70 to 74 Years | 18 (6.1%) | 12 (5.6%) |
| 75 to 79 Years | 10 (3.4%) | 7 (3.3%) |
| 80 to 84 Years | 16 (5.4%) | 6 (2.8%) |
| 85 Years and over | 22 (7.4%) | 0 (0.0%) |
| Total | 296 (100.0%) | 213 (100.0%) |
Families and Households in Florence
Median Family Size in Florence
The median family size in Florence is 3.03 persons per family, with single female/mother families (19 | 16.4%) accounting for the largest median family size of 3.21 persons per family. On the other hand, married-couple families (94 | 81.0%) represent the smallest median family size with 3.00 persons per family.
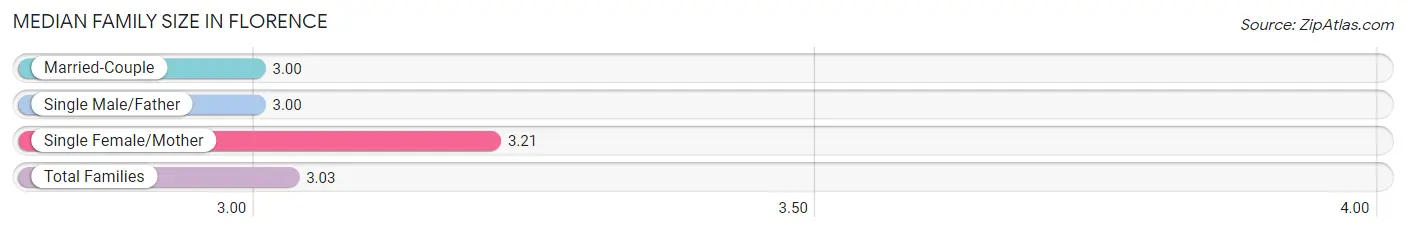
| Family Type | # Families | Family Size |
| Married-Couple | 94 (81.0%) | 3.00 |
| Single Male/Father | 3 (2.6%) | 3.00 |
| Single Female/Mother | 19 (16.4%) | 3.21 |
| Total Families | 116 (100.0%) | 3.03 |
Median Household Size in Florence
The median household size in Florence is 2.03 persons per household, with single female/mother households (19 | 7.6%) accounting for the largest median household size of 3.63 persons per household. non-family households (135 | 53.8%) represent the smallest median household size with 1.10 persons per household.
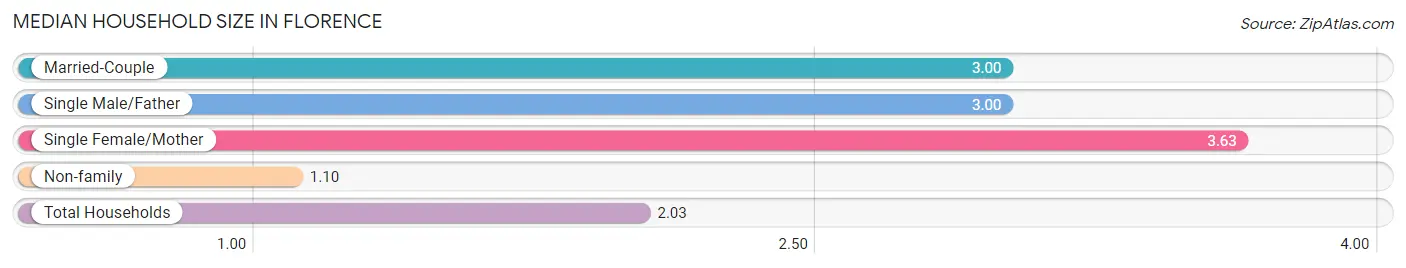
| Household Type | # Households | Household Size |
| Married-Couple | 94 (37.4%) | 3.00 |
| Single Male/Father | 3 (1.2%) | 3.00 |
| Single Female/Mother | 19 (7.6%) | 3.63 |
| Non-family | 135 (53.8%) | 1.10 |
| Total Households | 251 (100.0%) | 2.03 |
Household Size by Marriage Status in Florence
Out of a total of 251 households in Florence, 116 (46.2%) are family households, while 135 (53.8%) are nonfamily households. The most numerous type of family households are 2-person households, comprising 68, and the most common type of nonfamily households are 1-person households, comprising 124.
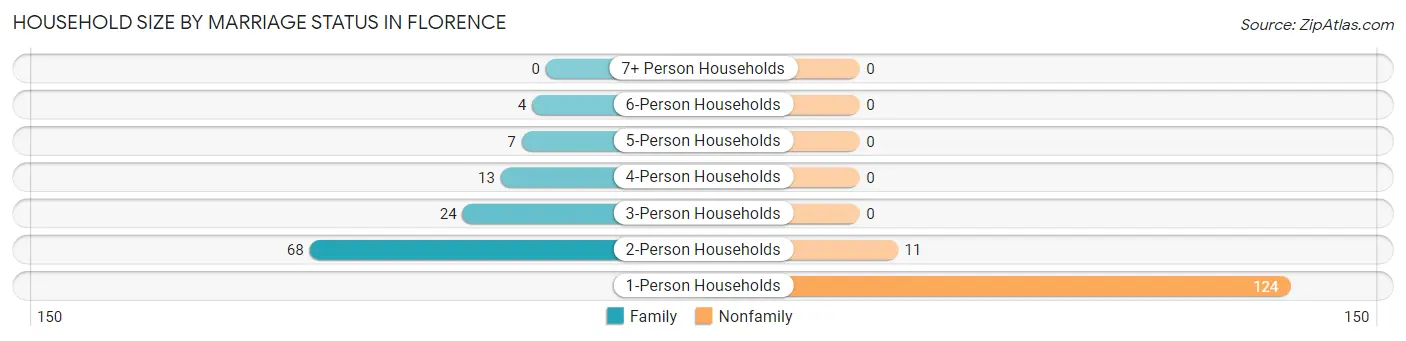
| Household Size | Family Households | Nonfamily Households |
| 1-Person Households | - | 124 (49.4%) |
| 2-Person Households | 68 (27.1%) | 11 (4.4%) |
| 3-Person Households | 24 (9.6%) | 0 (0.0%) |
| 4-Person Households | 13 (5.2%) | 0 (0.0%) |
| 5-Person Households | 7 (2.8%) | 0 (0.0%) |
| 6-Person Households | 4 (1.6%) | 0 (0.0%) |
| 7+ Person Households | 0 (0.0%) | 0 (0.0%) |
| Total | 116 (46.2%) | 135 (53.8%) |
Female Fertility in Florence
Fertility by Age in Florence
Average fertility rate in Florence is 61.0 births per 1,000 women. Women in the age bracket of 20 to 34 years have the highest fertility rate with 167.0 births per 1,000 women. Women in the age bracket of 20 to 34 years acount for 100.0% of all women with births.
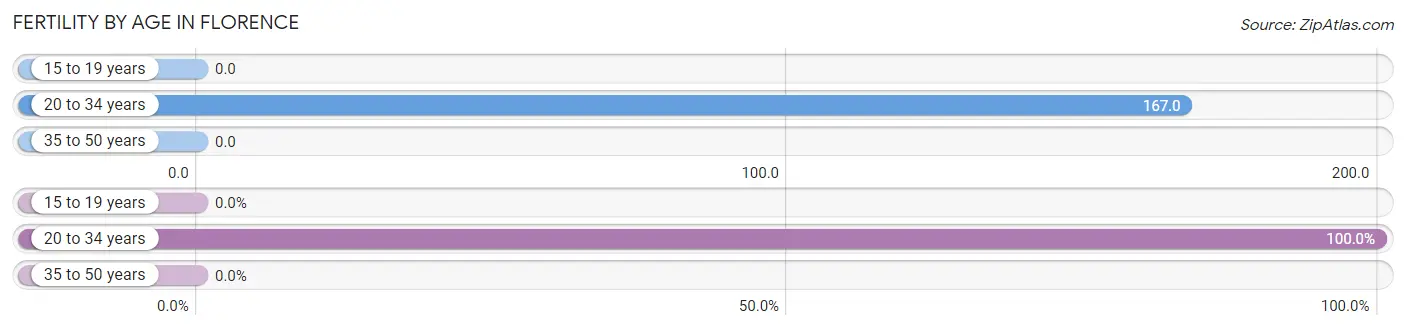
| Age Bracket | Women with Births | Births / 1,000 Women |
| 15 to 19 years | 0 (0.0%) | 0.0 |
| 20 to 34 years | 4 (100.0%) | 167.0 |
| 35 to 50 years | 0 (0.0%) | 0.0 |
| Total | 4 (100.0%) | 61.0 |
Fertility by Age by Marriage Status in Florence
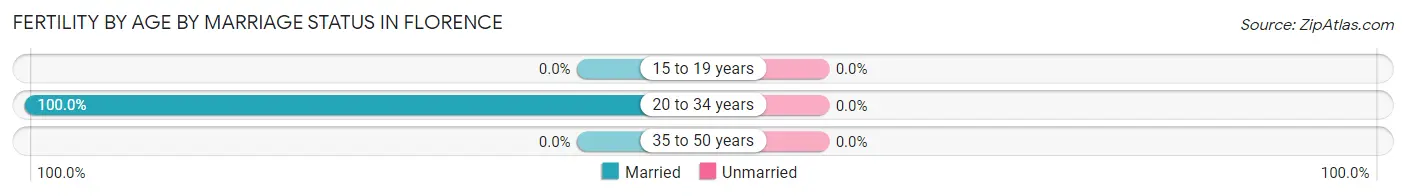
| Age Bracket | Married | Unmarried |
| 15 to 19 years | 0 (0.0%) | 0 (0.0%) |
| 20 to 34 years | 4 (100.0%) | 0 (0.0%) |
| 35 to 50 years | 0 (0.0%) | 0 (0.0%) |
| Total | 4 (100.0%) | 0 (0.0%) |
Fertility by Education in Florence
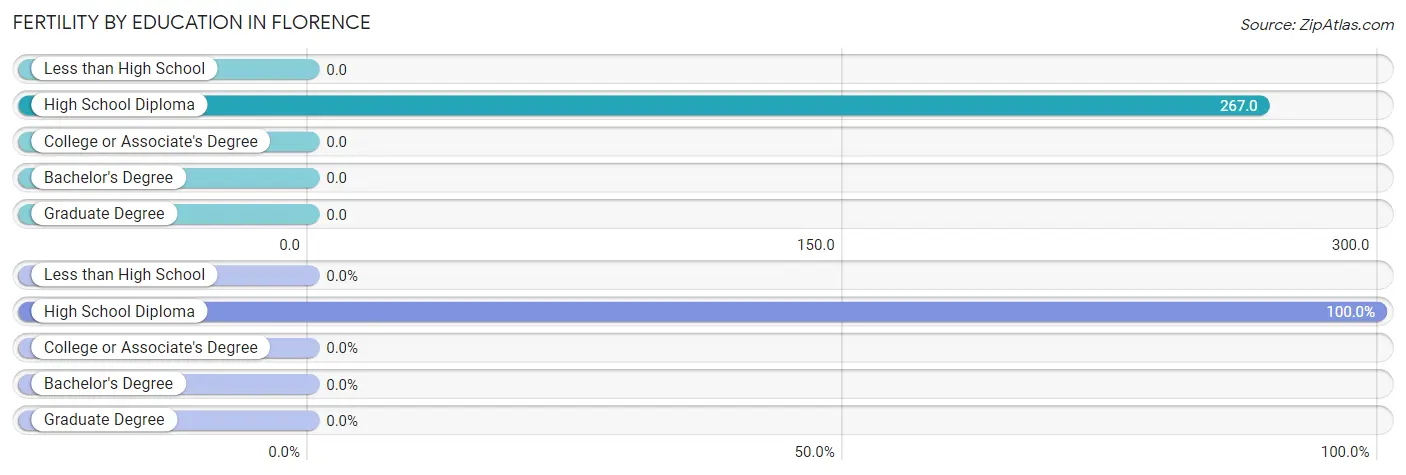
| Educational Attainment | Women with Births | Births / 1,000 Women |
| Less than High School | 0 (0.0%) | 0.0 |
| High School Diploma | 4 (100.0%) | 267.0 |
| College or Associate's Degree | 0 (0.0%) | 0.0 |
| Bachelor's Degree | 0 (0.0%) | 0.0 |
| Graduate Degree | 0 (0.0%) | 0.0 |
| Total | 4 (100.0%) | 61.0 |
Fertility by Education by Marriage Status in Florence
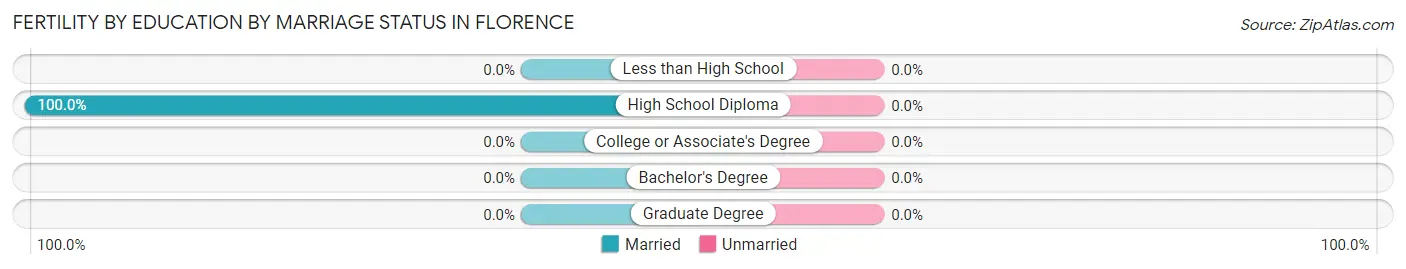
| Educational Attainment | Married | Unmarried |
| Less than High School | 0 (0.0%) | 0 (0.0%) |
| High School Diploma | 4 (100.0%) | 0 (0.0%) |
| College or Associate's Degree | 0 (0.0%) | 0 (0.0%) |
| Bachelor's Degree | 0 (0.0%) | 0 (0.0%) |
| Graduate Degree | 0 (0.0%) | 0 (0.0%) |
| Total | 4 (100.0%) | 0 (0.0%) |
Employment Characteristics in Florence
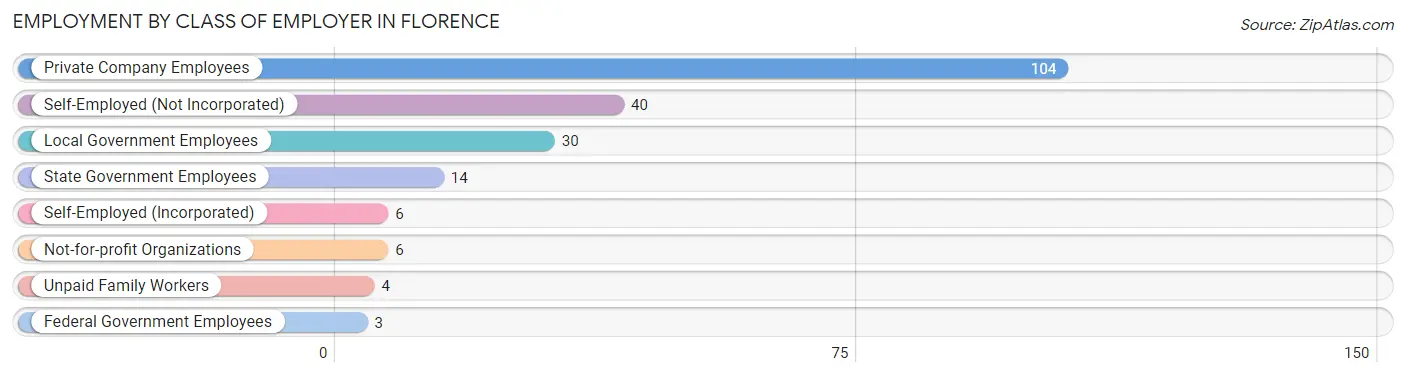
Employment by Class of Employer in Florence
Among the 207 employed individuals in Florence, private company employees (104 | 50.2%), self-employed (not incorporated) (40 | 19.3%), and local government employees (30 | 14.5%) make up the most common classes of employment.
| Employer Class | # Employees | % Employees |
| Private Company Employees | 104 | 50.2% |
| Self-Employed (Incorporated) | 6 | 2.9% |
| Self-Employed (Not Incorporated) | 40 | 19.3% |
| Not-for-profit Organizations | 6 | 2.9% |
| Local Government Employees | 30 | 14.5% |
| State Government Employees | 14 | 6.8% |
| Federal Government Employees | 3 | 1.5% |
| Unpaid Family Workers | 4 | 1.9% |
| Total | 207 | 100.0% |
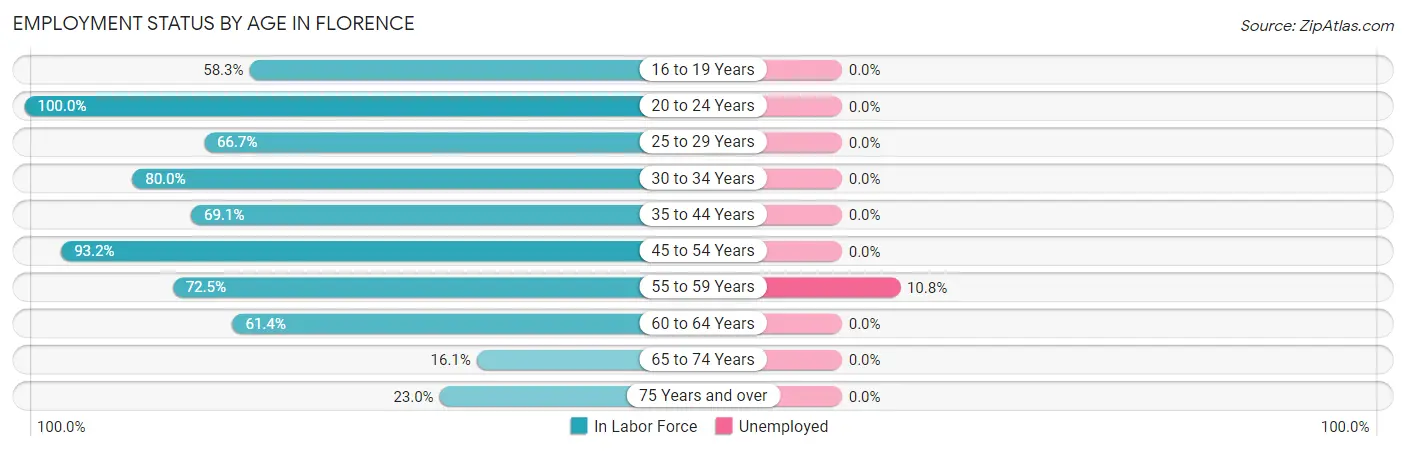
Employment Status by Age in Florence
According to the labor force statistics for Florence, out of the total population over 16 years of age (428), 50.5% or 216 individuals are in the labor force, with 1.9% or 4 of them unemployed. The age group with the highest labor force participation rate is 20 to 24 years, with 100.0% or 10 individuals in the labor force. Within the labor force, the 55 to 59 years age range has the highest percentage of unemployed individuals, with 10.8% or 4 of them being unemployed.
| Age Bracket | In Labor Force | Unemployed |
| 16 to 19 Years | 14 (58.3%) | 0 (0.0%) |
| 20 to 24 Years | 10 (100.0%) | 0 (0.0%) |
| 25 to 29 Years | 4 (66.7%) | 0 (0.0%) |
| 30 to 34 Years | 12 (80.0%) | 0 (0.0%) |
| 35 to 44 Years | 38 (69.1%) | 0 (0.0%) |
| 45 to 54 Years | 41 (93.2%) | 0 (0.0%) |
| 55 to 59 Years | 37 (72.5%) | 4 (10.8%) |
| 60 to 64 Years | 27 (61.4%) | 0 (0.0%) |
| 65 to 74 Years | 19 (16.1%) | 0 (0.0%) |
| 75 Years and over | 14 (23.0%) | 0 (0.0%) |
| Total | 216 (50.5%) | 4 (1.9%) |
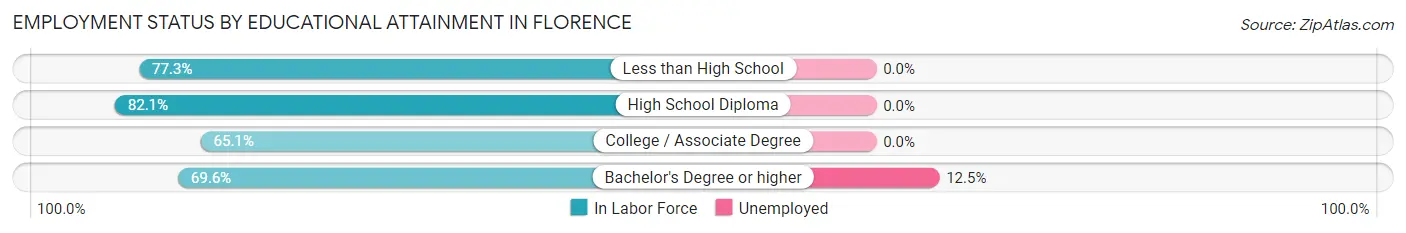
Employment Status by Educational Attainment in Florence
According to labor force statistics for Florence, 74.0% of individuals (159) out of the total population between 25 and 64 years of age (215) are in the labor force, with 2.5% or 4 of them being unemployed. The group with the highest labor force participation rate are those with the educational attainment of high school diploma, with 82.1% or 69 individuals in the labor force. Within the labor force, individuals with bachelor's degree or higher education have the highest percentage of unemployment, with 12.5% or 4 of them being unemployed.
| Educational Attainment | In Labor Force | Unemployed |
| Less than High School | 17 (77.3%) | 0 (0.0%) |
| High School Diploma | 69 (82.1%) | 0 (0.0%) |
| College / Associate Degree | 41 (65.1%) | 0 (0.0%) |
| Bachelor's Degree or higher | 32 (69.6%) | 6 (12.5%) |
| Total | 159 (74.0%) | 5 (2.5%) |
Employment Occupations by Sex in Florence
Management, Business, Science and Arts Occupations
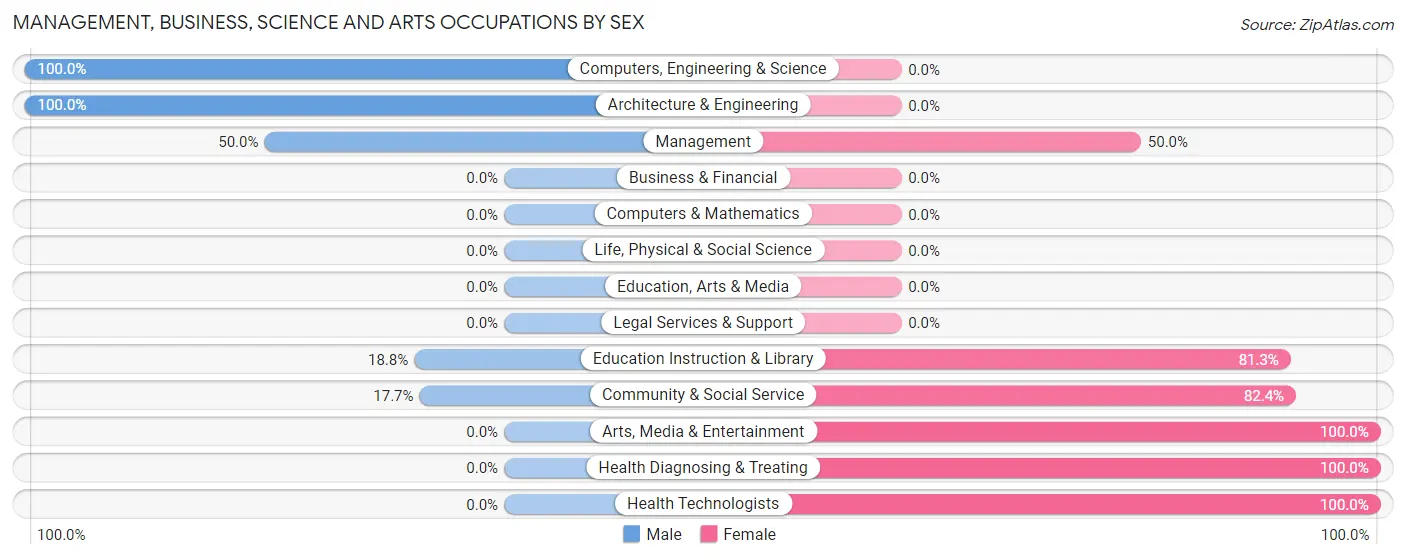
The most common Management, Business, Science and Arts occupations in Florence are Community & Social Service (17 | 8.0%), Education Instruction & Library (16 | 7.5%), Computers, Engineering & Science (11 | 5.2%), Architecture & Engineering (11 | 5.2%), and Health Diagnosing & Treating (9 | 4.3%).
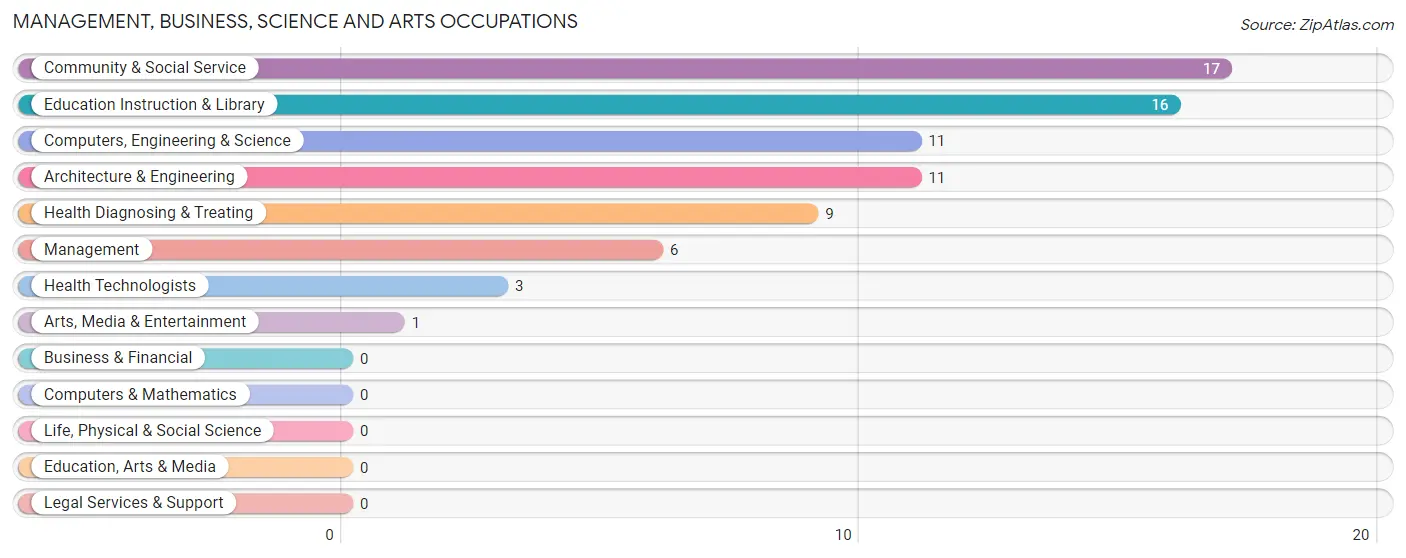
Management, Business, Science and Arts Occupations by Sex
Within the Management, Business, Science and Arts occupations in Florence, the most male-oriented occupations are Computers, Engineering & Science (100.0%), Architecture & Engineering (100.0%), and Management (50.0%), while the most female-oriented occupations are Arts, Media & Entertainment (100.0%), Health Diagnosing & Treating (100.0%), and Health Technologists (100.0%).
| Occupation | Male | Female |
| Management | 3 (50.0%) | 3 (50.0%) |
| Business & Financial | 0 (0.0%) | 0 (0.0%) |
| Computers, Engineering & Science | 11 (100.0%) | 0 (0.0%) |
| Computers & Mathematics | 0 (0.0%) | 0 (0.0%) |
| Architecture & Engineering | 11 (100.0%) | 0 (0.0%) |
| Life, Physical & Social Science | 0 (0.0%) | 0 (0.0%) |
| Community & Social Service | 3 (17.6%) | 14 (82.4%) |
| Education, Arts & Media | 0 (0.0%) | 0 (0.0%) |
| Legal Services & Support | 0 (0.0%) | 0 (0.0%) |
| Education Instruction & Library | 3 (18.8%) | 13 (81.2%) |
| Arts, Media & Entertainment | 0 (0.0%) | 1 (100.0%) |
| Health Diagnosing & Treating | 0 (0.0%) | 9 (100.0%) |
| Health Technologists | 0 (0.0%) | 3 (100.0%) |
| Total (Category) | 17 (39.5%) | 26 (60.5%) |
| Total (Overall) | 122 (57.6%) | 90 (42.4%) |
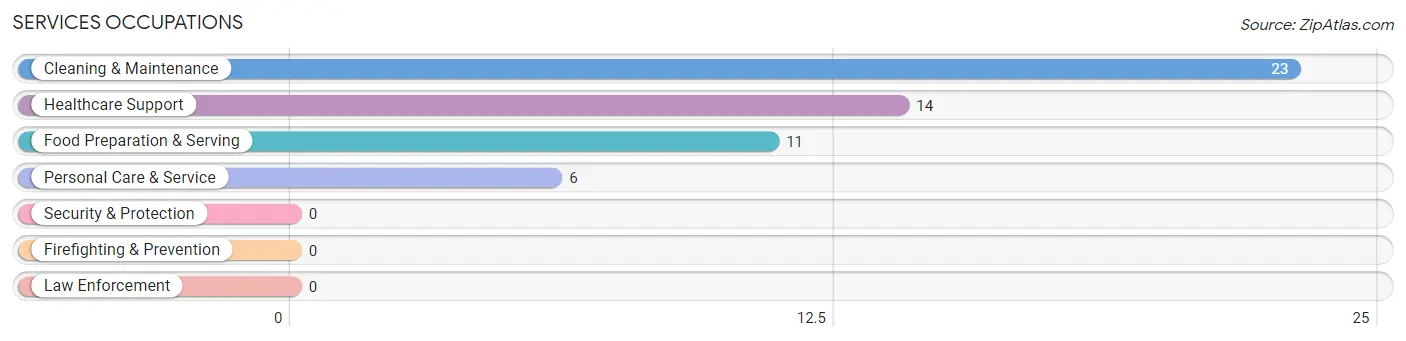
Services Occupations
The most common Services occupations in Florence are Cleaning & Maintenance (23 | 10.8%), Healthcare Support (14 | 6.6%), Food Preparation & Serving (11 | 5.2%), and Personal Care & Service (6 | 2.8%).
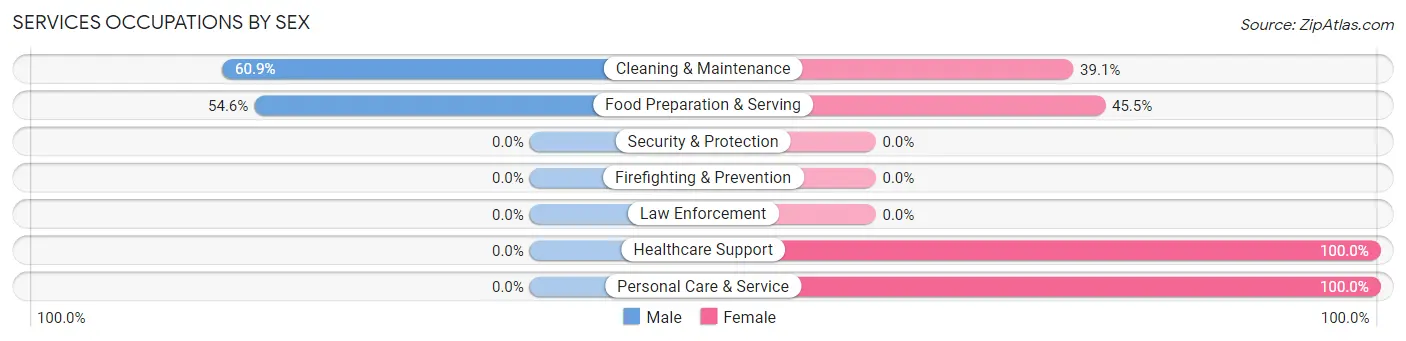
Services Occupations by Sex
Within the Services occupations in Florence, the most male-oriented occupations are Cleaning & Maintenance (60.9%), and Food Preparation & Serving (54.5%), while the most female-oriented occupations are Healthcare Support (100.0%), Personal Care & Service (100.0%), and Food Preparation & Serving (45.5%).
| Occupation | Male | Female |
| Healthcare Support | 0 (0.0%) | 14 (100.0%) |
| Security & Protection | 0 (0.0%) | 0 (0.0%) |
| Firefighting & Prevention | 0 (0.0%) | 0 (0.0%) |
| Law Enforcement | 0 (0.0%) | 0 (0.0%) |
| Food Preparation & Serving | 6 (54.5%) | 5 (45.5%) |
| Cleaning & Maintenance | 14 (60.9%) | 9 (39.1%) |
| Personal Care & Service | 0 (0.0%) | 6 (100.0%) |
| Total (Category) | 20 (37.0%) | 34 (63.0%) |
| Total (Overall) | 122 (57.6%) | 90 (42.4%) |
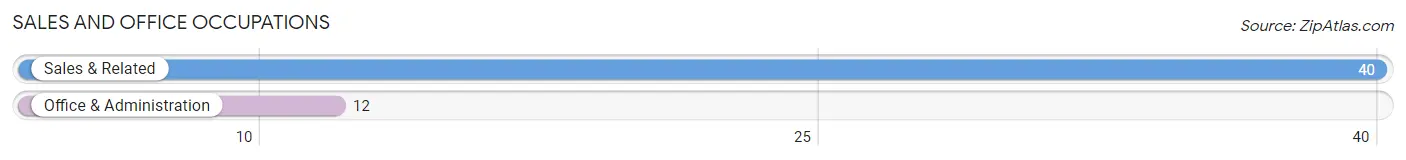
Sales and Office Occupations
The most common Sales and Office occupations in Florence are Sales & Related (40 | 18.9%), and Office & Administration (12 | 5.7%).
Sales and Office Occupations by Sex
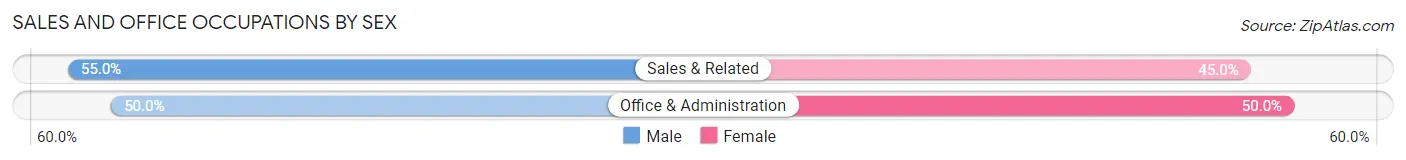
| Occupation | Male | Female |
| Sales & Related | 22 (55.0%) | 18 (45.0%) |
| Office & Administration | 6 (50.0%) | 6 (50.0%) |
| Total (Category) | 28 (53.8%) | 24 (46.2%) |
| Total (Overall) | 122 (57.6%) | 90 (42.4%) |
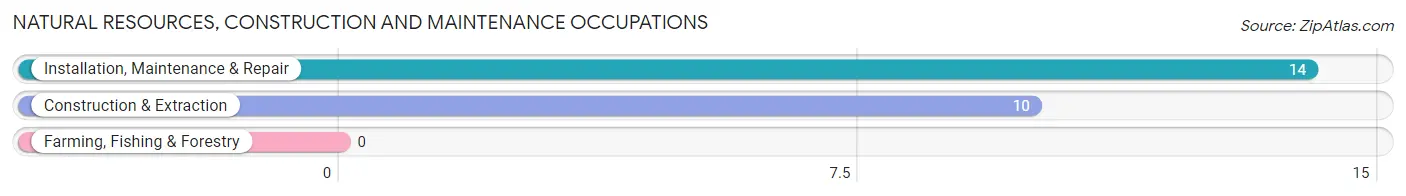
Natural Resources, Construction and Maintenance Occupations
The most common Natural Resources, Construction and Maintenance occupations in Florence are Installation, Maintenance & Repair (14 | 6.6%), and Construction & Extraction (10 | 4.7%).
Natural Resources, Construction and Maintenance Occupations by Sex
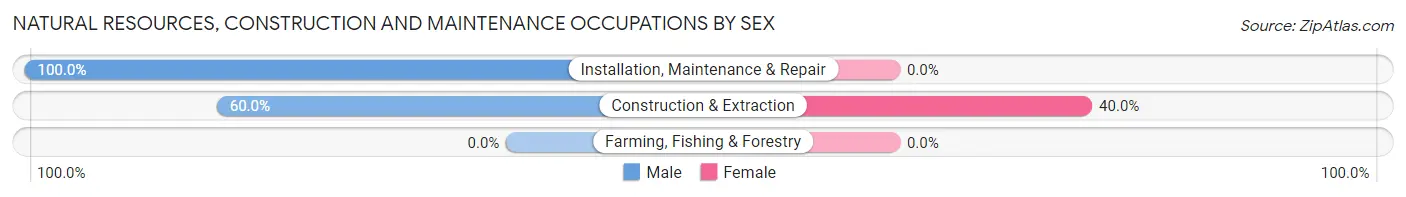
| Occupation | Male | Female |
| Farming, Fishing & Forestry | 0 (0.0%) | 0 (0.0%) |
| Construction & Extraction | 6 (60.0%) | 4 (40.0%) |
| Installation, Maintenance & Repair | 14 (100.0%) | 0 (0.0%) |
| Total (Category) | 20 (83.3%) | 4 (16.7%) |
| Total (Overall) | 122 (57.6%) | 90 (42.4%) |
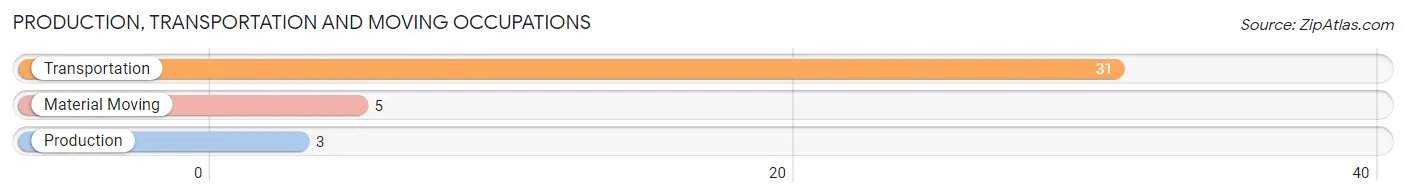
Production, Transportation and Moving Occupations
The most common Production, Transportation and Moving occupations in Florence are Transportation (31 | 14.6%), Material Moving (5 | 2.4%), and Production (3 | 1.4%).
Production, Transportation and Moving Occupations by Sex
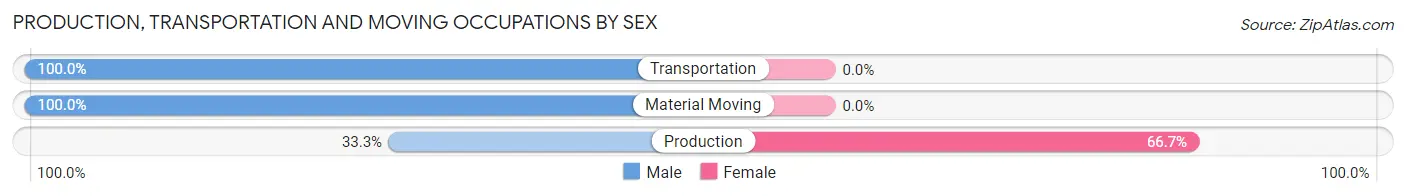
| Occupation | Male | Female |
| Production | 1 (33.3%) | 2 (66.7%) |
| Transportation | 31 (100.0%) | 0 (0.0%) |
| Material Moving | 5 (100.0%) | 0 (0.0%) |
| Total (Category) | 37 (94.9%) | 2 (5.1%) |
| Total (Overall) | 122 (57.6%) | 90 (42.4%) |
Employment Industries by Sex in Florence
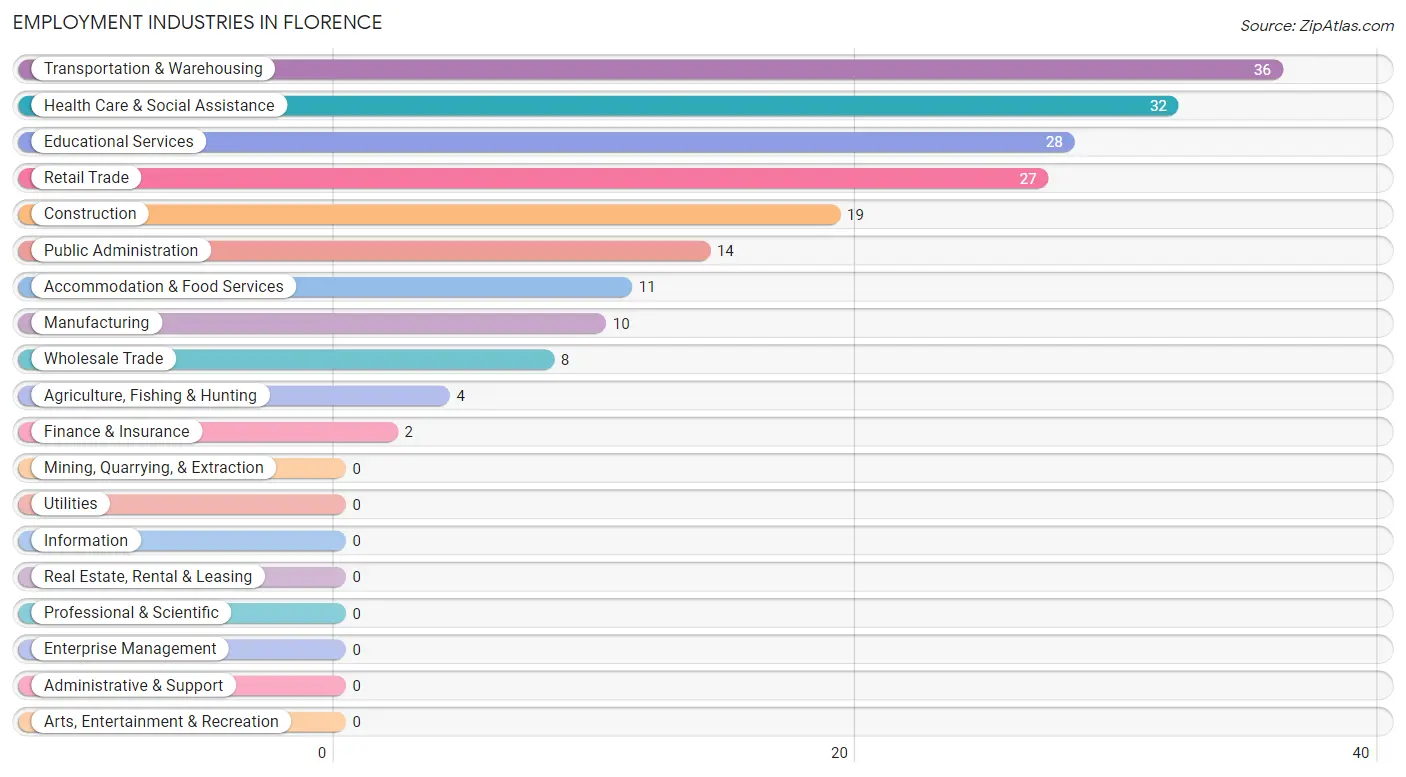
Employment Industries in Florence
The major employment industries in Florence include Transportation & Warehousing (36 | 17.0%), Health Care & Social Assistance (32 | 15.1%), Educational Services (28 | 13.2%), Retail Trade (27 | 12.7%), and Construction (19 | 9.0%).
Employment Industries by Sex in Florence
The Florence industries that see more men than women are Wholesale Trade (100.0%), Transportation & Warehousing (97.2%), and Construction (78.9%), whereas the industries that tend to have a higher number of women are Finance & Insurance (100.0%), Health Care & Social Assistance (100.0%), and Manufacturing (90.0%).
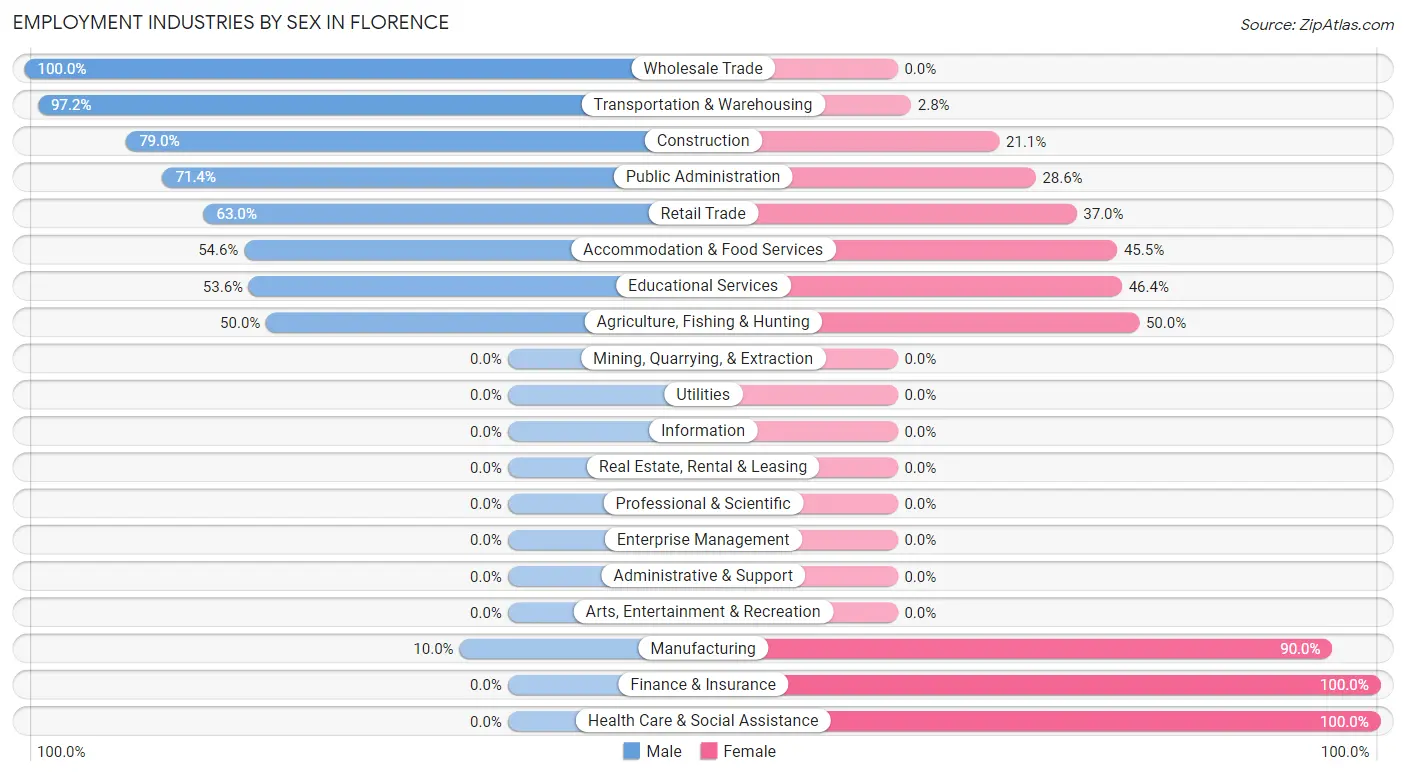
| Industry | Male | Female |
| Agriculture, Fishing & Hunting | 2 (50.0%) | 2 (50.0%) |
| Mining, Quarrying, & Extraction | 0 (0.0%) | 0 (0.0%) |
| Construction | 15 (78.9%) | 4 (21.0%) |
| Manufacturing | 1 (10.0%) | 9 (90.0%) |
| Wholesale Trade | 8 (100.0%) | 0 (0.0%) |
| Retail Trade | 17 (63.0%) | 10 (37.0%) |
| Transportation & Warehousing | 35 (97.2%) | 1 (2.8%) |
| Utilities | 0 (0.0%) | 0 (0.0%) |
| Information | 0 (0.0%) | 0 (0.0%) |
| Finance & Insurance | 0 (0.0%) | 2 (100.0%) |
| Real Estate, Rental & Leasing | 0 (0.0%) | 0 (0.0%) |
| Professional & Scientific | 0 (0.0%) | 0 (0.0%) |
| Enterprise Management | 0 (0.0%) | 0 (0.0%) |
| Administrative & Support | 0 (0.0%) | 0 (0.0%) |
| Educational Services | 15 (53.6%) | 13 (46.4%) |
| Health Care & Social Assistance | 0 (0.0%) | 32 (100.0%) |
| Arts, Entertainment & Recreation | 0 (0.0%) | 0 (0.0%) |
| Accommodation & Food Services | 6 (54.5%) | 5 (45.5%) |
| Public Administration | 10 (71.4%) | 4 (28.6%) |
| Total | 122 (57.6%) | 90 (42.4%) |
Education in Florence
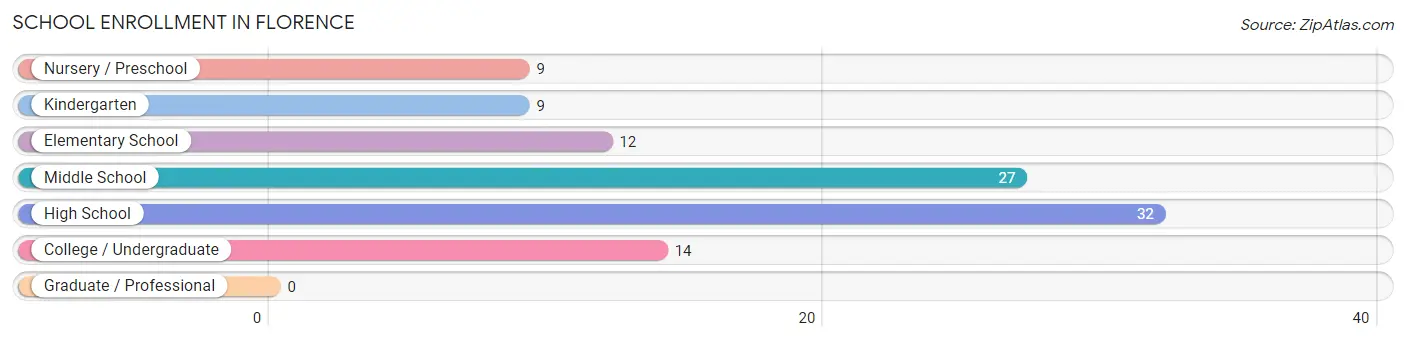
School Enrollment in Florence
The most common levels of schooling among the 103 students in Florence are high school (32 | 31.1%), middle school (27 | 26.2%), and college / undergraduate (14 | 13.6%).
| School Level | # Students | % Students |
| Nursery / Preschool | 9 | 8.7% |
| Kindergarten | 9 | 8.7% |
| Elementary School | 12 | 11.7% |
| Middle School | 27 | 26.2% |
| High School | 32 | 31.1% |
| College / Undergraduate | 14 | 13.6% |
| Graduate / Professional | 0 | 0.0% |
| Total | 103 | 100.0% |
School Enrollment by Age by Funding Source in Florence
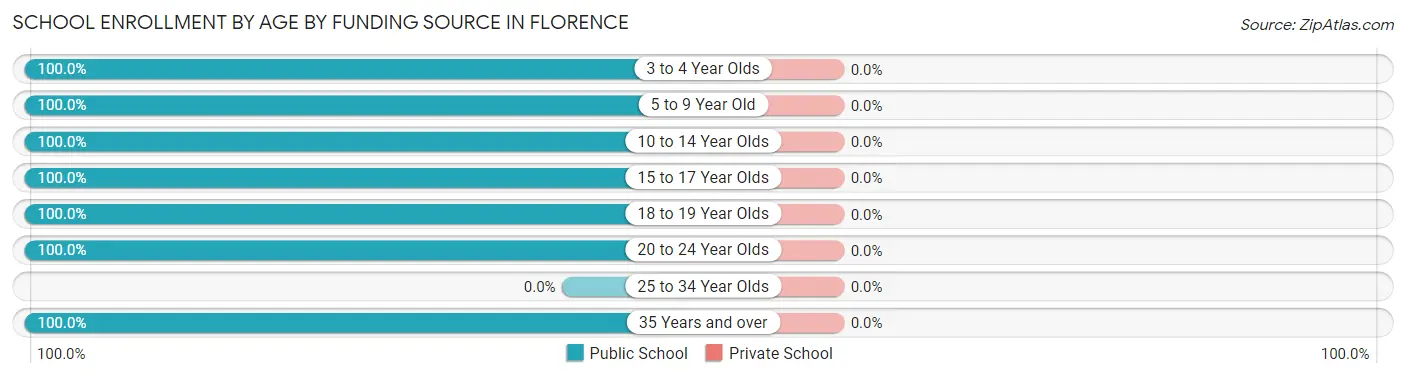
| Age Bracket | Public School | Private School |
| 3 to 4 Year Olds | 9 (100.0%) | 0 (0.0%) |
| 5 to 9 Year Old | 13 (100.0%) | 0 (0.0%) |
| 10 to 14 Year Olds | 35 (100.0%) | 0 (0.0%) |
| 15 to 17 Year Olds | 19 (100.0%) | 0 (0.0%) |
| 18 to 19 Year Olds | 10 (100.0%) | 0 (0.0%) |
| 20 to 24 Year Olds | 5 (100.0%) | 0 (0.0%) |
| 25 to 34 Year Olds | 0 (0.0%) | 0 (0.0%) |
| 35 Years and over | 12 (100.0%) | 0 (0.0%) |
| Total | 103 (100.0%) | 0 (0.0%) |
Educational Attainment by Field of Study in Florence
Science & technology (19 | 23.7%), business (13 | 16.3%), arts & humanities (10 | 12.5%), engineering (8 | 10.0%), and liberal arts & history (7 | 8.7%) are the most common fields of study among 80 individuals in Florence who have obtained a bachelor's degree or higher.
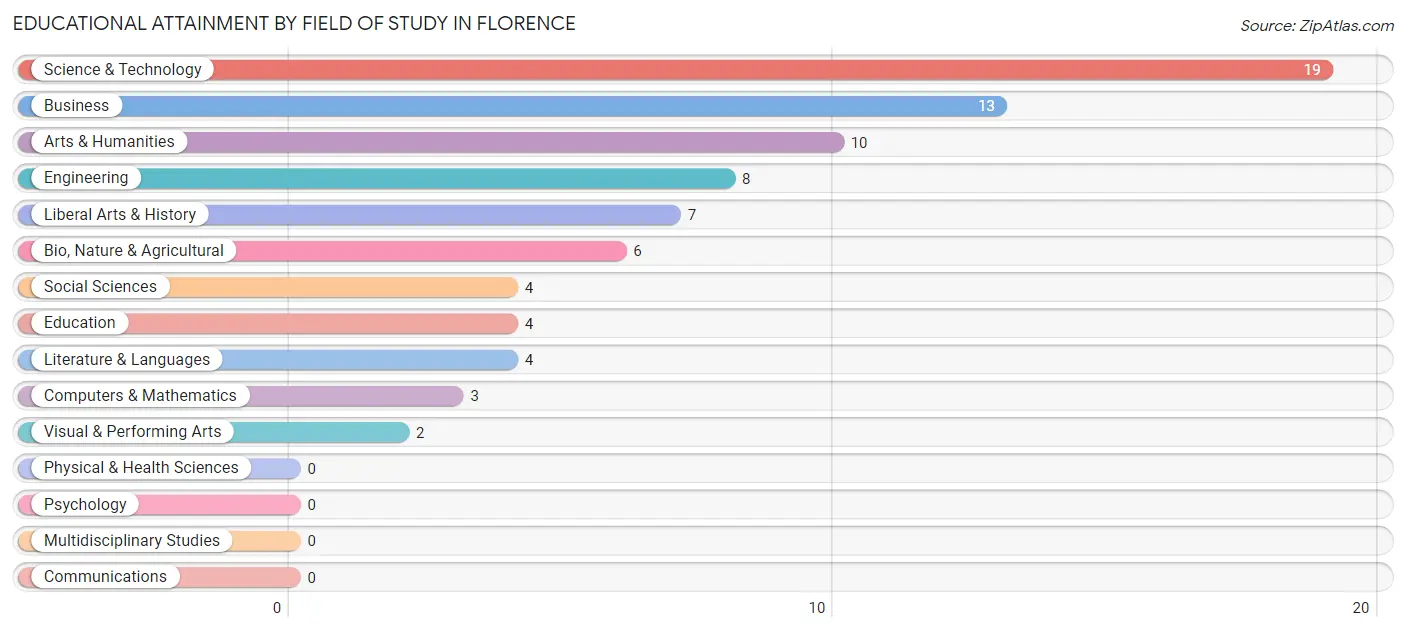
| Field of Study | # Graduates | % Graduates |
| Computers & Mathematics | 3 | 3.7% |
| Bio, Nature & Agricultural | 6 | 7.5% |
| Physical & Health Sciences | 0 | 0.0% |
| Psychology | 0 | 0.0% |
| Social Sciences | 4 | 5.0% |
| Engineering | 8 | 10.0% |
| Multidisciplinary Studies | 0 | 0.0% |
| Science & Technology | 19 | 23.7% |
| Business | 13 | 16.3% |
| Education | 4 | 5.0% |
| Literature & Languages | 4 | 5.0% |
| Liberal Arts & History | 7 | 8.7% |
| Visual & Performing Arts | 2 | 2.5% |
| Communications | 0 | 0.0% |
| Arts & Humanities | 10 | 12.5% |
| Total | 80 | 100.0% |
Transportation & Commute in Florence
Vehicle Availability by Sex in Florence
The most prevalent vehicle ownership categories in Florence are males with 3 vehicles (42, accounting for 35.9%) and females with 3 vehicles (22, making up 46.7%).
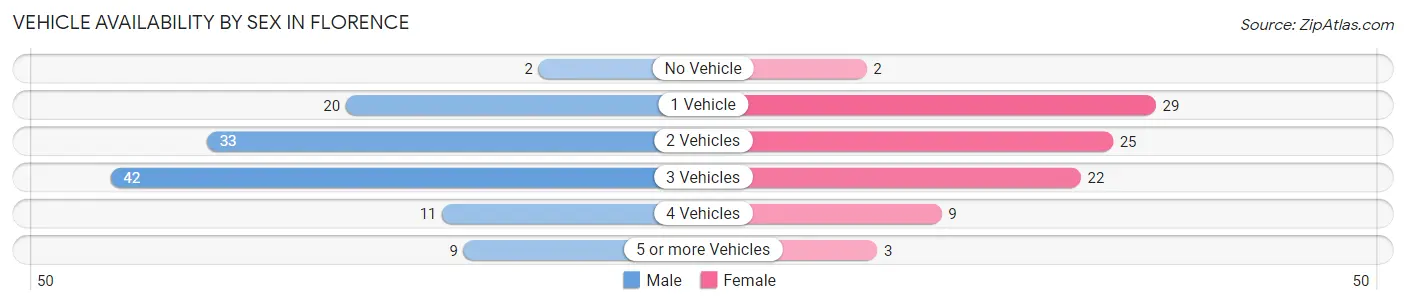
| Vehicles Available | Male | Female |
| No Vehicle | 2 (1.7%) | 2 (2.2%) |
| 1 Vehicle | 20 (17.1%) | 29 (32.2%) |
| 2 Vehicles | 33 (28.2%) | 25 (27.8%) |
| 3 Vehicles | 42 (35.9%) | 22 (24.4%) |
| 4 Vehicles | 11 (9.4%) | 9 (10.0%) |
| 5 or more Vehicles | 9 (7.7%) | 3 (3.3%) |
| Total | 117 (100.0%) | 90 (100.0%) |
Commute Time in Florence
The most frequently occuring commute durations in Florence are 30 to 34 minutes (43 commuters, 20.8%), 5 to 9 minutes (30 commuters, 14.5%), and 10 to 14 minutes (25 commuters, 12.1%).
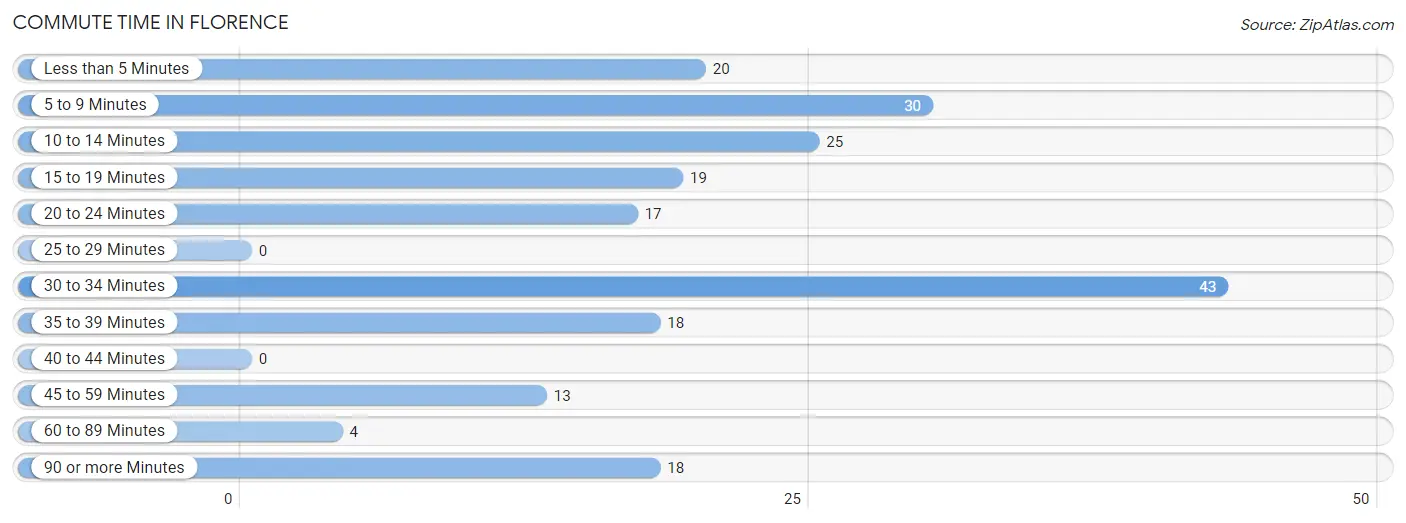
| Commute Time | # Commuters | % Commuters |
| Less than 5 Minutes | 20 | 9.7% |
| 5 to 9 Minutes | 30 | 14.5% |
| 10 to 14 Minutes | 25 | 12.1% |
| 15 to 19 Minutes | 19 | 9.2% |
| 20 to 24 Minutes | 17 | 8.2% |
| 25 to 29 Minutes | 0 | 0.0% |
| 30 to 34 Minutes | 43 | 20.8% |
| 35 to 39 Minutes | 18 | 8.7% |
| 40 to 44 Minutes | 0 | 0.0% |
| 45 to 59 Minutes | 13 | 6.3% |
| 60 to 89 Minutes | 4 | 1.9% |
| 90 or more Minutes | 18 | 8.7% |
Commute Time by Sex in Florence
The most common commute times in Florence are 5 to 9 minutes (20 commuters, 17.1%) for males and 30 to 34 minutes (31 commuters, 34.4%) for females.
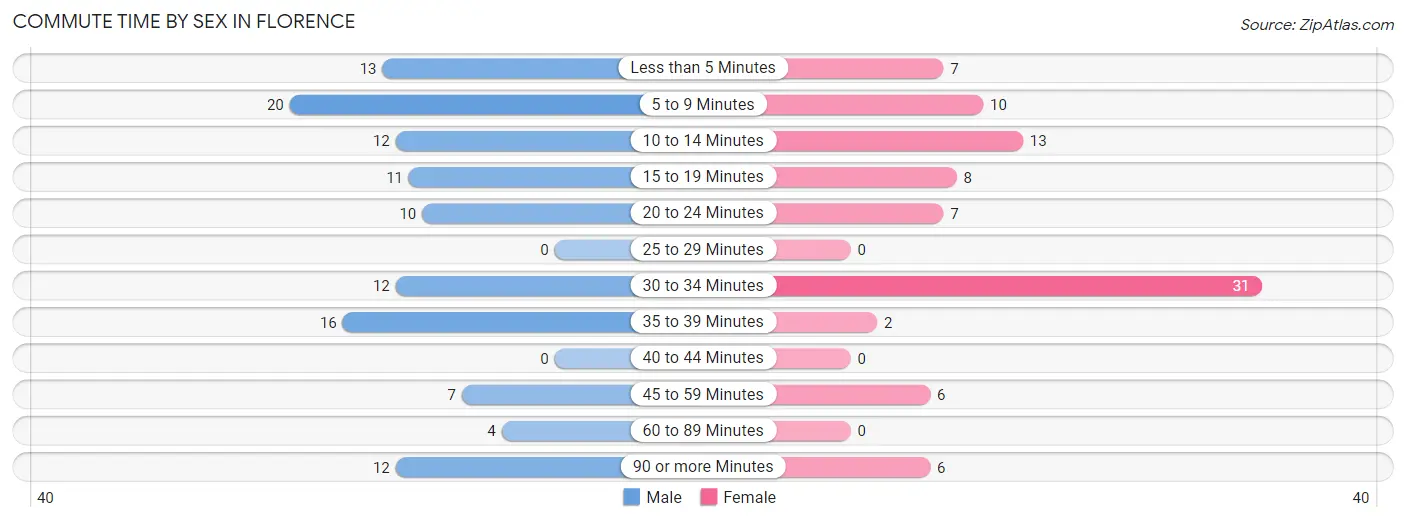
| Commute Time | Male | Female |
| Less than 5 Minutes | 13 (11.1%) | 7 (7.8%) |
| 5 to 9 Minutes | 20 (17.1%) | 10 (11.1%) |
| 10 to 14 Minutes | 12 (10.3%) | 13 (14.4%) |
| 15 to 19 Minutes | 11 (9.4%) | 8 (8.9%) |
| 20 to 24 Minutes | 10 (8.6%) | 7 (7.8%) |
| 25 to 29 Minutes | 0 (0.0%) | 0 (0.0%) |
| 30 to 34 Minutes | 12 (10.3%) | 31 (34.4%) |
| 35 to 39 Minutes | 16 (13.7%) | 2 (2.2%) |
| 40 to 44 Minutes | 0 (0.0%) | 0 (0.0%) |
| 45 to 59 Minutes | 7 (6.0%) | 6 (6.7%) |
| 60 to 89 Minutes | 4 (3.4%) | 0 (0.0%) |
| 90 or more Minutes | 12 (10.3%) | 6 (6.7%) |
Time of Departure to Work by Sex in Florence
The most frequent times of departure to work in Florence are 6:30 AM to 6:59 AM (33, 28.2%) for males and 12:00 PM to 3:59 PM (18, 20.0%) for females.
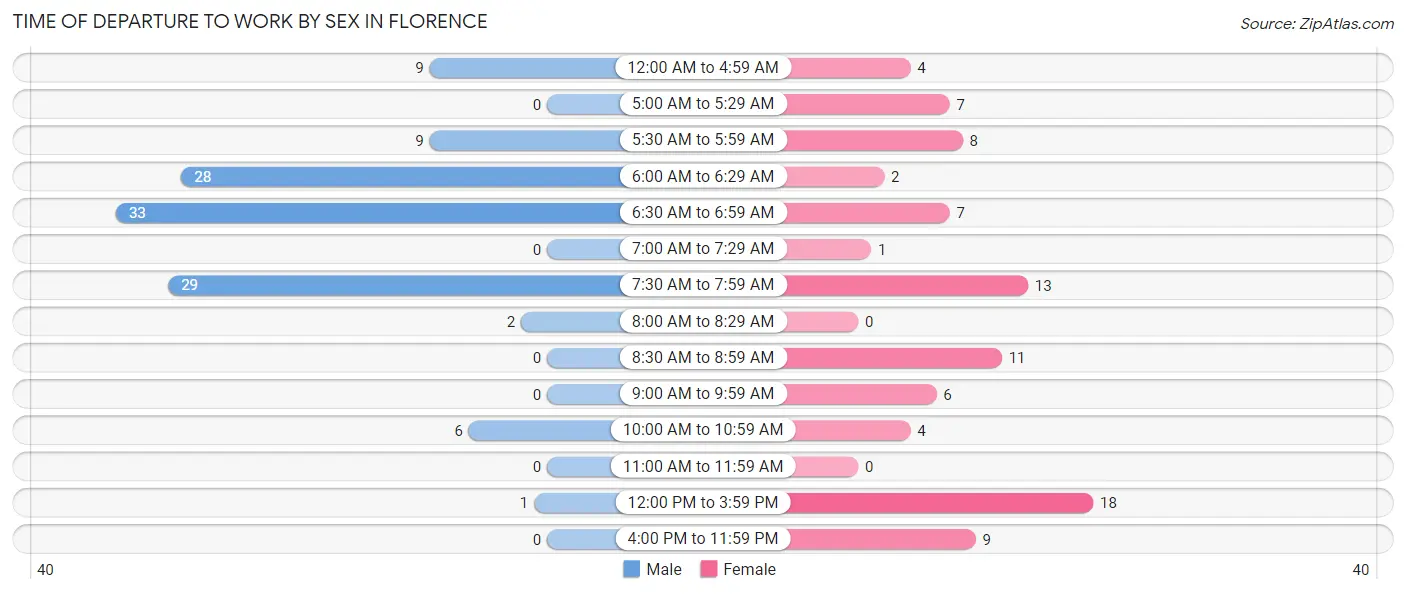
| Time of Departure | Male | Female |
| 12:00 AM to 4:59 AM | 9 (7.7%) | 4 (4.4%) |
| 5:00 AM to 5:29 AM | 0 (0.0%) | 7 (7.8%) |
| 5:30 AM to 5:59 AM | 9 (7.7%) | 8 (8.9%) |
| 6:00 AM to 6:29 AM | 28 (23.9%) | 2 (2.2%) |
| 6:30 AM to 6:59 AM | 33 (28.2%) | 7 (7.8%) |
| 7:00 AM to 7:29 AM | 0 (0.0%) | 1 (1.1%) |
| 7:30 AM to 7:59 AM | 29 (24.8%) | 13 (14.4%) |
| 8:00 AM to 8:29 AM | 2 (1.7%) | 0 (0.0%) |
| 8:30 AM to 8:59 AM | 0 (0.0%) | 11 (12.2%) |
| 9:00 AM to 9:59 AM | 0 (0.0%) | 6 (6.7%) |
| 10:00 AM to 10:59 AM | 6 (5.1%) | 4 (4.4%) |
| 11:00 AM to 11:59 AM | 0 (0.0%) | 0 (0.0%) |
| 12:00 PM to 3:59 PM | 1 (0.9%) | 18 (20.0%) |
| 4:00 PM to 11:59 PM | 0 (0.0%) | 9 (10.0%) |
| Total | 117 (100.0%) | 90 (100.0%) |
Housing Occupancy in Florence
Occupancy by Ownership in Florence
Of the total 251 dwellings in Florence, owner-occupied units account for 169 (67.3%), while renter-occupied units make up 82 (32.7%).
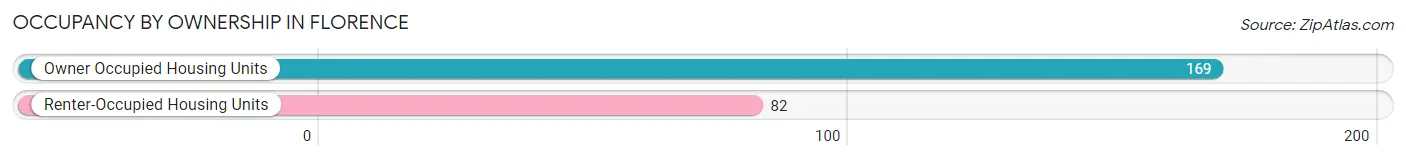
| Occupancy | # Housing Units | % Housing Units |
| Owner Occupied Housing Units | 169 | 67.3% |
| Renter-Occupied Housing Units | 82 | 32.7% |
| Total Occupied Housing Units | 251 | 100.0% |
Occupancy by Household Size in Florence
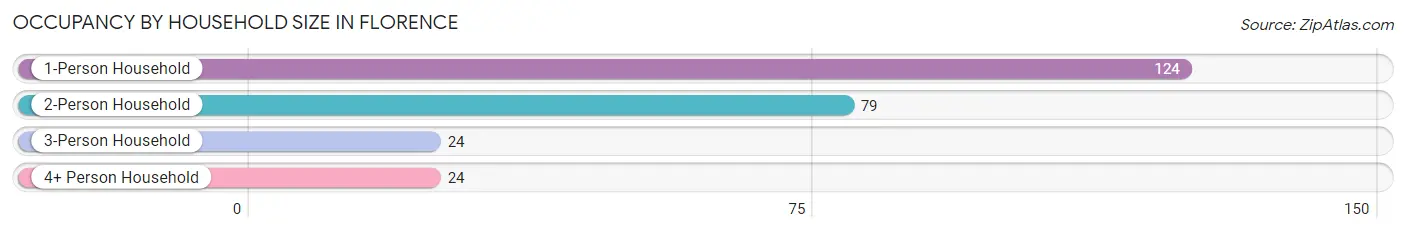
| Household Size | # Housing Units | % Housing Units |
| 1-Person Household | 124 | 49.4% |
| 2-Person Household | 79 | 31.5% |
| 3-Person Household | 24 | 9.6% |
| 4+ Person Household | 24 | 9.6% |
| Total Housing Units | 251 | 100.0% |
Occupancy by Ownership by Household Size in Florence
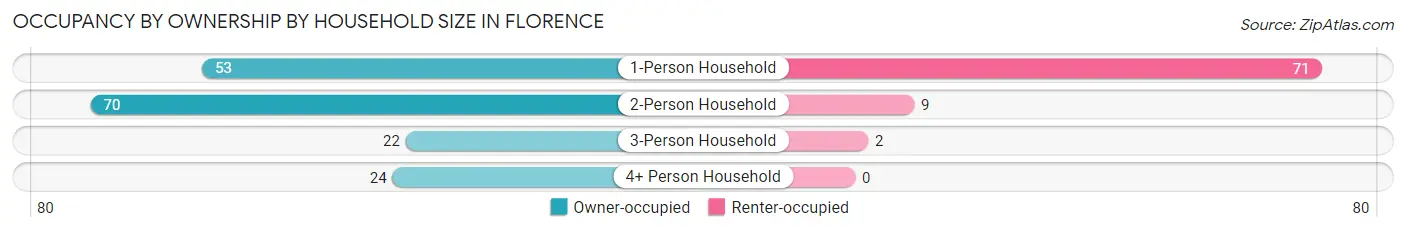
| Household Size | Owner-occupied | Renter-occupied |
| 1-Person Household | 53 (42.7%) | 71 (57.3%) |
| 2-Person Household | 70 (88.6%) | 9 (11.4%) |
| 3-Person Household | 22 (91.7%) | 2 (8.3%) |
| 4+ Person Household | 24 (100.0%) | 0 (0.0%) |
| Total Housing Units | 169 (67.3%) | 82 (32.7%) |
Occupancy by Educational Attainment in Florence
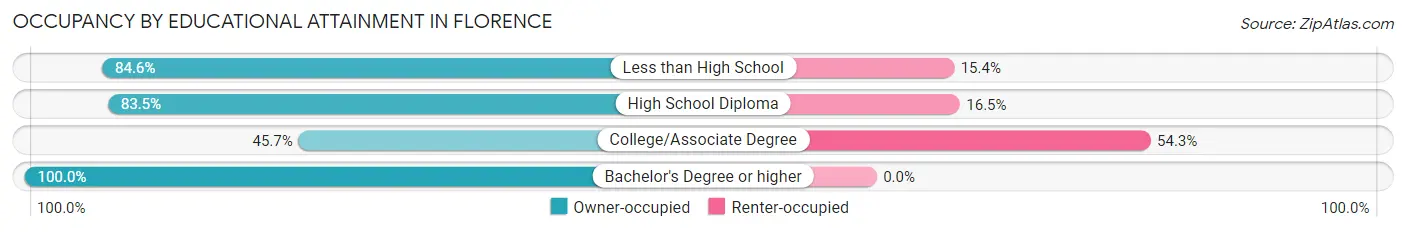
| Household Size | Owner-occupied | Renter-occupied |
| Less than High School | 11 (84.6%) | 2 (15.4%) |
| High School Diploma | 86 (83.5%) | 17 (16.5%) |
| College/Associate Degree | 53 (45.7%) | 63 (54.3%) |
| Bachelor's Degree or higher | 19 (100.0%) | 0 (0.0%) |
Occupancy by Age of Householder in Florence
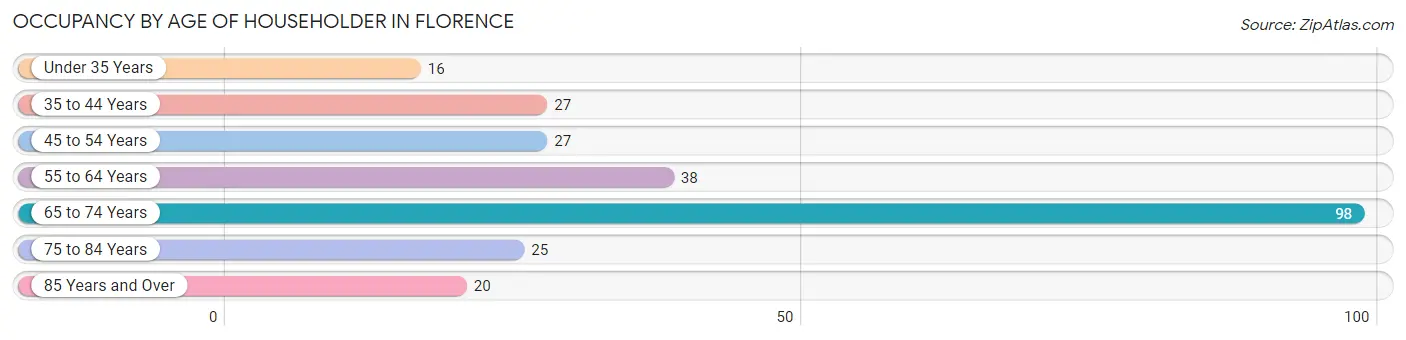
| Age Bracket | # Households | % Households |
| Under 35 Years | 16 | 6.4% |
| 35 to 44 Years | 27 | 10.8% |
| 45 to 54 Years | 27 | 10.8% |
| 55 to 64 Years | 38 | 15.1% |
| 65 to 74 Years | 98 | 39.0% |
| 75 to 84 Years | 25 | 10.0% |
| 85 Years and Over | 20 | 8.0% |
| Total | 251 | 100.0% |
Housing Finances in Florence
Median Income by Occupancy in Florence
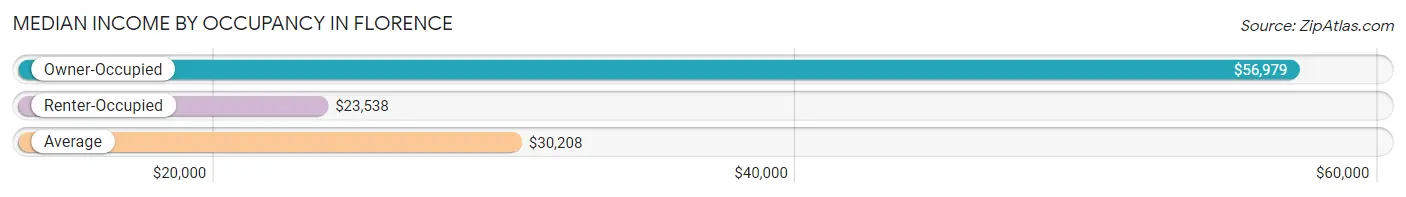
| Occupancy Type | # Households | Median Income |
| Owner-Occupied | 169 (67.3%) | $56,979 |
| Renter-Occupied | 82 (32.7%) | $23,538 |
| Average | 251 (100.0%) | $30,208 |
Occupancy by Householder Income Bracket in Florence
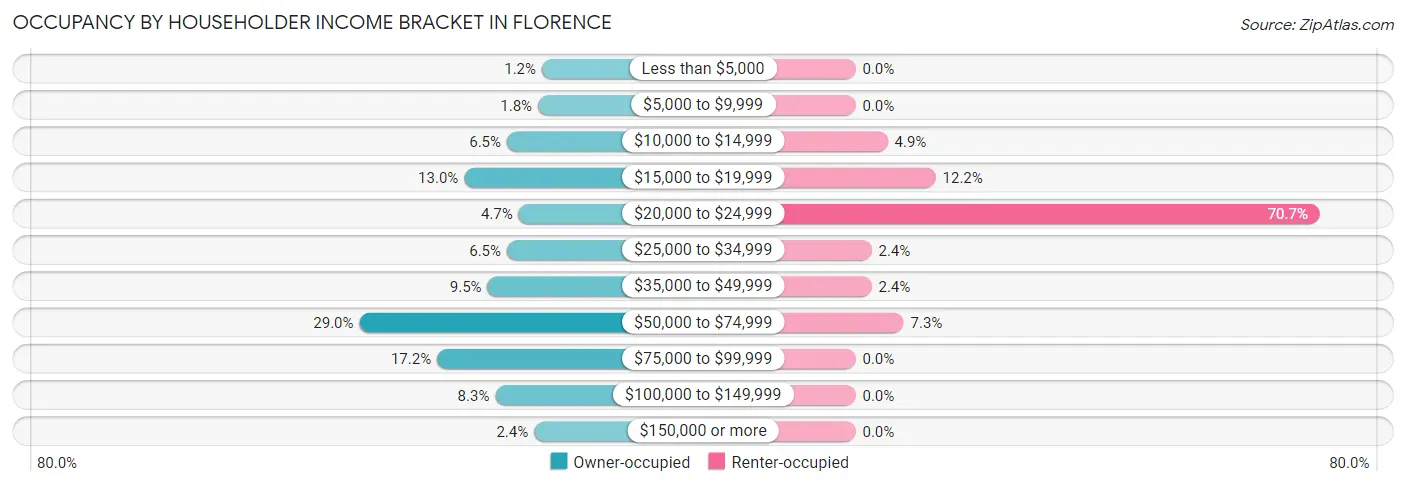
| Income Bracket | Owner-occupied | Renter-occupied |
| Less than $5,000 | 2 (1.2%) | 0 (0.0%) |
| $5,000 to $9,999 | 3 (1.8%) | 0 (0.0%) |
| $10,000 to $14,999 | 11 (6.5%) | 4 (4.9%) |
| $15,000 to $19,999 | 22 (13.0%) | 10 (12.2%) |
| $20,000 to $24,999 | 8 (4.7%) | 58 (70.7%) |
| $25,000 to $34,999 | 11 (6.5%) | 2 (2.4%) |
| $35,000 to $49,999 | 16 (9.5%) | 2 (2.4%) |
| $50,000 to $74,999 | 49 (29.0%) | 6 (7.3%) |
| $75,000 to $99,999 | 29 (17.2%) | 0 (0.0%) |
| $100,000 to $149,999 | 14 (8.3%) | 0 (0.0%) |
| $150,000 or more | 4 (2.4%) | 0 (0.0%) |
| Total | 169 (100.0%) | 82 (100.0%) |
Monthly Housing Cost Tiers in Florence
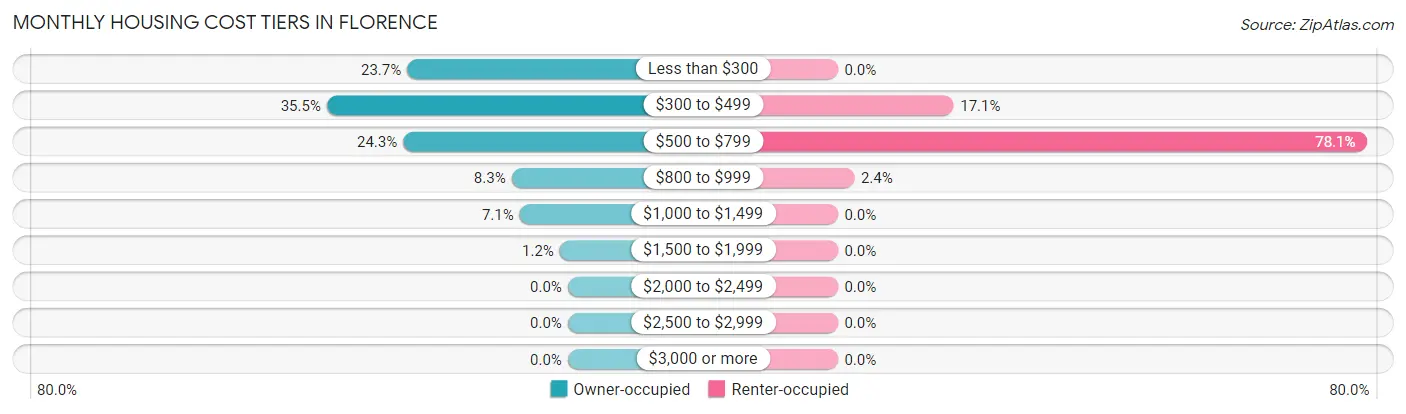
| Monthly Cost | Owner-occupied | Renter-occupied |
| Less than $300 | 40 (23.7%) | 0 (0.0%) |
| $300 to $499 | 60 (35.5%) | 14 (17.1%) |
| $500 to $799 | 41 (24.3%) | 64 (78.0%) |
| $800 to $999 | 14 (8.3%) | 2 (2.4%) |
| $1,000 to $1,499 | 12 (7.1%) | 0 (0.0%) |
| $1,500 to $1,999 | 2 (1.2%) | 0 (0.0%) |
| $2,000 to $2,499 | 0 (0.0%) | 0 (0.0%) |
| $2,500 to $2,999 | 0 (0.0%) | 0 (0.0%) |
| $3,000 or more | 0 (0.0%) | 0 (0.0%) |
| Total | 169 (100.0%) | 82 (100.0%) |
Physical Housing Characteristics in Florence
Housing Structures in Florence
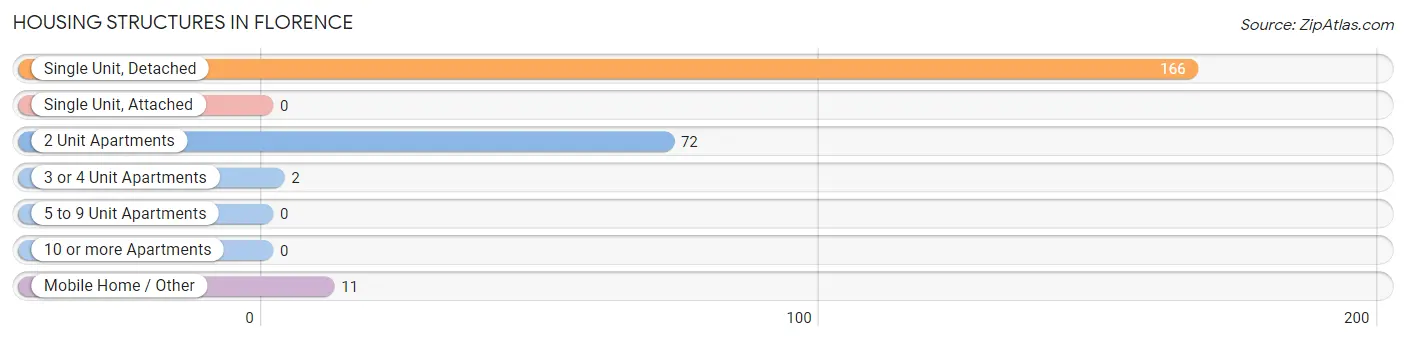
| Structure Type | # Housing Units | % Housing Units |
| Single Unit, Detached | 166 | 66.1% |
| Single Unit, Attached | 0 | 0.0% |
| 2 Unit Apartments | 72 | 28.7% |
| 3 or 4 Unit Apartments | 2 | 0.8% |
| 5 to 9 Unit Apartments | 0 | 0.0% |
| 10 or more Apartments | 0 | 0.0% |
| Mobile Home / Other | 11 | 4.4% |
| Total | 251 | 100.0% |
Housing Structures by Occupancy in Florence
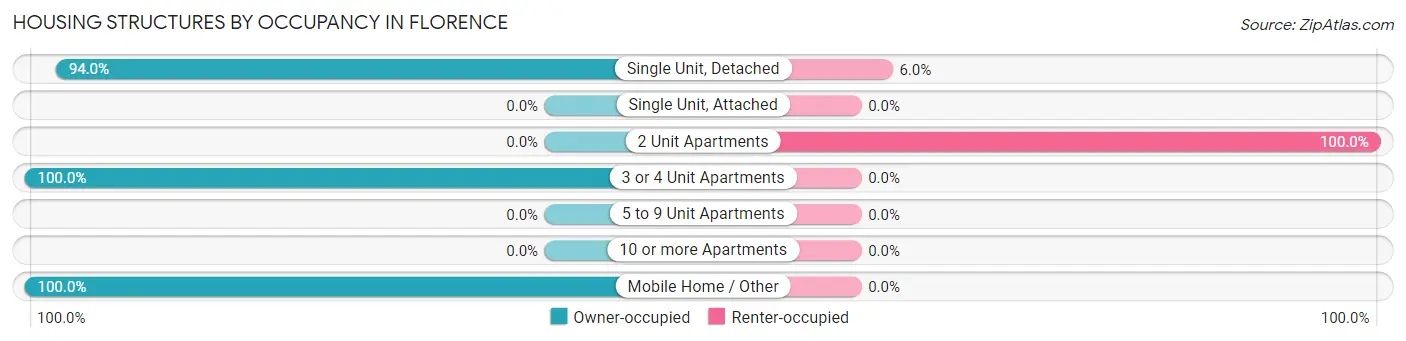
| Structure Type | Owner-occupied | Renter-occupied |
| Single Unit, Detached | 156 (94.0%) | 10 (6.0%) |
| Single Unit, Attached | 0 (0.0%) | 0 (0.0%) |
| 2 Unit Apartments | 0 (0.0%) | 72 (100.0%) |
| 3 or 4 Unit Apartments | 2 (100.0%) | 0 (0.0%) |
| 5 to 9 Unit Apartments | 0 (0.0%) | 0 (0.0%) |
| 10 or more Apartments | 0 (0.0%) | 0 (0.0%) |
| Mobile Home / Other | 11 (100.0%) | 0 (0.0%) |
| Total | 169 (67.3%) | 82 (32.7%) |
Housing Structures by Number of Rooms in Florence
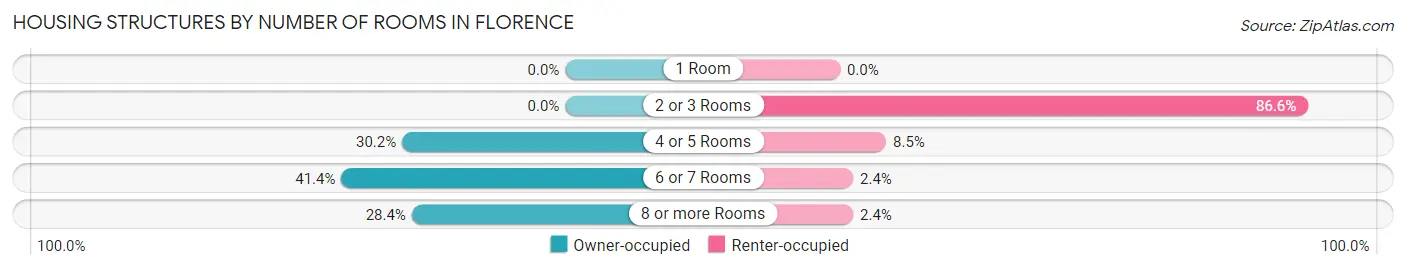
| Number of Rooms | Owner-occupied | Renter-occupied |
| 1 Room | 0 (0.0%) | 0 (0.0%) |
| 2 or 3 Rooms | 0 (0.0%) | 71 (86.6%) |
| 4 or 5 Rooms | 51 (30.2%) | 7 (8.5%) |
| 6 or 7 Rooms | 70 (41.4%) | 2 (2.4%) |
| 8 or more Rooms | 48 (28.4%) | 2 (2.4%) |
| Total | 169 (100.0%) | 82 (100.0%) |
Housing Structure by Heating Type in Florence
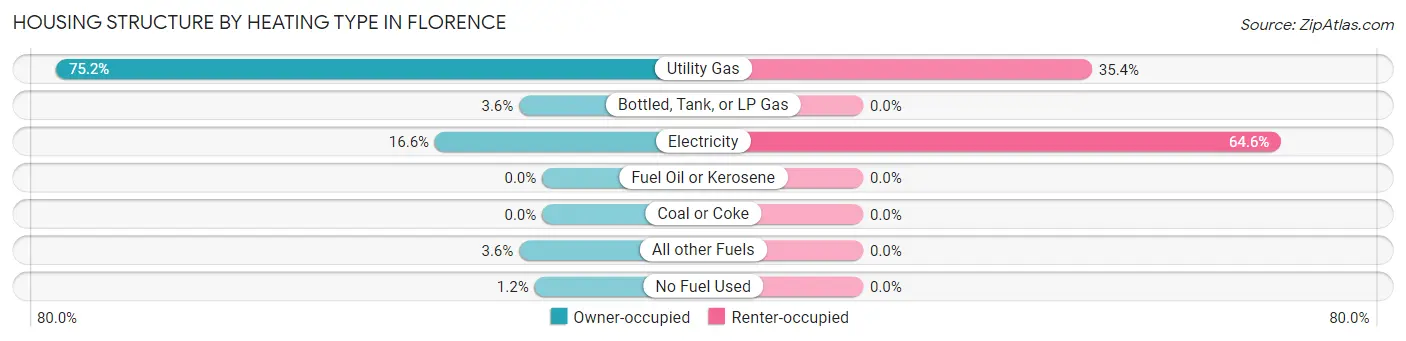
| Heating Type | Owner-occupied | Renter-occupied |
| Utility Gas | 127 (75.1%) | 29 (35.4%) |
| Bottled, Tank, or LP Gas | 6 (3.5%) | 0 (0.0%) |
| Electricity | 28 (16.6%) | 53 (64.6%) |
| Fuel Oil or Kerosene | 0 (0.0%) | 0 (0.0%) |
| Coal or Coke | 0 (0.0%) | 0 (0.0%) |
| All other Fuels | 6 (3.5%) | 0 (0.0%) |
| No Fuel Used | 2 (1.2%) | 0 (0.0%) |
| Total | 169 (100.0%) | 82 (100.0%) |
Household Vehicle Usage in Florence
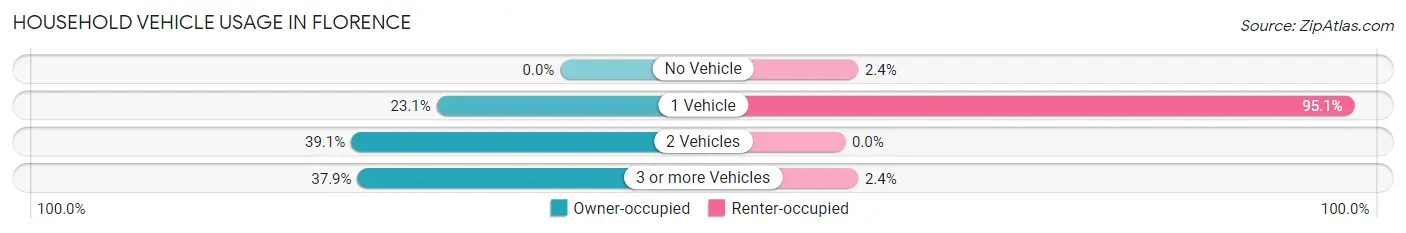
| Vehicles per Household | Owner-occupied | Renter-occupied |
| No Vehicle | 0 (0.0%) | 2 (2.4%) |
| 1 Vehicle | 39 (23.1%) | 78 (95.1%) |
| 2 Vehicles | 66 (39.1%) | 0 (0.0%) |
| 3 or more Vehicles | 64 (37.9%) | 2 (2.4%) |
| Total | 169 (100.0%) | 82 (100.0%) |
Real Estate & Mortgages in Florence
Real Estate and Mortgage Overview in Florence
| Characteristic | Without Mortgage | With Mortgage |
| Housing Units | 133 | 36 |
| Median Property Value | $30,700 | $51,000 |
| Median Household Income | $56,563 | $0 |
| Monthly Housing Costs | $396 | $0 |
| Real Estate Taxes | $835 | $3 |
Property Value by Mortgage Status in Florence
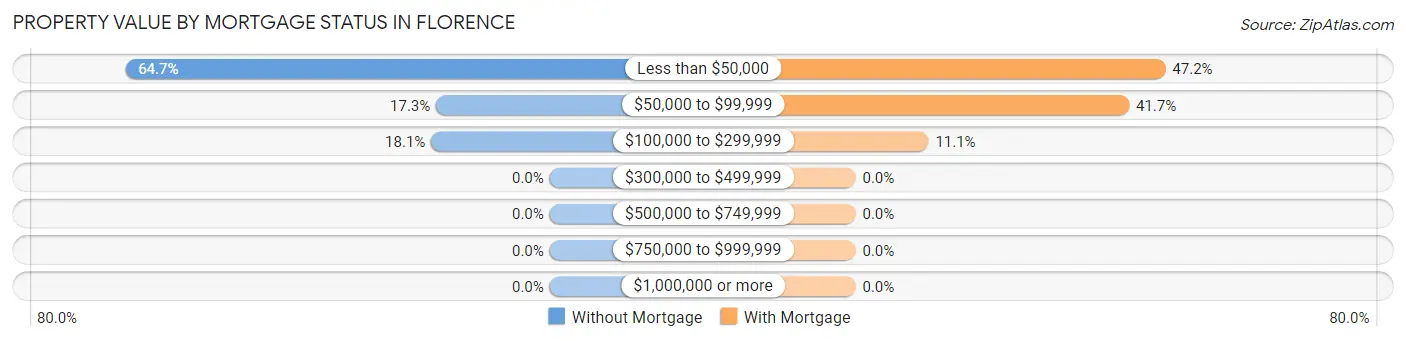
| Property Value | Without Mortgage | With Mortgage |
| Less than $50,000 | 86 (64.7%) | 17 (47.2%) |
| $50,000 to $99,999 | 23 (17.3%) | 15 (41.7%) |
| $100,000 to $299,999 | 24 (18.0%) | 4 (11.1%) |
| $300,000 to $499,999 | 0 (0.0%) | 0 (0.0%) |
| $500,000 to $749,999 | 0 (0.0%) | 0 (0.0%) |
| $750,000 to $999,999 | 0 (0.0%) | 0 (0.0%) |
| $1,000,000 or more | 0 (0.0%) | 0 (0.0%) |
| Total | 133 (100.0%) | 36 (100.0%) |
Household Income by Mortgage Status in Florence
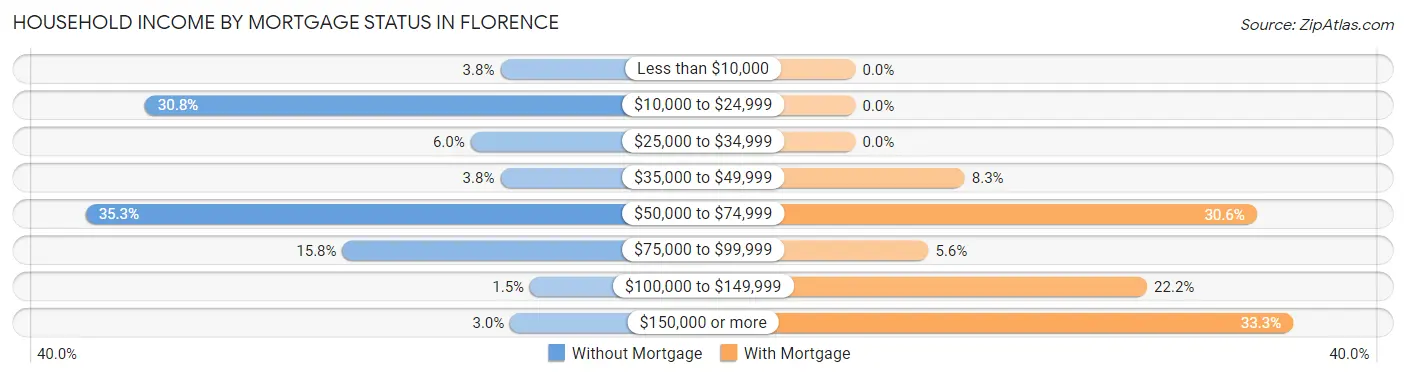
| Household Income | Without Mortgage | With Mortgage |
| Less than $10,000 | 5 (3.8%) | 0 (0.0%) |
| $10,000 to $24,999 | 41 (30.8%) | 0 (0.0%) |
| $25,000 to $34,999 | 8 (6.0%) | 0 (0.0%) |
| $35,000 to $49,999 | 5 (3.8%) | 3 (8.3%) |
| $50,000 to $74,999 | 47 (35.3%) | 11 (30.6%) |
| $75,000 to $99,999 | 21 (15.8%) | 2 (5.6%) |
| $100,000 to $149,999 | 2 (1.5%) | 8 (22.2%) |
| $150,000 or more | 4 (3.0%) | 12 (33.3%) |
| Total | 133 (100.0%) | 36 (100.0%) |
Property Value to Household Income Ratio in Florence
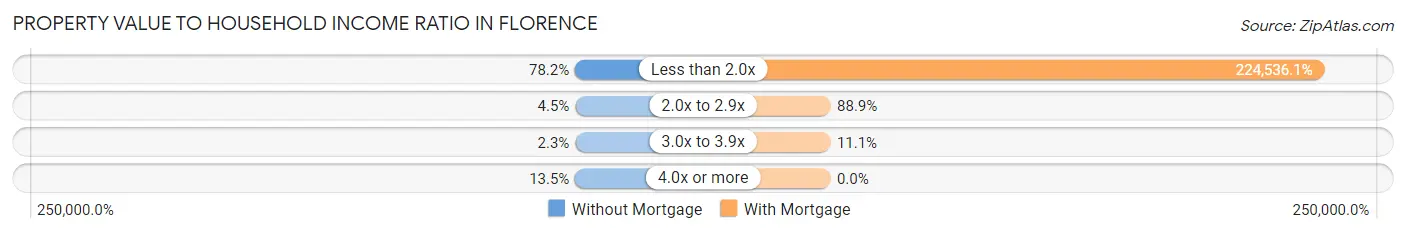
| Value-to-Income Ratio | Without Mortgage | With Mortgage |
| Less than 2.0x | 104 (78.2%) | 80,833 (224,536.1%) |
| 2.0x to 2.9x | 6 (4.5%) | 32 (88.9%) |
| 3.0x to 3.9x | 3 (2.3%) | 4 (11.1%) |
| 4.0x or more | 18 (13.5%) | 0 (0.0%) |
| Total | 133 (100.0%) | 36 (100.0%) |
Real Estate Taxes by Mortgage Status in Florence
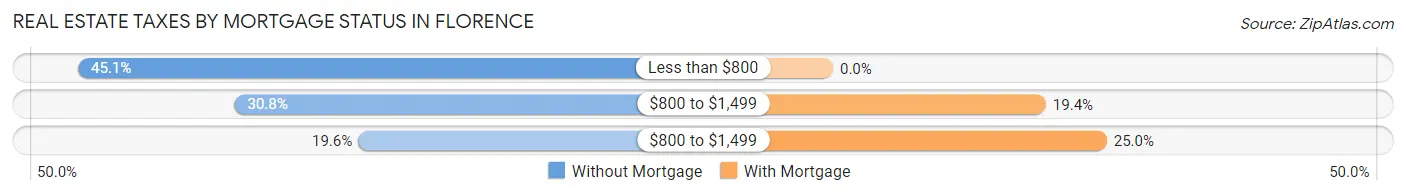
| Property Taxes | Without Mortgage | With Mortgage |
| Less than $800 | 60 (45.1%) | 0 (0.0%) |
| $800 to $1,499 | 41 (30.8%) | 7 (19.4%) |
| $800 to $1,499 | 26 (19.6%) | 9 (25.0%) |
| Total | 133 (100.0%) | 36 (100.0%) |
Health & Disability in Florence
Health Insurance Coverage by Age in Florence
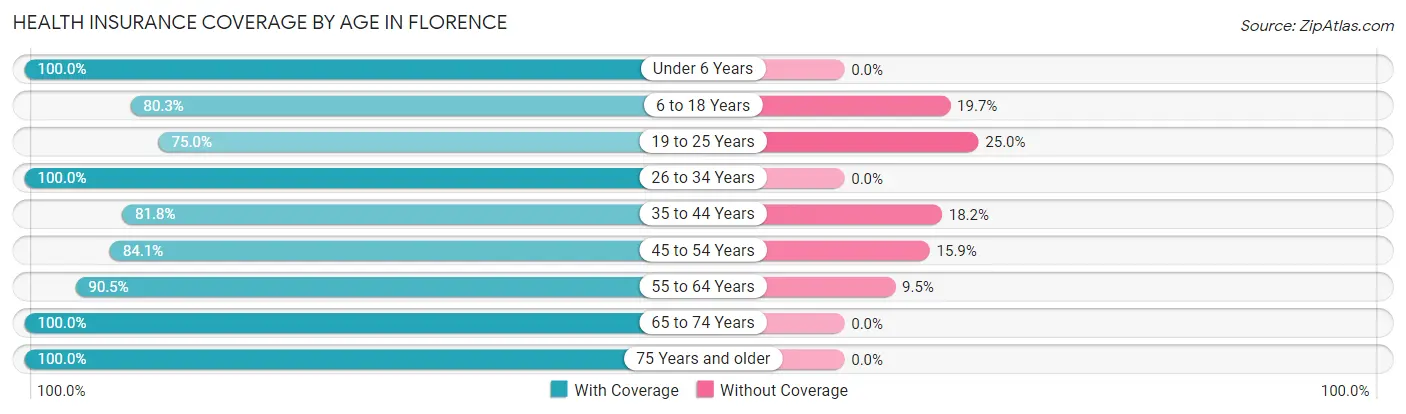
| Age Bracket | With Coverage | Without Coverage |
| Under 6 Years | 29 (100.0%) | 0 (0.0%) |
| 6 to 18 Years | 61 (80.3%) | 15 (19.7%) |
| 19 to 25 Years | 9 (75.0%) | 3 (25.0%) |
| 26 to 34 Years | 19 (100.0%) | 0 (0.0%) |
| 35 to 44 Years | 45 (81.8%) | 10 (18.2%) |
| 45 to 54 Years | 37 (84.1%) | 7 (15.9%) |
| 55 to 64 Years | 86 (90.5%) | 9 (9.5%) |
| 65 to 74 Years | 118 (100.0%) | 0 (0.0%) |
| 75 Years and older | 61 (100.0%) | 0 (0.0%) |
| Total | 465 (91.4%) | 44 (8.6%) |
Health Insurance Coverage by Citizenship Status in Florence
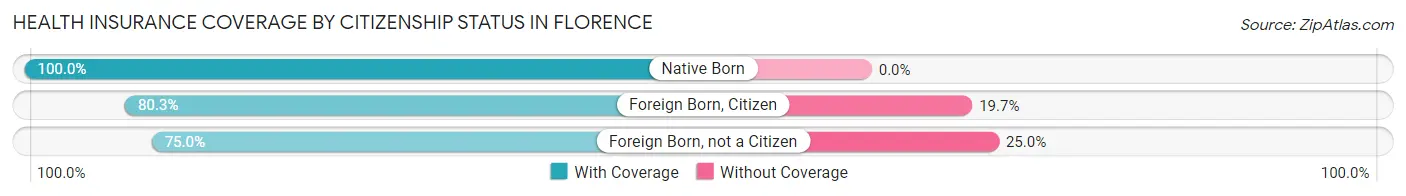
| Citizenship Status | With Coverage | Without Coverage |
| Native Born | 29 (100.0%) | 0 (0.0%) |
| Foreign Born, Citizen | 61 (80.3%) | 15 (19.7%) |
| Foreign Born, not a Citizen | 9 (75.0%) | 3 (25.0%) |
Health Insurance Coverage by Household Income in Florence
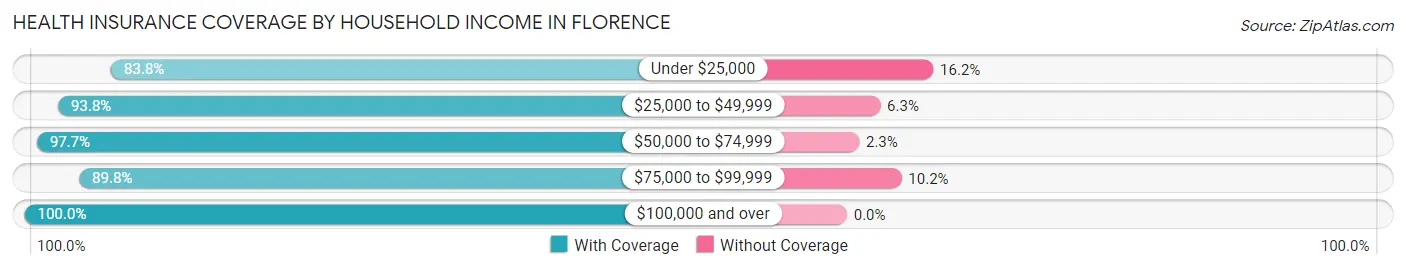
| Household Income | With Coverage | Without Coverage |
| Under $25,000 | 145 (83.8%) | 28 (16.2%) |
| $25,000 to $49,999 | 60 (93.8%) | 4 (6.2%) |
| $50,000 to $74,999 | 128 (97.7%) | 3 (2.3%) |
| $75,000 to $99,999 | 79 (89.8%) | 9 (10.2%) |
| $100,000 and over | 53 (100.0%) | 0 (0.0%) |
Public vs Private Health Insurance Coverage by Age in Florence
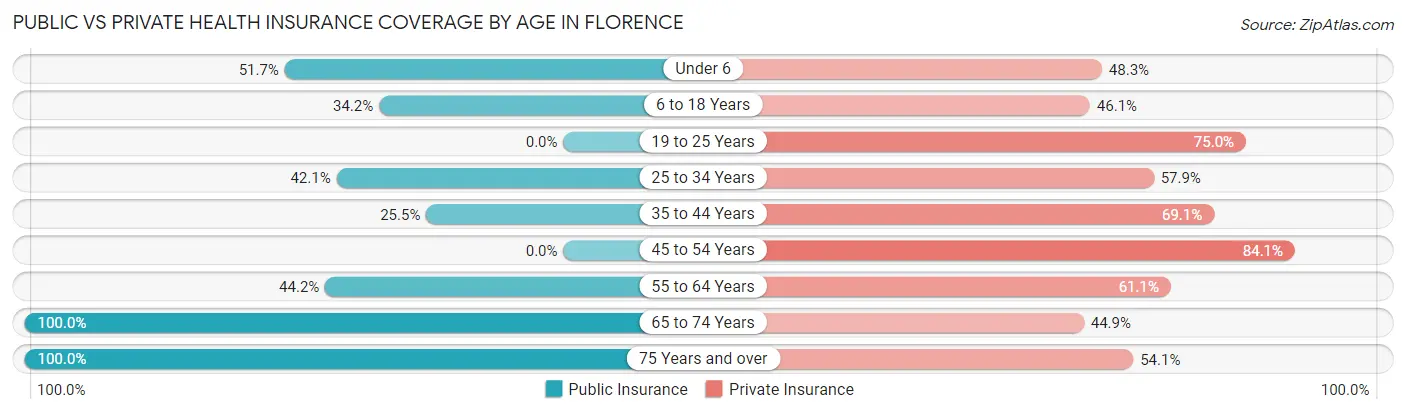
| Age Bracket | Public Insurance | Private Insurance |
| Under 6 | 15 (51.7%) | 14 (48.3%) |
| 6 to 18 Years | 26 (34.2%) | 35 (46.1%) |
| 19 to 25 Years | 0 (0.0%) | 9 (75.0%) |
| 25 to 34 Years | 8 (42.1%) | 11 (57.9%) |
| 35 to 44 Years | 14 (25.5%) | 38 (69.1%) |
| 45 to 54 Years | 0 (0.0%) | 37 (84.1%) |
| 55 to 64 Years | 42 (44.2%) | 58 (61.1%) |
| 65 to 74 Years | 118 (100.0%) | 53 (44.9%) |
| 75 Years and over | 61 (100.0%) | 33 (54.1%) |
| Total | 284 (55.8%) | 288 (56.6%) |
Disability Status by Sex by Age in Florence
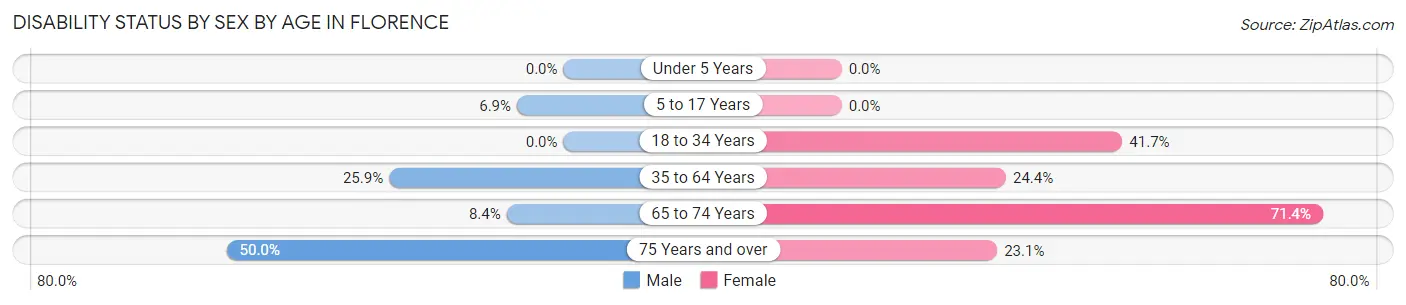
| Age Bracket | Male | Female |
| Under 5 Years | 0 (0.0%) | 0 (0.0%) |
| 5 to 17 Years | 2 (6.9%) | 0 (0.0%) |
| 18 to 34 Years | 0 (0.0%) | 10 (41.7%) |
| 35 to 64 Years | 29 (25.9%) | 20 (24.4%) |
| 65 to 74 Years | 7 (8.4%) | 25 (71.4%) |
| 75 Years and over | 24 (50.0%) | 3 (23.1%) |
Disability Class by Sex by Age in Florence
Disability Class: Hearing Difficulty
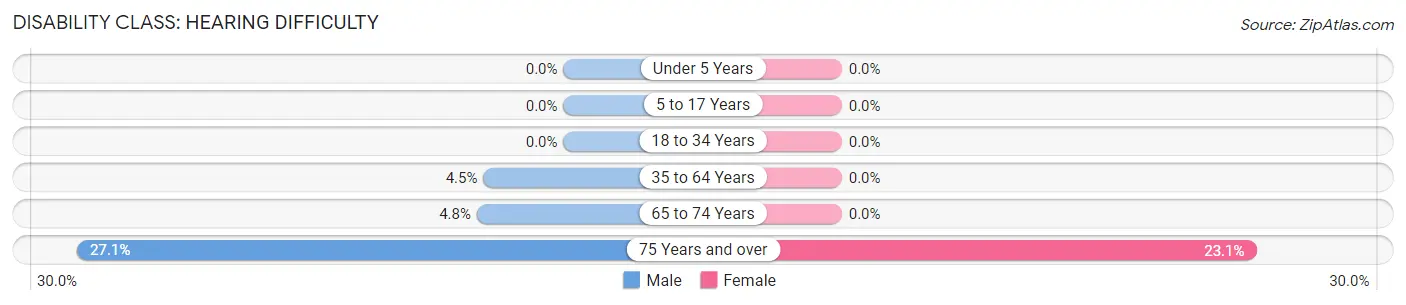
| Age Bracket | Male | Female |
| Under 5 Years | 0 (0.0%) | 0 (0.0%) |
| 5 to 17 Years | 0 (0.0%) | 0 (0.0%) |
| 18 to 34 Years | 0 (0.0%) | 0 (0.0%) |
| 35 to 64 Years | 5 (4.5%) | 0 (0.0%) |
| 65 to 74 Years | 4 (4.8%) | 0 (0.0%) |
| 75 Years and over | 13 (27.1%) | 3 (23.1%) |
Disability Class: Vision Difficulty
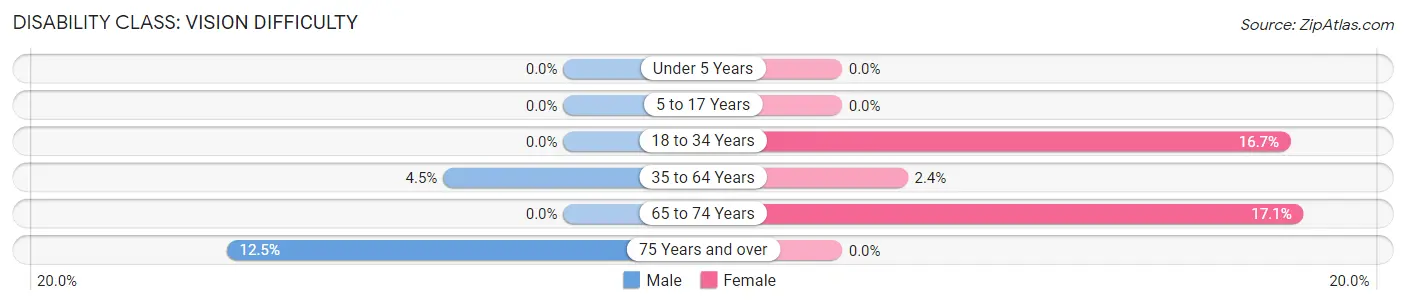
| Age Bracket | Male | Female |
| Under 5 Years | 0 (0.0%) | 0 (0.0%) |
| 5 to 17 Years | 0 (0.0%) | 0 (0.0%) |
| 18 to 34 Years | 0 (0.0%) | 4 (16.7%) |
| 35 to 64 Years | 5 (4.5%) | 2 (2.4%) |
| 65 to 74 Years | 0 (0.0%) | 6 (17.1%) |
| 75 Years and over | 6 (12.5%) | 0 (0.0%) |
Disability Class: Cognitive Difficulty
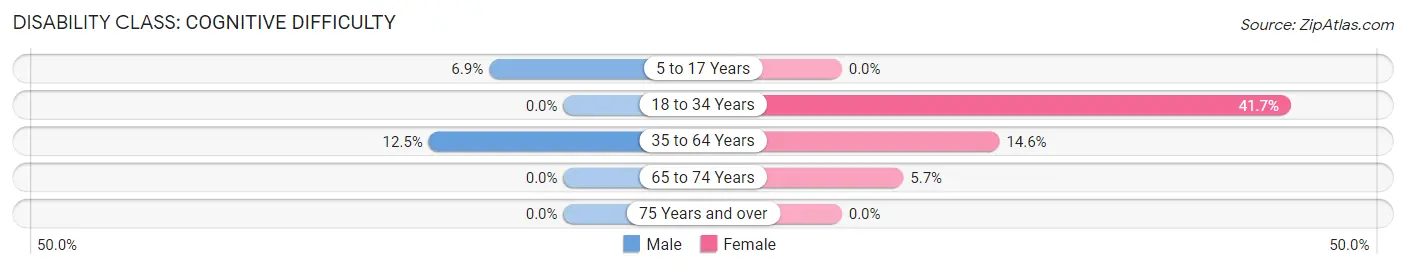
| Age Bracket | Male | Female |
| 5 to 17 Years | 2 (6.9%) | 0 (0.0%) |
| 18 to 34 Years | 0 (0.0%) | 10 (41.7%) |
| 35 to 64 Years | 14 (12.5%) | 12 (14.6%) |
| 65 to 74 Years | 0 (0.0%) | 2 (5.7%) |
| 75 Years and over | 0 (0.0%) | 0 (0.0%) |
Disability Class: Ambulatory Difficulty
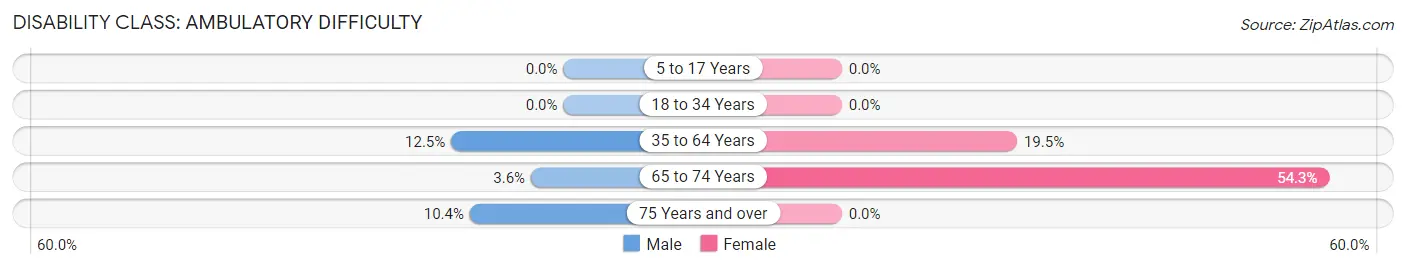
| Age Bracket | Male | Female |
| 5 to 17 Years | 0 (0.0%) | 0 (0.0%) |
| 18 to 34 Years | 0 (0.0%) | 0 (0.0%) |
| 35 to 64 Years | 14 (12.5%) | 16 (19.5%) |
| 65 to 74 Years | 3 (3.6%) | 19 (54.3%) |
| 75 Years and over | 5 (10.4%) | 0 (0.0%) |
Disability Class: Self-Care Difficulty
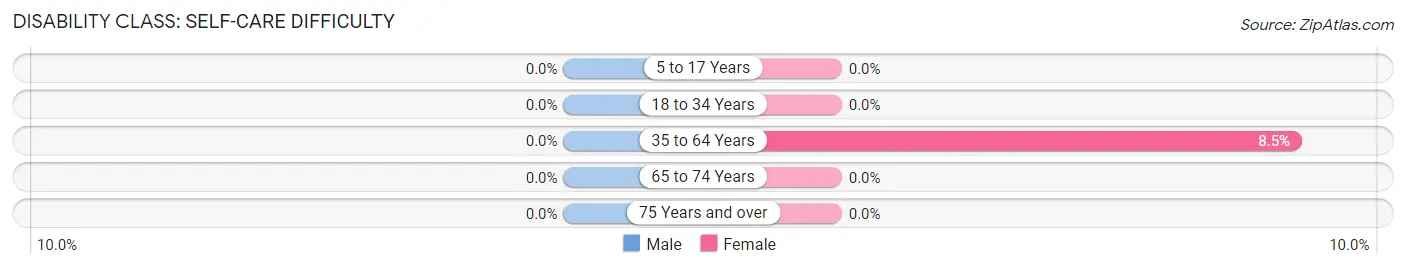
| Age Bracket | Male | Female |
| 5 to 17 Years | 0 (0.0%) | 0 (0.0%) |
| 18 to 34 Years | 0 (0.0%) | 0 (0.0%) |
| 35 to 64 Years | 0 (0.0%) | 7 (8.5%) |
| 65 to 74 Years | 0 (0.0%) | 0 (0.0%) |
| 75 Years and over | 0 (0.0%) | 0 (0.0%) |
Technology Access in Florence
Computing Device Access in Florence
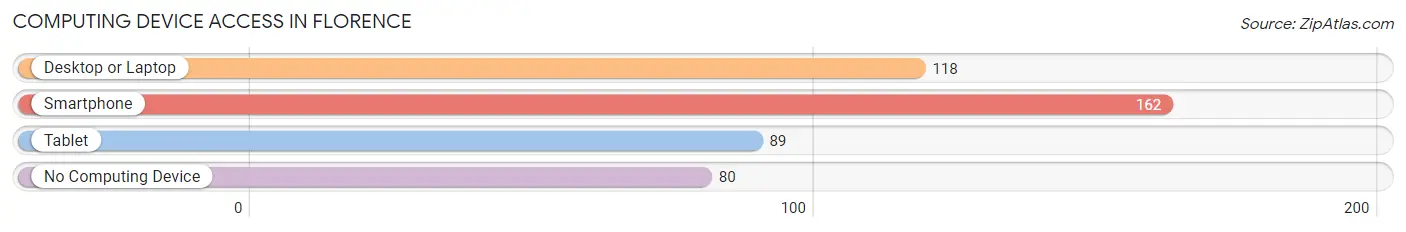
| Device Type | # Households | % Households |
| Desktop or Laptop | 118 | 47.0% |
| Smartphone | 162 | 64.5% |
| Tablet | 89 | 35.5% |
| No Computing Device | 80 | 31.9% |
| Total | 251 | 100.0% |
Internet Access in Florence
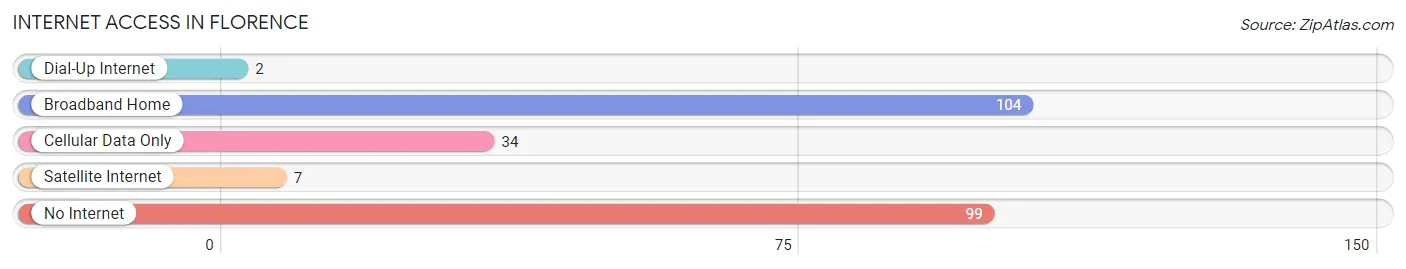
| Internet Type | # Households | % Households |
| Dial-Up Internet | 2 | 0.8% |
| Broadband Home | 104 | 41.4% |
| Cellular Data Only | 34 | 13.6% |
| Satellite Internet | 7 | 2.8% |
| No Internet | 99 | 39.4% |
| Total | 251 | 100.0% |
Florence Summary
Florence, Kansas is a small city located in Marion County, Kansas. It is situated in the Flint Hills region of the state, and is part of the Emporia Micropolitan Statistical Area. The city has a population of 1,717 people, according to the 2010 census.
History
Florence was founded in 1857 by a group of settlers from Ohio. The city was named after Florence, Ohio, the hometown of one of the settlers. The city was incorporated in 1872.
In the late 19th century, Florence was a major stop on the Santa Fe Trail, and the city was home to several stagecoach stops. The city was also home to a number of businesses, including a flour mill, a sawmill, a blacksmith shop, and a hotel.
Geography
Florence is located in Marion County, Kansas, in the Flint Hills region of the state. The city is situated at an elevation of 1,072 feet (326 m). The city is located at the intersection of U.S. Route 50 and Kansas Highway 99.
The city has a total area of 1.2 square miles (3.2 km2), all of which is land. The city is located in the Central Standard Time Zone.
Economy
Florence is a small city with a limited economy. The city is home to a number of small businesses, including a grocery store, a hardware store, a restaurant, and a bank. The city is also home to a number of manufacturing companies, including a plastics manufacturer and a metal fabrication company.
The city is also home to a number of agricultural businesses, including a dairy farm, a feed mill, and a grain elevator.
Demographics
According to the 2010 census, Florence has a population of 1,717 people. The city has a median household income of $37,917, and a median family income of $45,917. The city has a poverty rate of 16.3%.
The city is predominantly white, with 91.2% of the population identifying as white. The city also has a small Hispanic population, with 4.2% of the population identifying as Hispanic or Latino.
The city has a high school graduation rate of 87.3%, and a college graduation rate of 28.3%. The city has a median age of 38.7 years.
Common Questions
What is Per Capita Income in Florence?
Per Capita income in Florence is $24,454.
What is the Median Family Income in Florence?
Median Family Income in Florence is $69,643.
What is the Median Household income in Florence?
Median Household Income in Florence is $30,208.
What is Income or Wage Gap in Florence?
Income or Wage Gap in Florence is 2.0%.
Women in Florence earn 98.0 cents for every dollar earned by a man.
What is Inequality or Gini Index in Florence?
Inequality or Gini Index in Florence is 0.38.
What is the Total Population of Florence?
Total Population of Florence is 509.
What is the Total Male Population of Florence?
Total Male Population of Florence is 296.
What is the Total Female Population of Florence?
Total Female Population of Florence is 213.
What is the Ratio of Males per 100 Females in Florence?
There are 138.97 Males per 100 Females in Florence.
What is the Ratio of Females per 100 Males in Florence?
There are 71.96 Females per 100 Males in Florence.
What is the Median Population Age in Florence?
Median Population Age in Florence is 56.5 Years.
What is the Average Family Size in Florence
Average Family Size in Florence is 3.0 People.
What is the Average Household Size in Florence
Average Household Size in Florence is 2.0 People.
How Large is the Labor Force in Florence?
There are 216 People in the Labor Forcein in Florence.
What is the Percentage of People in the Labor Force in Florence?
50.5% of People are in the Labor Force in Florence.
What is the Unemployment Rate in Florence?
Unemployment Rate in Florence is 1.9%.