Alsatian vs Immigrants from Zaire Per Capita Income
COMPARE
Alsatian
Immigrants from Zaire
Per Capita Income
Per Capita Income Comparison
Alsatians
Immigrants from Zaire
$47,284
PER CAPITA INCOME
98.3/ 100
METRIC RATING
96th/ 347
METRIC RANK
$38,848
PER CAPITA INCOME
0.4/ 100
METRIC RATING
267th/ 347
METRIC RANK
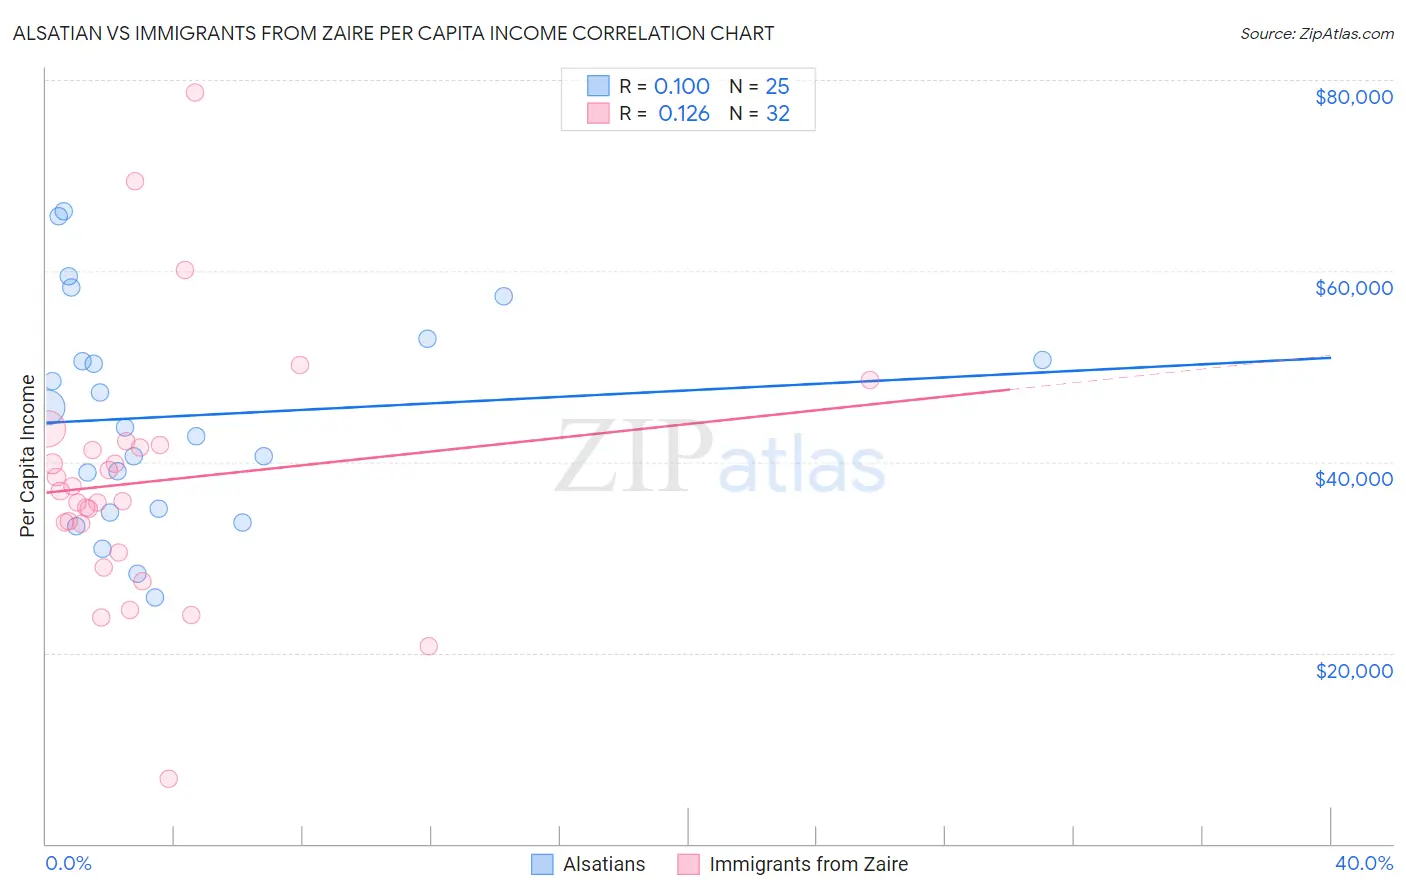
Alsatian vs Immigrants from Zaire Per Capita Income Correlation Chart
The statistical analysis conducted on geographies consisting of 82,682,365 people shows a slight positive correlation between the proportion of Alsatians and per capita income in the United States with a correlation coefficient (R) of 0.100 and weighted average of $47,284. Similarly, the statistical analysis conducted on geographies consisting of 107,255,805 people shows a poor positive correlation between the proportion of Immigrants from Zaire and per capita income in the United States with a correlation coefficient (R) of 0.126 and weighted average of $38,848, a difference of 21.7%.
Per Capita Income Correlation Summary
| Measurement | Alsatian | Immigrants from Zaire |
| Minimum | $25,853 | $6,803 |
| Maximum | $66,221 | $78,629 |
| Range | $40,368 | $71,826 |
| Mean | $44,810 | $37,941 |
| Median | $43,610 | $36,388 |
| Interquartile 25% (IQ1) | $34,894 | $32,029 |
| Interquartile 75% (IQ3) | $51,799 | $41,659 |
| Interquartile Range (IQR) | $16,905 | $9,630 |
| Standard Deviation (Sample) | $11,224 | $13,517 |
| Standard Deviation (Population) | $10,998 | $13,304 |
Similar Demographics by Per Capita Income
Demographics Similar to Alsatians by Per Capita Income
In terms of per capita income, the demographic groups most similar to Alsatians are Carpatho Rusyn ($47,248, a difference of 0.080%), Immigrants from Egypt ($47,361, a difference of 0.16%), Albanian ($47,379, a difference of 0.20%), Immigrants from Zimbabwe ($47,394, a difference of 0.23%), and Immigrants from Moldova ($47,489, a difference of 0.43%).
| Demographics | Rating | Rank | Per Capita Income |
| Northern Europeans | 98.9 /100 | #89 | Exceptional $47,698 |
| Italians | 98.8 /100 | #90 | Exceptional $47,574 |
| Macedonians | 98.8 /100 | #91 | Exceptional $47,573 |
| Immigrants | Moldova | 98.7 /100 | #92 | Exceptional $47,489 |
| Immigrants | Zimbabwe | 98.5 /100 | #93 | Exceptional $47,394 |
| Albanians | 98.5 /100 | #94 | Exceptional $47,379 |
| Immigrants | Egypt | 98.5 /100 | #95 | Exceptional $47,361 |
| Alsatians | 98.3 /100 | #96 | Exceptional $47,284 |
| Carpatho Rusyns | 98.2 /100 | #97 | Exceptional $47,248 |
| Immigrants | Pakistan | 97.9 /100 | #98 | Exceptional $47,084 |
| Laotians | 97.8 /100 | #99 | Exceptional $47,041 |
| Immigrants | Lebanon | 97.5 /100 | #100 | Exceptional $46,938 |
| Immigrants | Uzbekistan | 97.5 /100 | #101 | Exceptional $46,929 |
| Immigrants | Western Asia | 97.4 /100 | #102 | Exceptional $46,876 |
| Syrians | 97.2 /100 | #103 | Exceptional $46,837 |
Demographics Similar to Immigrants from Zaire by Per Capita Income
In terms of per capita income, the demographic groups most similar to Immigrants from Zaire are Salvadoran ($38,858, a difference of 0.030%), Liberian ($38,780, a difference of 0.17%), Immigrants from Jamaica ($38,766, a difference of 0.21%), Spanish American ($39,012, a difference of 0.42%), and American ($39,039, a difference of 0.49%).
| Demographics | Rating | Rank | Per Capita Income |
| Alaskan Athabascans | 0.6 /100 | #260 | Tragic $39,163 |
| Marshallese | 0.6 /100 | #261 | Tragic $39,108 |
| Iroquois | 0.6 /100 | #262 | Tragic $39,104 |
| Belizeans | 0.6 /100 | #263 | Tragic $39,097 |
| Americans | 0.6 /100 | #264 | Tragic $39,039 |
| Spanish Americans | 0.5 /100 | #265 | Tragic $39,012 |
| Salvadorans | 0.5 /100 | #266 | Tragic $38,858 |
| Immigrants | Zaire | 0.4 /100 | #267 | Tragic $38,848 |
| Liberians | 0.4 /100 | #268 | Tragic $38,780 |
| Immigrants | Jamaica | 0.4 /100 | #269 | Tragic $38,766 |
| Immigrants | Belize | 0.3 /100 | #270 | Tragic $38,614 |
| Central Americans | 0.3 /100 | #271 | Tragic $38,560 |
| Immigrants | Cabo Verde | 0.3 /100 | #272 | Tragic $38,540 |
| Nepalese | 0.3 /100 | #273 | Tragic $38,442 |
| Immigrants | El Salvador | 0.3 /100 | #274 | Tragic $38,394 |