Alsatian vs Korean Per Capita Income
COMPARE
Alsatian
Korean
Per Capita Income
Per Capita Income Comparison
Alsatians
Koreans
$47,284
PER CAPITA INCOME
98.3/ 100
METRIC RATING
96th/ 347
METRIC RANK
$44,522
PER CAPITA INCOME
72.5/ 100
METRIC RATING
149th/ 347
METRIC RANK
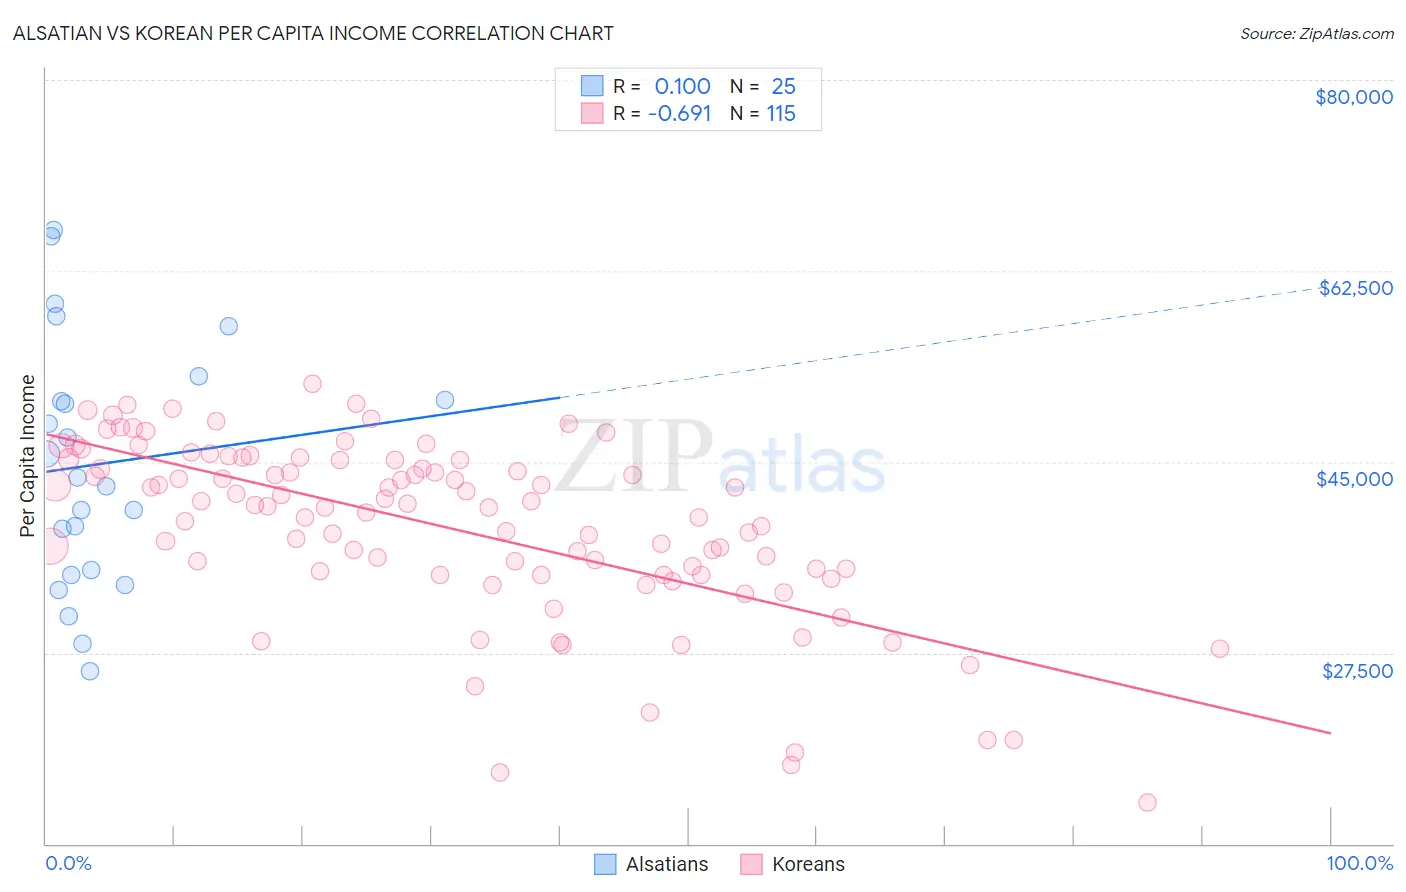
Alsatian vs Korean Per Capita Income Correlation Chart
The statistical analysis conducted on geographies consisting of 82,682,365 people shows a slight positive correlation between the proportion of Alsatians and per capita income in the United States with a correlation coefficient (R) of 0.100 and weighted average of $47,284. Similarly, the statistical analysis conducted on geographies consisting of 510,996,517 people shows a significant negative correlation between the proportion of Koreans and per capita income in the United States with a correlation coefficient (R) of -0.691 and weighted average of $44,522, a difference of 6.2%.
Per Capita Income Correlation Summary
| Measurement | Alsatian | Korean |
| Minimum | $25,853 | $13,802 |
| Maximum | $66,221 | $52,147 |
| Range | $40,368 | $38,345 |
| Mean | $44,810 | $38,981 |
| Median | $43,610 | $40,908 |
| Interquartile 25% (IQ1) | $34,894 | $34,687 |
| Interquartile 75% (IQ3) | $51,799 | $45,181 |
| Interquartile Range (IQR) | $16,905 | $10,494 |
| Standard Deviation (Sample) | $11,224 | $8,123 |
| Standard Deviation (Population) | $10,998 | $8,088 |
Similar Demographics by Per Capita Income
Demographics Similar to Alsatians by Per Capita Income
In terms of per capita income, the demographic groups most similar to Alsatians are Carpatho Rusyn ($47,248, a difference of 0.080%), Immigrants from Egypt ($47,361, a difference of 0.16%), Albanian ($47,379, a difference of 0.20%), Immigrants from Zimbabwe ($47,394, a difference of 0.23%), and Immigrants from Moldova ($47,489, a difference of 0.43%).
| Demographics | Rating | Rank | Per Capita Income |
| Northern Europeans | 98.9 /100 | #89 | Exceptional $47,698 |
| Italians | 98.8 /100 | #90 | Exceptional $47,574 |
| Macedonians | 98.8 /100 | #91 | Exceptional $47,573 |
| Immigrants | Moldova | 98.7 /100 | #92 | Exceptional $47,489 |
| Immigrants | Zimbabwe | 98.5 /100 | #93 | Exceptional $47,394 |
| Albanians | 98.5 /100 | #94 | Exceptional $47,379 |
| Immigrants | Egypt | 98.5 /100 | #95 | Exceptional $47,361 |
| Alsatians | 98.3 /100 | #96 | Exceptional $47,284 |
| Carpatho Rusyns | 98.2 /100 | #97 | Exceptional $47,248 |
| Immigrants | Pakistan | 97.9 /100 | #98 | Exceptional $47,084 |
| Laotians | 97.8 /100 | #99 | Exceptional $47,041 |
| Immigrants | Lebanon | 97.5 /100 | #100 | Exceptional $46,938 |
| Immigrants | Uzbekistan | 97.5 /100 | #101 | Exceptional $46,929 |
| Immigrants | Western Asia | 97.4 /100 | #102 | Exceptional $46,876 |
| Syrians | 97.2 /100 | #103 | Exceptional $46,837 |
Demographics Similar to Koreans by Per Capita Income
In terms of per capita income, the demographic groups most similar to Koreans are Immigrants from Eritrea ($44,509, a difference of 0.030%), Immigrants from Armenia ($44,552, a difference of 0.070%), Norwegian ($44,480, a difference of 0.10%), Peruvian ($44,479, a difference of 0.10%), and Czech ($44,595, a difference of 0.16%).
| Demographics | Rating | Rank | Per Capita Income |
| Ugandans | 82.6 /100 | #142 | Excellent $45,047 |
| Immigrants | Uganda | 82.5 /100 | #143 | Excellent $45,043 |
| Icelanders | 81.6 /100 | #144 | Excellent $44,987 |
| Immigrants | Afghanistan | 78.0 /100 | #145 | Good $44,790 |
| Irish | 75.8 /100 | #146 | Good $44,679 |
| Czechs | 74.1 /100 | #147 | Good $44,595 |
| Immigrants | Armenia | 73.1 /100 | #148 | Good $44,552 |
| Koreans | 72.5 /100 | #149 | Good $44,522 |
| Immigrants | Eritrea | 72.1 /100 | #150 | Good $44,509 |
| Norwegians | 71.5 /100 | #151 | Good $44,480 |
| Peruvians | 71.5 /100 | #152 | Good $44,479 |
| Scottish | 70.6 /100 | #153 | Good $44,440 |
| Portuguese | 68.7 /100 | #154 | Good $44,362 |
| Uruguayans | 67.6 /100 | #155 | Good $44,318 |
| Slovaks | 65.4 /100 | #156 | Good $44,229 |