Haitian vs Immigrants from Zaire Per Capita Income
COMPARE
Haitian
Immigrants from Zaire
Per Capita Income
Per Capita Income Comparison
Haitians
Immigrants from Zaire
$37,289
PER CAPITA INCOME
0.1/ 100
METRIC RATING
297th/ 347
METRIC RANK
$38,848
PER CAPITA INCOME
0.4/ 100
METRIC RATING
267th/ 347
METRIC RANK
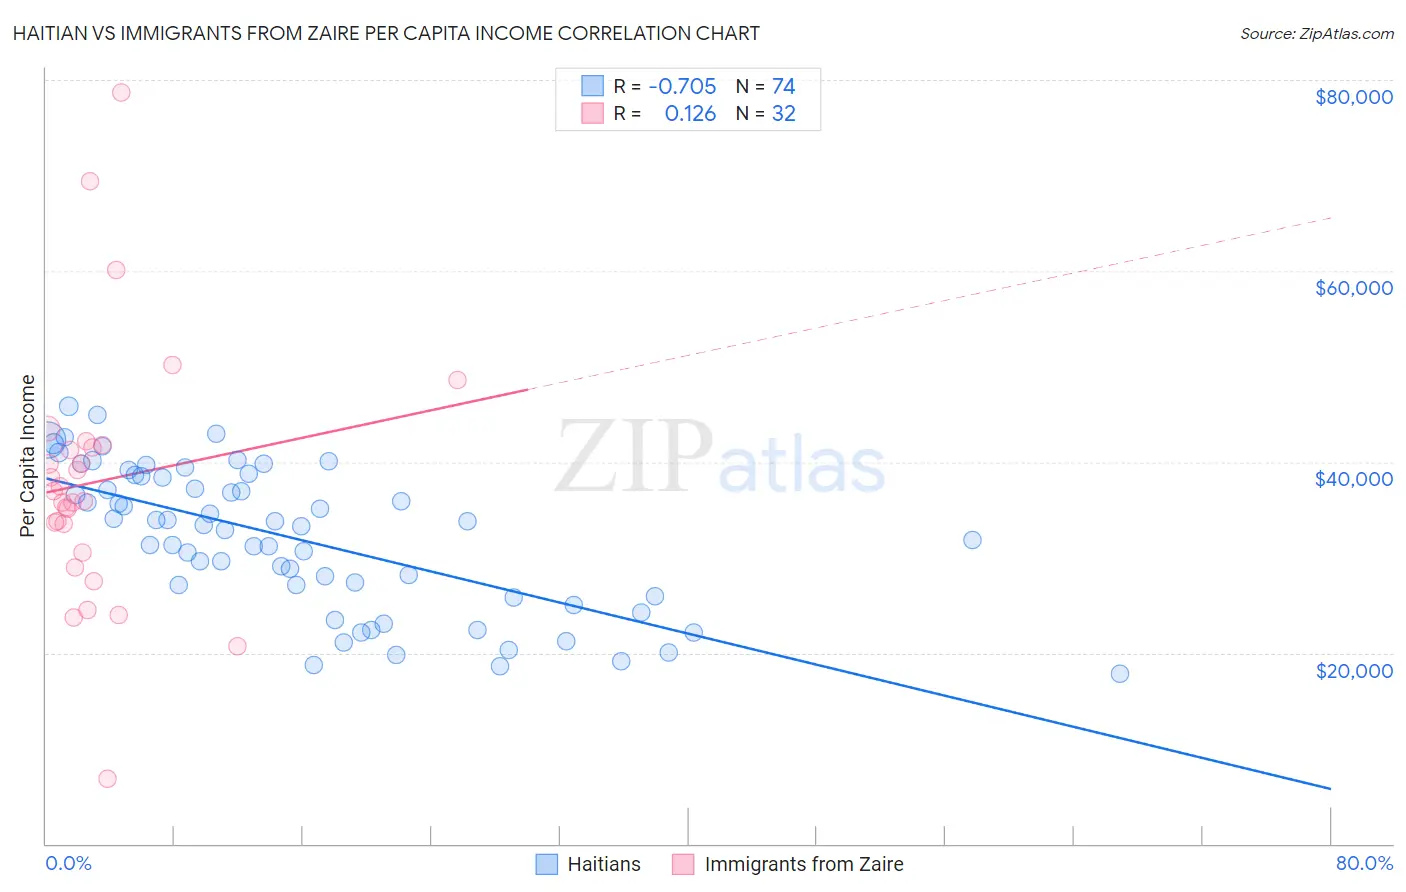
Haitian vs Immigrants from Zaire Per Capita Income Correlation Chart
The statistical analysis conducted on geographies consisting of 288,031,086 people shows a strong negative correlation between the proportion of Haitians and per capita income in the United States with a correlation coefficient (R) of -0.705 and weighted average of $37,289. Similarly, the statistical analysis conducted on geographies consisting of 107,255,805 people shows a poor positive correlation between the proportion of Immigrants from Zaire and per capita income in the United States with a correlation coefficient (R) of 0.126 and weighted average of $38,848, a difference of 4.2%.
Per Capita Income Correlation Summary
| Measurement | Haitian | Immigrants from Zaire |
| Minimum | $17,858 | $6,803 |
| Maximum | $45,871 | $78,629 |
| Range | $28,013 | $71,826 |
| Mean | $31,987 | $37,941 |
| Median | $33,320 | $36,388 |
| Interquartile 25% (IQ1) | $25,885 | $32,029 |
| Interquartile 75% (IQ3) | $38,541 | $41,659 |
| Interquartile Range (IQR) | $12,656 | $9,630 |
| Standard Deviation (Sample) | $7,480 | $13,517 |
| Standard Deviation (Population) | $7,429 | $13,304 |
Similar Demographics by Per Capita Income
Demographics Similar to Haitians by Per Capita Income
In terms of per capita income, the demographic groups most similar to Haitians are Indonesian ($37,300, a difference of 0.030%), Immigrants from Dominican Republic ($37,306, a difference of 0.040%), Immigrants from Caribbean ($37,254, a difference of 0.090%), Cherokee ($37,203, a difference of 0.23%), and Cuban ($37,383, a difference of 0.25%).
| Demographics | Rating | Rank | Per Capita Income |
| Immigrants | Guatemala | 0.1 /100 | #290 | Tragic $37,550 |
| Cajuns | 0.1 /100 | #291 | Tragic $37,527 |
| Immigrants | Micronesia | 0.1 /100 | #292 | Tragic $37,464 |
| Mexican American Indians | 0.1 /100 | #293 | Tragic $37,407 |
| Cubans | 0.1 /100 | #294 | Tragic $37,383 |
| Immigrants | Dominican Republic | 0.1 /100 | #295 | Tragic $37,306 |
| Indonesians | 0.1 /100 | #296 | Tragic $37,300 |
| Haitians | 0.1 /100 | #297 | Tragic $37,289 |
| Immigrants | Caribbean | 0.1 /100 | #298 | Tragic $37,254 |
| Cherokee | 0.1 /100 | #299 | Tragic $37,203 |
| Immigrants | Bahamas | 0.1 /100 | #300 | Tragic $37,193 |
| Ottawa | 0.1 /100 | #301 | Tragic $37,101 |
| Shoshone | 0.1 /100 | #302 | Tragic $37,072 |
| Paiute | 0.1 /100 | #303 | Tragic $37,066 |
| Hondurans | 0.1 /100 | #304 | Tragic $37,031 |
Demographics Similar to Immigrants from Zaire by Per Capita Income
In terms of per capita income, the demographic groups most similar to Immigrants from Zaire are Salvadoran ($38,858, a difference of 0.030%), Liberian ($38,780, a difference of 0.17%), Immigrants from Jamaica ($38,766, a difference of 0.21%), Spanish American ($39,012, a difference of 0.42%), and American ($39,039, a difference of 0.49%).
| Demographics | Rating | Rank | Per Capita Income |
| Alaskan Athabascans | 0.6 /100 | #260 | Tragic $39,163 |
| Marshallese | 0.6 /100 | #261 | Tragic $39,108 |
| Iroquois | 0.6 /100 | #262 | Tragic $39,104 |
| Belizeans | 0.6 /100 | #263 | Tragic $39,097 |
| Americans | 0.6 /100 | #264 | Tragic $39,039 |
| Spanish Americans | 0.5 /100 | #265 | Tragic $39,012 |
| Salvadorans | 0.5 /100 | #266 | Tragic $38,858 |
| Immigrants | Zaire | 0.4 /100 | #267 | Tragic $38,848 |
| Liberians | 0.4 /100 | #268 | Tragic $38,780 |
| Immigrants | Jamaica | 0.4 /100 | #269 | Tragic $38,766 |
| Immigrants | Belize | 0.3 /100 | #270 | Tragic $38,614 |
| Central Americans | 0.3 /100 | #271 | Tragic $38,560 |
| Immigrants | Cabo Verde | 0.3 /100 | #272 | Tragic $38,540 |
| Nepalese | 0.3 /100 | #273 | Tragic $38,442 |
| Immigrants | El Salvador | 0.3 /100 | #274 | Tragic $38,394 |