Alsatian vs Immigrants from Korea Per Capita Income
COMPARE
Alsatian
Immigrants from Korea
Per Capita Income
Per Capita Income Comparison
Alsatians
Immigrants from Korea
$47,284
PER CAPITA INCOME
98.3/ 100
METRIC RATING
96th/ 347
METRIC RANK
$51,671
PER CAPITA INCOME
100.0/ 100
METRIC RATING
40th/ 347
METRIC RANK
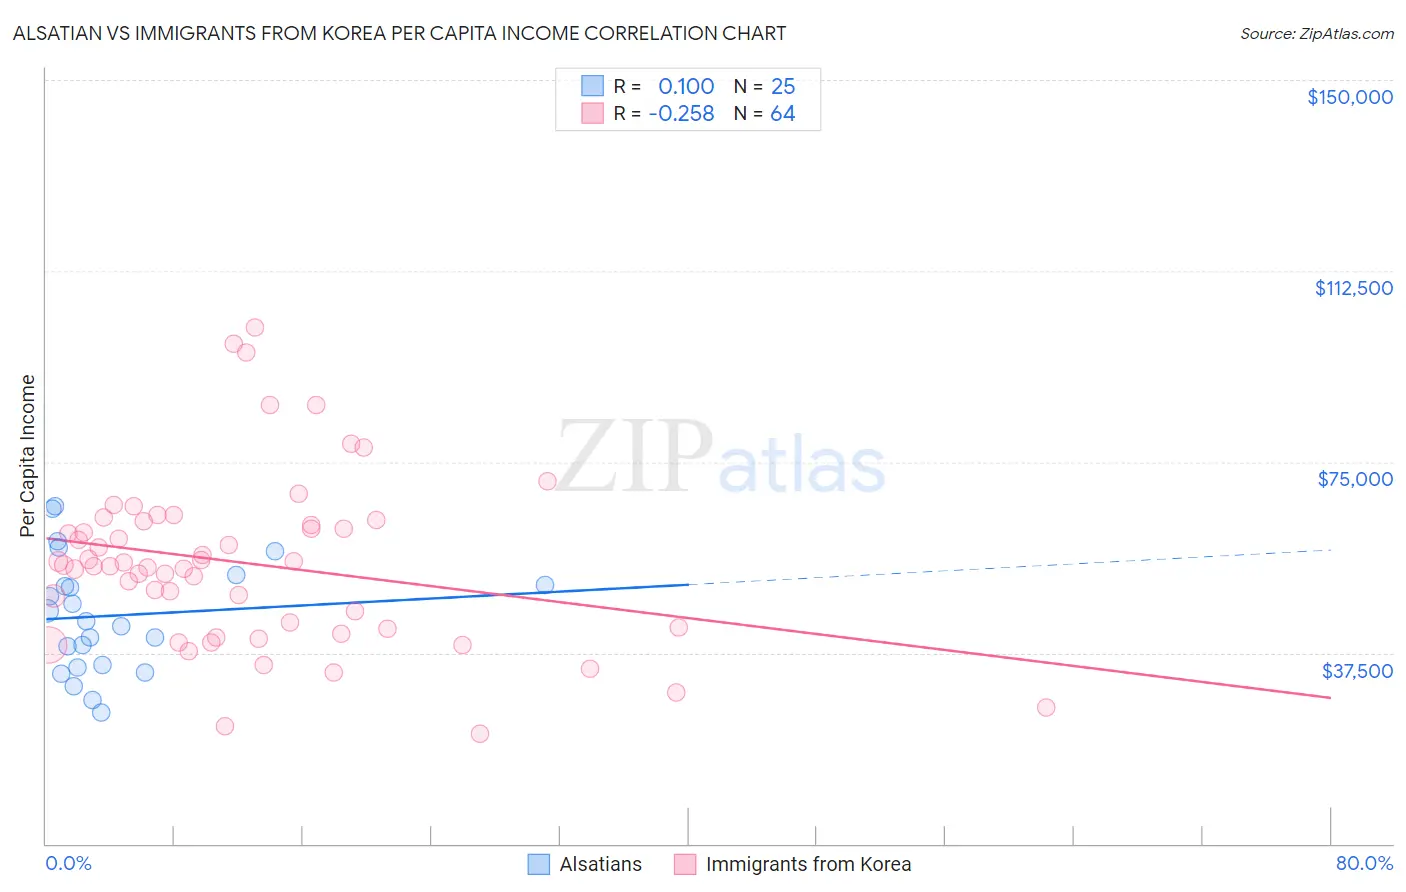
Alsatian vs Immigrants from Korea Per Capita Income Correlation Chart
The statistical analysis conducted on geographies consisting of 82,682,365 people shows a slight positive correlation between the proportion of Alsatians and per capita income in the United States with a correlation coefficient (R) of 0.100 and weighted average of $47,284. Similarly, the statistical analysis conducted on geographies consisting of 416,363,893 people shows a weak negative correlation between the proportion of Immigrants from Korea and per capita income in the United States with a correlation coefficient (R) of -0.258 and weighted average of $51,671, a difference of 9.3%.
Per Capita Income Correlation Summary
| Measurement | Alsatian | Immigrants from Korea |
| Minimum | $25,853 | $21,671 |
| Maximum | $66,221 | $101,406 |
| Range | $40,368 | $79,735 |
| Mean | $44,810 | $55,080 |
| Median | $43,610 | $54,636 |
| Interquartile 25% (IQ1) | $34,894 | $42,367 |
| Interquartile 75% (IQ3) | $51,799 | $62,916 |
| Interquartile Range (IQR) | $16,905 | $20,549 |
| Standard Deviation (Sample) | $11,224 | $16,727 |
| Standard Deviation (Population) | $10,998 | $16,596 |
Similar Demographics by Per Capita Income
Demographics Similar to Alsatians by Per Capita Income
In terms of per capita income, the demographic groups most similar to Alsatians are Carpatho Rusyn ($47,248, a difference of 0.080%), Immigrants from Egypt ($47,361, a difference of 0.16%), Albanian ($47,379, a difference of 0.20%), Immigrants from Zimbabwe ($47,394, a difference of 0.23%), and Immigrants from Moldova ($47,489, a difference of 0.43%).
| Demographics | Rating | Rank | Per Capita Income |
| Northern Europeans | 98.9 /100 | #89 | Exceptional $47,698 |
| Italians | 98.8 /100 | #90 | Exceptional $47,574 |
| Macedonians | 98.8 /100 | #91 | Exceptional $47,573 |
| Immigrants | Moldova | 98.7 /100 | #92 | Exceptional $47,489 |
| Immigrants | Zimbabwe | 98.5 /100 | #93 | Exceptional $47,394 |
| Albanians | 98.5 /100 | #94 | Exceptional $47,379 |
| Immigrants | Egypt | 98.5 /100 | #95 | Exceptional $47,361 |
| Alsatians | 98.3 /100 | #96 | Exceptional $47,284 |
| Carpatho Rusyns | 98.2 /100 | #97 | Exceptional $47,248 |
| Immigrants | Pakistan | 97.9 /100 | #98 | Exceptional $47,084 |
| Laotians | 97.8 /100 | #99 | Exceptional $47,041 |
| Immigrants | Lebanon | 97.5 /100 | #100 | Exceptional $46,938 |
| Immigrants | Uzbekistan | 97.5 /100 | #101 | Exceptional $46,929 |
| Immigrants | Western Asia | 97.4 /100 | #102 | Exceptional $46,876 |
| Syrians | 97.2 /100 | #103 | Exceptional $46,837 |
Demographics Similar to Immigrants from Korea by Per Capita Income
In terms of per capita income, the demographic groups most similar to Immigrants from Korea are Cambodian ($51,731, a difference of 0.12%), Immigrants from Czechoslovakia ($51,770, a difference of 0.19%), Estonian ($51,875, a difference of 0.39%), Immigrants from South Africa ($51,465, a difference of 0.40%), and Immigrants from Greece ($51,891, a difference of 0.43%).
| Demographics | Rating | Rank | Per Capita Income |
| Australians | 100.0 /100 | #33 | Exceptional $52,074 |
| Immigrants | Russia | 100.0 /100 | #34 | Exceptional $52,044 |
| Burmese | 100.0 /100 | #35 | Exceptional $52,005 |
| Immigrants | Greece | 100.0 /100 | #36 | Exceptional $51,891 |
| Estonians | 100.0 /100 | #37 | Exceptional $51,875 |
| Immigrants | Czechoslovakia | 100.0 /100 | #38 | Exceptional $51,770 |
| Cambodians | 100.0 /100 | #39 | Exceptional $51,731 |
| Immigrants | Korea | 100.0 /100 | #40 | Exceptional $51,671 |
| Immigrants | South Africa | 100.0 /100 | #41 | Exceptional $51,465 |
| Immigrants | Turkey | 100.0 /100 | #42 | Exceptional $51,368 |
| Immigrants | Lithuania | 100.0 /100 | #43 | Exceptional $51,361 |
| Immigrants | Europe | 100.0 /100 | #44 | Exceptional $50,950 |
| Immigrants | Spain | 100.0 /100 | #45 | Exceptional $50,933 |
| Immigrants | Latvia | 100.0 /100 | #46 | Exceptional $50,914 |
| Bulgarians | 100.0 /100 | #47 | Exceptional $50,906 |