Alsatian vs Cherokee Per Capita Income
COMPARE
Alsatian
Cherokee
Per Capita Income
Per Capita Income Comparison
Alsatians
Cherokee
$47,284
PER CAPITA INCOME
98.3/ 100
METRIC RATING
96th/ 347
METRIC RANK
$37,203
PER CAPITA INCOME
0.1/ 100
METRIC RATING
299th/ 347
METRIC RANK
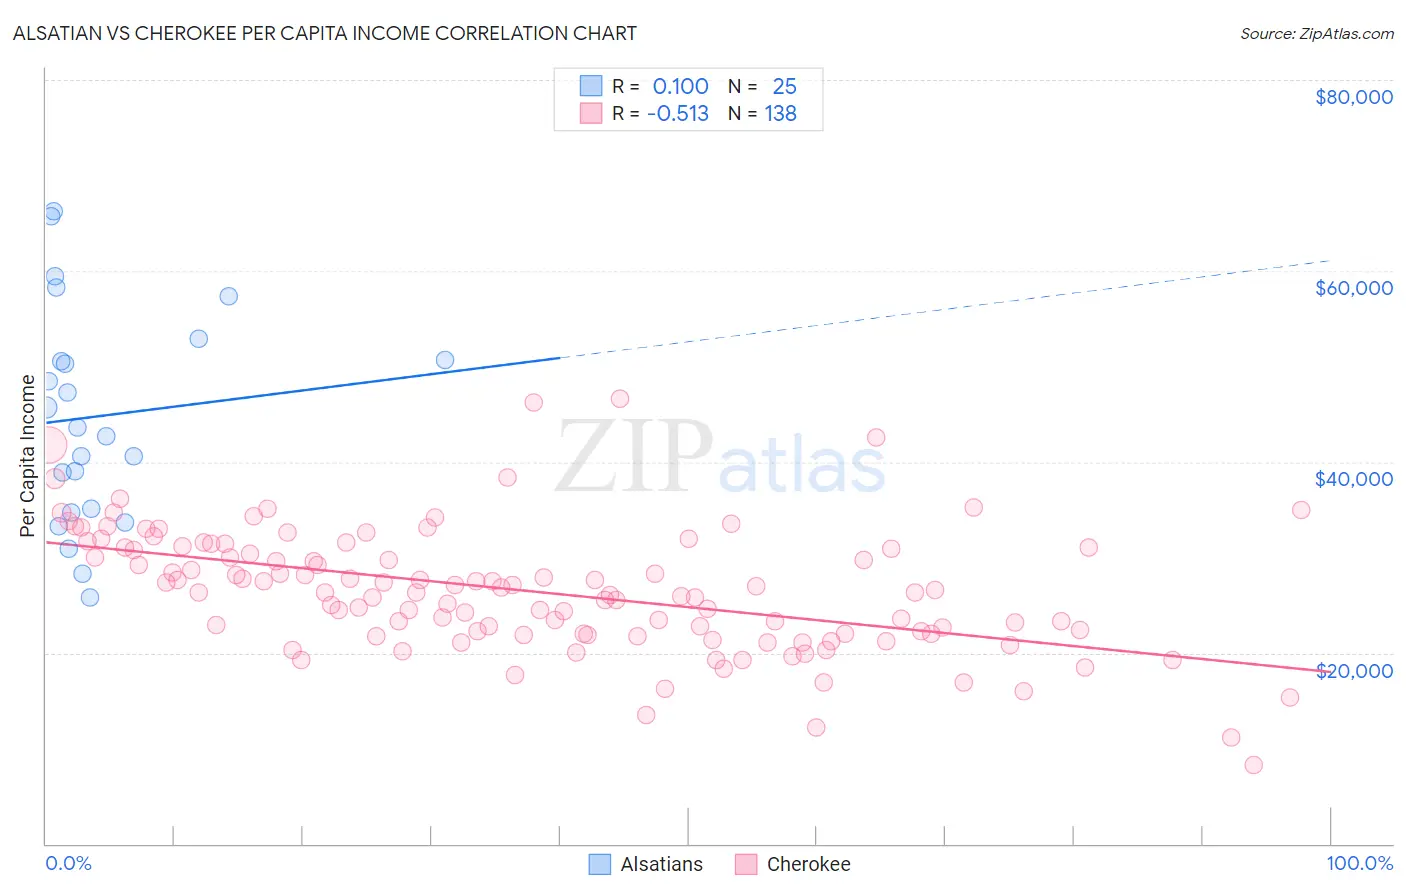
Alsatian vs Cherokee Per Capita Income Correlation Chart
The statistical analysis conducted on geographies consisting of 82,682,365 people shows a slight positive correlation between the proportion of Alsatians and per capita income in the United States with a correlation coefficient (R) of 0.100 and weighted average of $47,284. Similarly, the statistical analysis conducted on geographies consisting of 493,739,592 people shows a substantial negative correlation between the proportion of Cherokee and per capita income in the United States with a correlation coefficient (R) of -0.513 and weighted average of $37,203, a difference of 27.1%.
Per Capita Income Correlation Summary
| Measurement | Alsatian | Cherokee |
| Minimum | $25,853 | $8,186 |
| Maximum | $66,221 | $46,594 |
| Range | $40,368 | $38,408 |
| Mean | $44,810 | $26,478 |
| Median | $43,610 | $26,343 |
| Interquartile 25% (IQ1) | $34,894 | $21,995 |
| Interquartile 75% (IQ3) | $51,799 | $30,981 |
| Interquartile Range (IQR) | $16,905 | $8,986 |
| Standard Deviation (Sample) | $11,224 | $6,463 |
| Standard Deviation (Population) | $10,998 | $6,439 |
Similar Demographics by Per Capita Income
Demographics Similar to Alsatians by Per Capita Income
In terms of per capita income, the demographic groups most similar to Alsatians are Carpatho Rusyn ($47,248, a difference of 0.080%), Immigrants from Egypt ($47,361, a difference of 0.16%), Albanian ($47,379, a difference of 0.20%), Immigrants from Zimbabwe ($47,394, a difference of 0.23%), and Immigrants from Moldova ($47,489, a difference of 0.43%).
| Demographics | Rating | Rank | Per Capita Income |
| Northern Europeans | 98.9 /100 | #89 | Exceptional $47,698 |
| Italians | 98.8 /100 | #90 | Exceptional $47,574 |
| Macedonians | 98.8 /100 | #91 | Exceptional $47,573 |
| Immigrants | Moldova | 98.7 /100 | #92 | Exceptional $47,489 |
| Immigrants | Zimbabwe | 98.5 /100 | #93 | Exceptional $47,394 |
| Albanians | 98.5 /100 | #94 | Exceptional $47,379 |
| Immigrants | Egypt | 98.5 /100 | #95 | Exceptional $47,361 |
| Alsatians | 98.3 /100 | #96 | Exceptional $47,284 |
| Carpatho Rusyns | 98.2 /100 | #97 | Exceptional $47,248 |
| Immigrants | Pakistan | 97.9 /100 | #98 | Exceptional $47,084 |
| Laotians | 97.8 /100 | #99 | Exceptional $47,041 |
| Immigrants | Lebanon | 97.5 /100 | #100 | Exceptional $46,938 |
| Immigrants | Uzbekistan | 97.5 /100 | #101 | Exceptional $46,929 |
| Immigrants | Western Asia | 97.4 /100 | #102 | Exceptional $46,876 |
| Syrians | 97.2 /100 | #103 | Exceptional $46,837 |
Demographics Similar to Cherokee by Per Capita Income
In terms of per capita income, the demographic groups most similar to Cherokee are Immigrants from Bahamas ($37,193, a difference of 0.030%), Immigrants from Caribbean ($37,254, a difference of 0.14%), Haitian ($37,289, a difference of 0.23%), Indonesian ($37,300, a difference of 0.26%), and Immigrants from Dominican Republic ($37,306, a difference of 0.27%).
| Demographics | Rating | Rank | Per Capita Income |
| Immigrants | Micronesia | 0.1 /100 | #292 | Tragic $37,464 |
| Mexican American Indians | 0.1 /100 | #293 | Tragic $37,407 |
| Cubans | 0.1 /100 | #294 | Tragic $37,383 |
| Immigrants | Dominican Republic | 0.1 /100 | #295 | Tragic $37,306 |
| Indonesians | 0.1 /100 | #296 | Tragic $37,300 |
| Haitians | 0.1 /100 | #297 | Tragic $37,289 |
| Immigrants | Caribbean | 0.1 /100 | #298 | Tragic $37,254 |
| Cherokee | 0.1 /100 | #299 | Tragic $37,203 |
| Immigrants | Bahamas | 0.1 /100 | #300 | Tragic $37,193 |
| Ottawa | 0.1 /100 | #301 | Tragic $37,101 |
| Shoshone | 0.1 /100 | #302 | Tragic $37,072 |
| Paiute | 0.1 /100 | #303 | Tragic $37,066 |
| Hondurans | 0.1 /100 | #304 | Tragic $37,031 |
| Inupiat | 0.1 /100 | #305 | Tragic $36,999 |
| Immigrants | Haiti | 0.0 /100 | #306 | Tragic $36,849 |