Alsatian vs Immigrants from England Per Capita Income
COMPARE
Alsatian
Immigrants from England
Per Capita Income
Per Capita Income Comparison
Alsatians
Immigrants from England
$47,284
PER CAPITA INCOME
98.3/ 100
METRIC RATING
96th/ 347
METRIC RANK
$48,844
PER CAPITA INCOME
99.7/ 100
METRIC RATING
76th/ 347
METRIC RANK
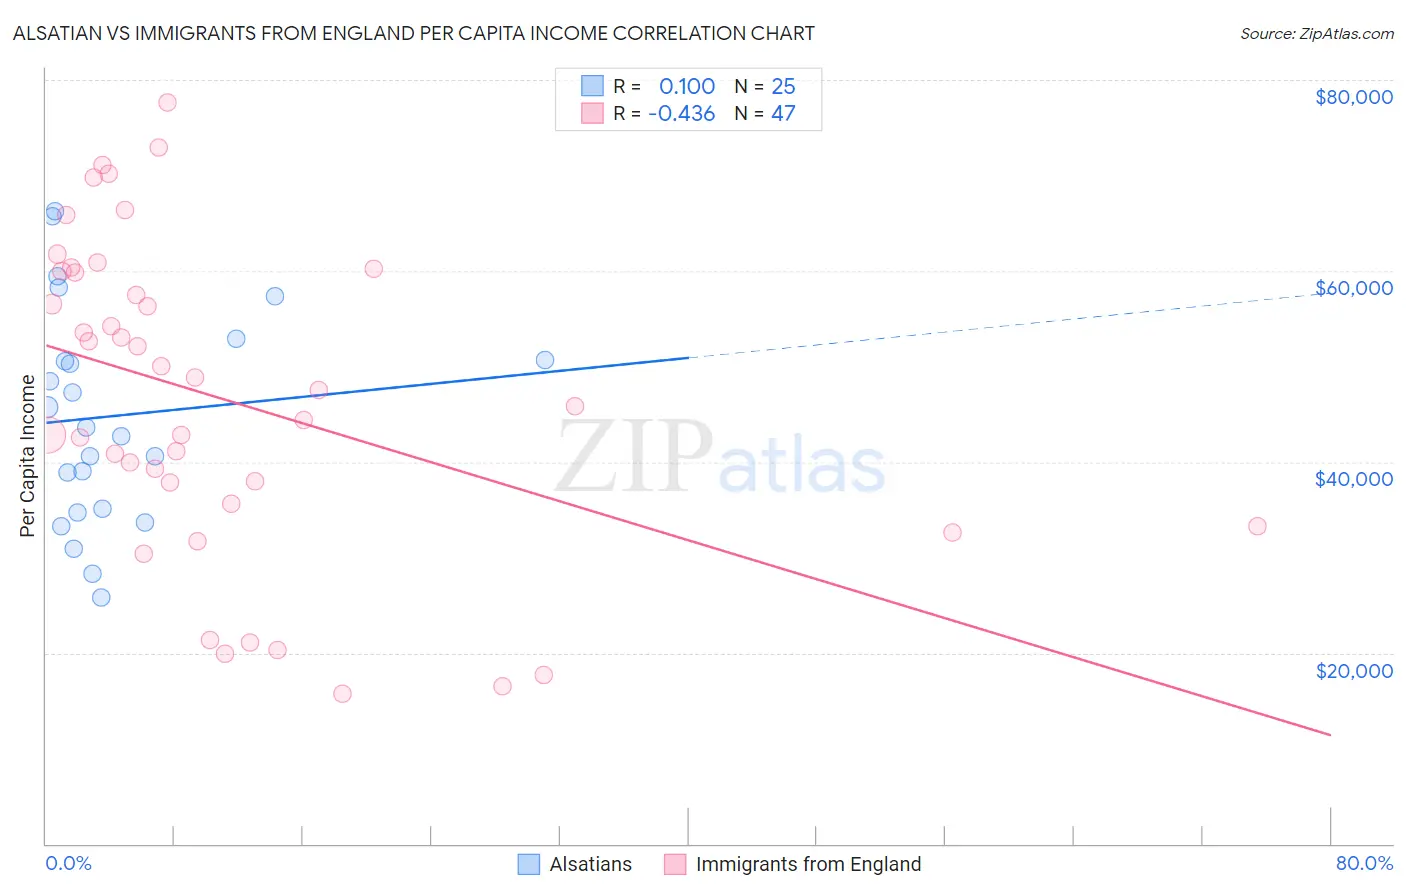
Alsatian vs Immigrants from England Per Capita Income Correlation Chart
The statistical analysis conducted on geographies consisting of 82,682,365 people shows a slight positive correlation between the proportion of Alsatians and per capita income in the United States with a correlation coefficient (R) of 0.100 and weighted average of $47,284. Similarly, the statistical analysis conducted on geographies consisting of 391,908,238 people shows a moderate negative correlation between the proportion of Immigrants from England and per capita income in the United States with a correlation coefficient (R) of -0.436 and weighted average of $48,844, a difference of 3.3%.
Per Capita Income Correlation Summary
| Measurement | Alsatian | Immigrants from England |
| Minimum | $25,853 | $15,716 |
| Maximum | $66,221 | $77,696 |
| Range | $40,368 | $61,980 |
| Mean | $44,810 | $46,607 |
| Median | $43,610 | $47,511 |
| Interquartile 25% (IQ1) | $34,894 | $35,676 |
| Interquartile 75% (IQ3) | $51,799 | $59,917 |
| Interquartile Range (IQR) | $16,905 | $24,241 |
| Standard Deviation (Sample) | $11,224 | $16,522 |
| Standard Deviation (Population) | $10,998 | $16,346 |
Demographics Similar to Alsatians and Immigrants from England by Per Capita Income
In terms of per capita income, the demographic groups most similar to Alsatians are Immigrants from Egypt ($47,361, a difference of 0.16%), Albanian ($47,379, a difference of 0.20%), Immigrants from Zimbabwe ($47,394, a difference of 0.23%), Immigrants from Moldova ($47,489, a difference of 0.43%), and Italian ($47,574, a difference of 0.61%). Similarly, the demographic groups most similar to Immigrants from England are Immigrants from Kazakhstan ($48,747, a difference of 0.20%), Immigrants from Italy ($48,654, a difference of 0.39%), Romanian ($48,445, a difference of 0.82%), Egyptian ($48,358, a difference of 1.0%), and Armenian ($48,287, a difference of 1.1%).
| Demographics | Rating | Rank | Per Capita Income |
| Immigrants | England | 99.7 /100 | #76 | Exceptional $48,844 |
| Immigrants | Kazakhstan | 99.7 /100 | #77 | Exceptional $48,747 |
| Immigrants | Italy | 99.6 /100 | #78 | Exceptional $48,654 |
| Romanians | 99.5 /100 | #79 | Exceptional $48,445 |
| Egyptians | 99.5 /100 | #80 | Exceptional $48,358 |
| Armenians | 99.4 /100 | #81 | Exceptional $48,287 |
| Immigrants | Indonesia | 99.4 /100 | #82 | Exceptional $48,195 |
| Immigrants | Brazil | 99.4 /100 | #83 | Exceptional $48,164 |
| Immigrants | Ukraine | 99.3 /100 | #84 | Exceptional $48,134 |
| Austrians | 99.3 /100 | #85 | Exceptional $48,116 |
| Immigrants | Southern Europe | 99.3 /100 | #86 | Exceptional $48,027 |
| Ukrainians | 99.3 /100 | #87 | Exceptional $48,014 |
| Croatians | 99.0 /100 | #88 | Exceptional $47,742 |
| Northern Europeans | 98.9 /100 | #89 | Exceptional $47,698 |
| Italians | 98.8 /100 | #90 | Exceptional $47,574 |
| Macedonians | 98.8 /100 | #91 | Exceptional $47,573 |
| Immigrants | Moldova | 98.7 /100 | #92 | Exceptional $47,489 |
| Immigrants | Zimbabwe | 98.5 /100 | #93 | Exceptional $47,394 |
| Albanians | 98.5 /100 | #94 | Exceptional $47,379 |
| Immigrants | Egypt | 98.5 /100 | #95 | Exceptional $47,361 |
| Alsatians | 98.3 /100 | #96 | Exceptional $47,284 |