Alsatian vs Choctaw Per Capita Income
COMPARE
Alsatian
Choctaw
Per Capita Income
Per Capita Income Comparison
Alsatians
Choctaw
$47,284
PER CAPITA INCOME
98.3/ 100
METRIC RATING
96th/ 347
METRIC RANK
$35,999
PER CAPITA INCOME
0.0/ 100
METRIC RATING
316th/ 347
METRIC RANK
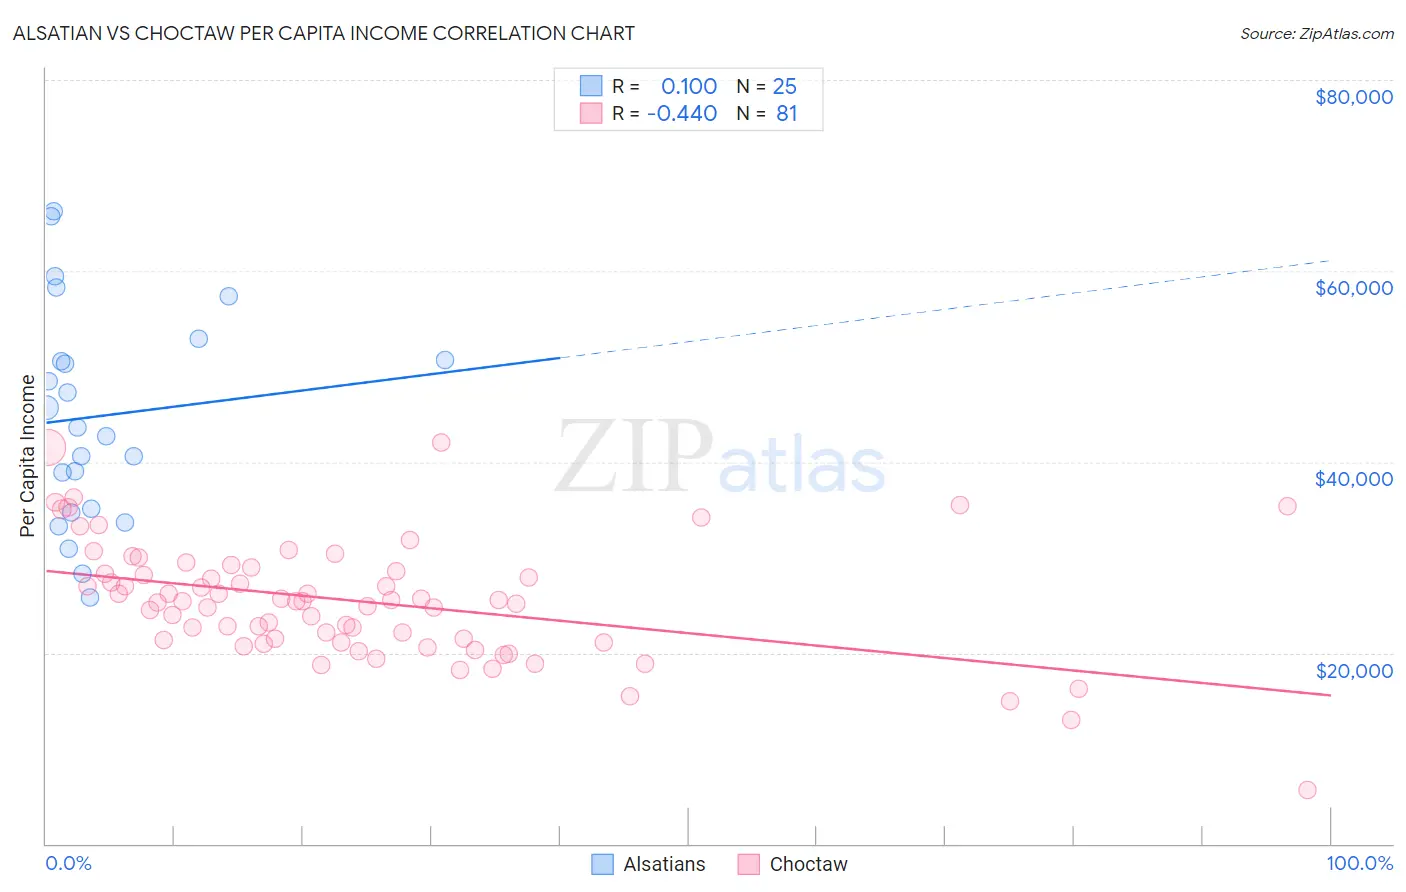
Alsatian vs Choctaw Per Capita Income Correlation Chart
The statistical analysis conducted on geographies consisting of 82,682,365 people shows a slight positive correlation between the proportion of Alsatians and per capita income in the United States with a correlation coefficient (R) of 0.100 and weighted average of $47,284. Similarly, the statistical analysis conducted on geographies consisting of 269,743,960 people shows a moderate negative correlation between the proportion of Choctaw and per capita income in the United States with a correlation coefficient (R) of -0.440 and weighted average of $35,999, a difference of 31.4%.
Per Capita Income Correlation Summary
| Measurement | Alsatian | Choctaw |
| Minimum | $25,853 | $5,606 |
| Maximum | $66,221 | $42,046 |
| Range | $40,368 | $36,440 |
| Mean | $44,810 | $25,429 |
| Median | $43,610 | $25,402 |
| Interquartile 25% (IQ1) | $34,894 | $21,238 |
| Interquartile 75% (IQ3) | $51,799 | $28,737 |
| Interquartile Range (IQR) | $16,905 | $7,499 |
| Standard Deviation (Sample) | $11,224 | $6,184 |
| Standard Deviation (Population) | $10,998 | $6,145 |
Similar Demographics by Per Capita Income
Demographics Similar to Alsatians by Per Capita Income
In terms of per capita income, the demographic groups most similar to Alsatians are Carpatho Rusyn ($47,248, a difference of 0.080%), Immigrants from Egypt ($47,361, a difference of 0.16%), Albanian ($47,379, a difference of 0.20%), Immigrants from Zimbabwe ($47,394, a difference of 0.23%), and Immigrants from Moldova ($47,489, a difference of 0.43%).
| Demographics | Rating | Rank | Per Capita Income |
| Northern Europeans | 98.9 /100 | #89 | Exceptional $47,698 |
| Italians | 98.8 /100 | #90 | Exceptional $47,574 |
| Macedonians | 98.8 /100 | #91 | Exceptional $47,573 |
| Immigrants | Moldova | 98.7 /100 | #92 | Exceptional $47,489 |
| Immigrants | Zimbabwe | 98.5 /100 | #93 | Exceptional $47,394 |
| Albanians | 98.5 /100 | #94 | Exceptional $47,379 |
| Immigrants | Egypt | 98.5 /100 | #95 | Exceptional $47,361 |
| Alsatians | 98.3 /100 | #96 | Exceptional $47,284 |
| Carpatho Rusyns | 98.2 /100 | #97 | Exceptional $47,248 |
| Immigrants | Pakistan | 97.9 /100 | #98 | Exceptional $47,084 |
| Laotians | 97.8 /100 | #99 | Exceptional $47,041 |
| Immigrants | Lebanon | 97.5 /100 | #100 | Exceptional $46,938 |
| Immigrants | Uzbekistan | 97.5 /100 | #101 | Exceptional $46,929 |
| Immigrants | Western Asia | 97.4 /100 | #102 | Exceptional $46,876 |
| Syrians | 97.2 /100 | #103 | Exceptional $46,837 |
Demographics Similar to Choctaw by Per Capita Income
In terms of per capita income, the demographic groups most similar to Choctaw are Dutch West Indian ($35,922, a difference of 0.21%), Bangladeshi ($35,897, a difference of 0.28%), Yaqui ($36,112, a difference of 0.31%), Seminole ($36,180, a difference of 0.50%), and Immigrants from Congo ($35,720, a difference of 0.78%).
| Demographics | Rating | Rank | Per Capita Income |
| Immigrants | Honduras | 0.0 /100 | #309 | Tragic $36,665 |
| Ute | 0.0 /100 | #310 | Tragic $36,651 |
| Chippewa | 0.0 /100 | #311 | Tragic $36,631 |
| Chickasaw | 0.0 /100 | #312 | Tragic $36,475 |
| Bahamians | 0.0 /100 | #313 | Tragic $36,427 |
| Seminole | 0.0 /100 | #314 | Tragic $36,180 |
| Yaqui | 0.0 /100 | #315 | Tragic $36,112 |
| Choctaw | 0.0 /100 | #316 | Tragic $35,999 |
| Dutch West Indians | 0.0 /100 | #317 | Tragic $35,922 |
| Bangladeshis | 0.0 /100 | #318 | Tragic $35,897 |
| Immigrants | Congo | 0.0 /100 | #319 | Tragic $35,720 |
| Hispanics or Latinos | 0.0 /100 | #320 | Tragic $35,688 |
| Blacks/African Americans | 0.0 /100 | #321 | Tragic $35,564 |
| Creek | 0.0 /100 | #322 | Tragic $35,546 |
| Cheyenne | 0.0 /100 | #323 | Tragic $35,276 |