Alsatian vs Immigrants from Grenada Per Capita Income
COMPARE
Alsatian
Immigrants from Grenada
Per Capita Income
Per Capita Income Comparison
Alsatians
Immigrants from Grenada
$47,284
PER CAPITA INCOME
98.3/ 100
METRIC RATING
96th/ 347
METRIC RANK
$41,123
PER CAPITA INCOME
5.5/ 100
METRIC RATING
228th/ 347
METRIC RANK
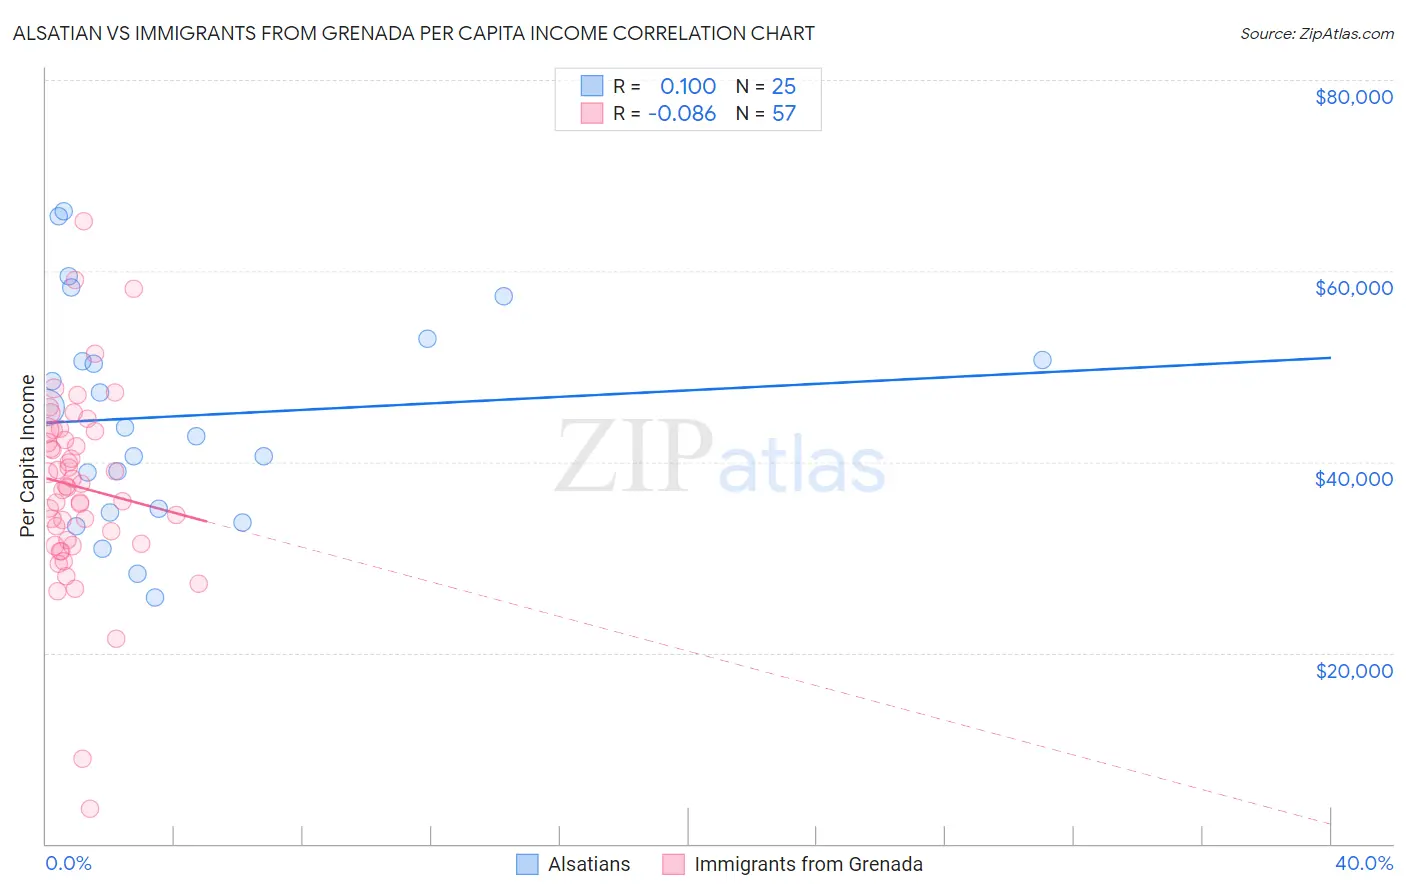
Alsatian vs Immigrants from Grenada Per Capita Income Correlation Chart
The statistical analysis conducted on geographies consisting of 82,682,365 people shows a slight positive correlation between the proportion of Alsatians and per capita income in the United States with a correlation coefficient (R) of 0.100 and weighted average of $47,284. Similarly, the statistical analysis conducted on geographies consisting of 67,200,351 people shows a slight negative correlation between the proportion of Immigrants from Grenada and per capita income in the United States with a correlation coefficient (R) of -0.086 and weighted average of $41,123, a difference of 15.0%.
Per Capita Income Correlation Summary
| Measurement | Alsatian | Immigrants from Grenada |
| Minimum | $25,853 | $3,645 |
| Maximum | $66,221 | $65,209 |
| Range | $40,368 | $61,564 |
| Mean | $44,810 | $37,400 |
| Median | $43,610 | $37,479 |
| Interquartile 25% (IQ1) | $34,894 | $31,664 |
| Interquartile 75% (IQ3) | $51,799 | $43,240 |
| Interquartile Range (IQR) | $16,905 | $11,576 |
| Standard Deviation (Sample) | $11,224 | $10,138 |
| Standard Deviation (Population) | $10,998 | $10,049 |
Similar Demographics by Per Capita Income
Demographics Similar to Alsatians by Per Capita Income
In terms of per capita income, the demographic groups most similar to Alsatians are Carpatho Rusyn ($47,248, a difference of 0.080%), Immigrants from Egypt ($47,361, a difference of 0.16%), Albanian ($47,379, a difference of 0.20%), Immigrants from Zimbabwe ($47,394, a difference of 0.23%), and Immigrants from Moldova ($47,489, a difference of 0.43%).
| Demographics | Rating | Rank | Per Capita Income |
| Northern Europeans | 98.9 /100 | #89 | Exceptional $47,698 |
| Italians | 98.8 /100 | #90 | Exceptional $47,574 |
| Macedonians | 98.8 /100 | #91 | Exceptional $47,573 |
| Immigrants | Moldova | 98.7 /100 | #92 | Exceptional $47,489 |
| Immigrants | Zimbabwe | 98.5 /100 | #93 | Exceptional $47,394 |
| Albanians | 98.5 /100 | #94 | Exceptional $47,379 |
| Immigrants | Egypt | 98.5 /100 | #95 | Exceptional $47,361 |
| Alsatians | 98.3 /100 | #96 | Exceptional $47,284 |
| Carpatho Rusyns | 98.2 /100 | #97 | Exceptional $47,248 |
| Immigrants | Pakistan | 97.9 /100 | #98 | Exceptional $47,084 |
| Laotians | 97.8 /100 | #99 | Exceptional $47,041 |
| Immigrants | Lebanon | 97.5 /100 | #100 | Exceptional $46,938 |
| Immigrants | Uzbekistan | 97.5 /100 | #101 | Exceptional $46,929 |
| Immigrants | Western Asia | 97.4 /100 | #102 | Exceptional $46,876 |
| Syrians | 97.2 /100 | #103 | Exceptional $46,837 |
Demographics Similar to Immigrants from Grenada by Per Capita Income
In terms of per capita income, the demographic groups most similar to Immigrants from Grenada are Immigrants from Ghana ($41,131, a difference of 0.020%), Immigrants from Ecuador ($41,195, a difference of 0.17%), West Indian ($41,217, a difference of 0.23%), Nigerian ($41,026, a difference of 0.24%), and Native Hawaiian ($41,017, a difference of 0.26%).
| Demographics | Rating | Rank | Per Capita Income |
| Immigrants | Trinidad and Tobago | 7.9 /100 | #221 | Tragic $41,476 |
| Immigrants | Iraq | 7.1 /100 | #222 | Tragic $41,365 |
| Immigrants | Cameroon | 6.8 /100 | #223 | Tragic $41,334 |
| Immigrants | St. Vincent and the Grenadines | 6.4 /100 | #224 | Tragic $41,270 |
| West Indians | 6.0 /100 | #225 | Tragic $41,217 |
| Immigrants | Ecuador | 5.9 /100 | #226 | Tragic $41,195 |
| Immigrants | Ghana | 5.5 /100 | #227 | Tragic $41,131 |
| Immigrants | Grenada | 5.5 /100 | #228 | Tragic $41,123 |
| Nigerians | 4.9 /100 | #229 | Tragic $41,026 |
| Native Hawaiians | 4.9 /100 | #230 | Tragic $41,017 |
| Senegalese | 4.8 /100 | #231 | Tragic $41,000 |
| Guyanese | 4.5 /100 | #232 | Tragic $40,949 |
| Delaware | 3.8 /100 | #233 | Tragic $40,778 |
| Immigrants | West Indies | 3.7 /100 | #234 | Tragic $40,763 |
| Immigrants | Guyana | 3.6 /100 | #235 | Tragic $40,742 |