Alsatian vs Immigrants from Zaire Female Poverty Among 18-24 Year Olds
COMPARE
Alsatian
Immigrants from Zaire
Female Poverty Among 18-24 Year Olds
Female Poverty Among 18-24 Year Olds Comparison
Alsatians
Immigrants from Zaire
24.4%
FEMALE POVERTY AMONG 18-24 YEAR OLDS
0.0/ 100
METRIC RATING
316th/ 347
METRIC RANK
25.1%
FEMALE POVERTY AMONG 18-24 YEAR OLDS
0.0/ 100
METRIC RATING
321st/ 347
METRIC RANK
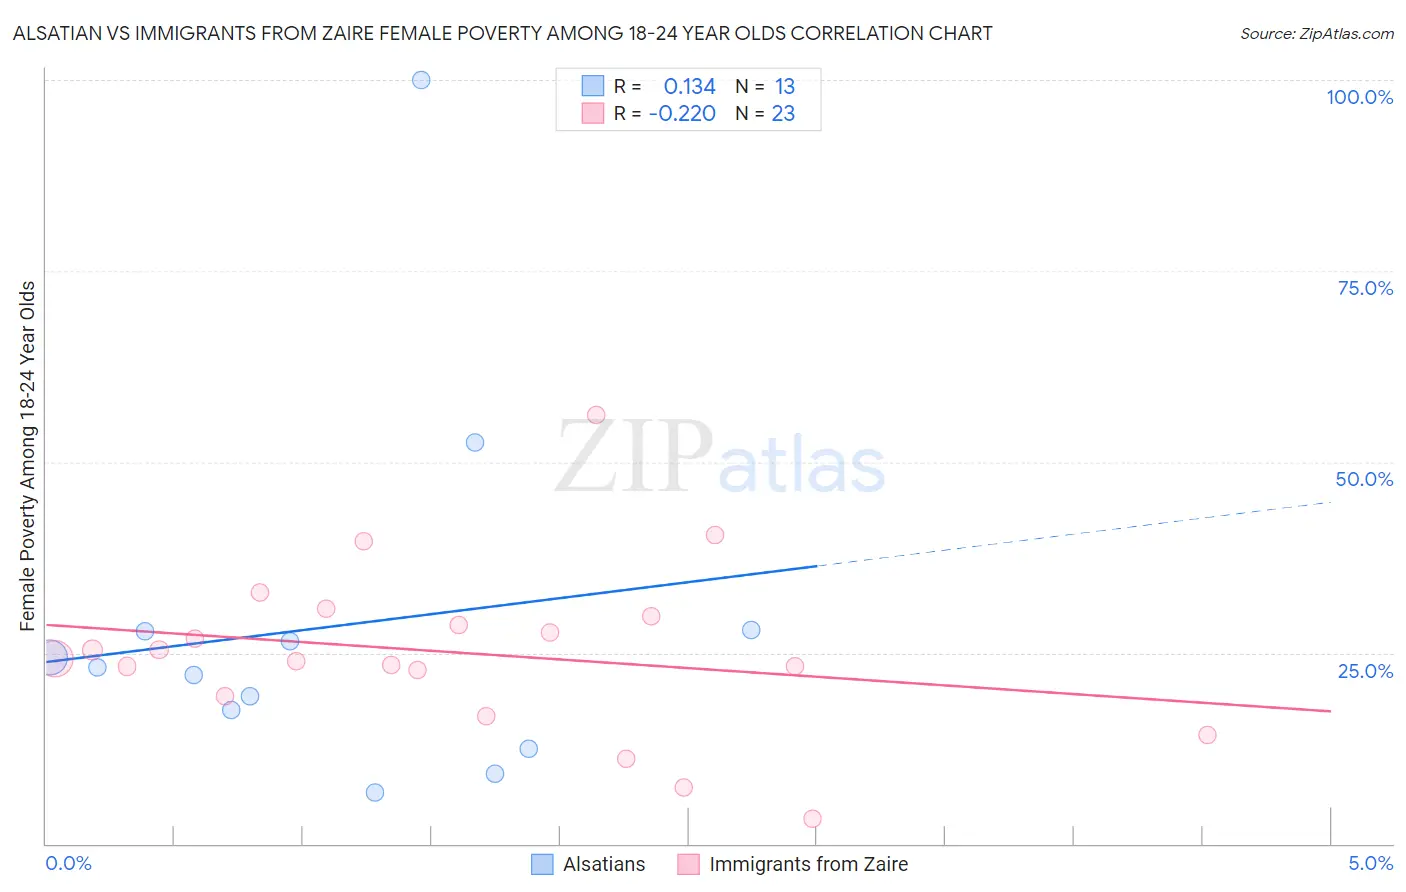
Alsatian vs Immigrants from Zaire Female Poverty Among 18-24 Year Olds Correlation Chart
The statistical analysis conducted on geographies consisting of 81,760,861 people shows a poor positive correlation between the proportion of Alsatians and poverty level among females between the ages 18 and 24 in the United States with a correlation coefficient (R) of 0.134 and weighted average of 24.4%. Similarly, the statistical analysis conducted on geographies consisting of 106,901,592 people shows a weak negative correlation between the proportion of Immigrants from Zaire and poverty level among females between the ages 18 and 24 in the United States with a correlation coefficient (R) of -0.220 and weighted average of 25.1%, a difference of 2.8%.
Female Poverty Among 18-24 Year Olds Correlation Summary
| Measurement | Alsatian | Immigrants from Zaire |
| Minimum | 6.7% | 3.2% |
| Maximum | 100.0% | 56.1% |
| Range | 93.3% | 52.9% |
| Mean | 28.4% | 25.1% |
| Median | 23.1% | 24.1% |
| Interquartile 25% (IQ1) | 15.0% | 19.2% |
| Interquartile 75% (IQ3) | 27.9% | 29.7% |
| Interquartile Range (IQR) | 12.9% | 10.5% |
| Standard Deviation (Sample) | 24.3% | 11.2% |
| Standard Deviation (Population) | 23.3% | 11.0% |
Demographics Similar to Alsatians and Immigrants from Zaire by Female Poverty Among 18-24 Year Olds
In terms of female poverty among 18-24 year olds, the demographic groups most similar to Alsatians are Osage (24.5%, a difference of 0.29%), Black/African American (24.3%, a difference of 0.31%), Chickasaw (24.5%, a difference of 0.38%), Dutch West Indian (24.5%, a difference of 0.48%), and Choctaw (24.3%, a difference of 0.51%). Similarly, the demographic groups most similar to Immigrants from Zaire are Somali (25.1%, a difference of 0.30%), Arapaho (25.2%, a difference of 0.37%), German Russian (25.2%, a difference of 0.40%), Immigrants from Saudi Arabia (25.3%, a difference of 0.83%), and Yakama (25.3%, a difference of 1.1%).
| Demographics | Rating | Rank | Female Poverty Among 18-24 Year Olds |
| Immigrants | Sudan | 0.0 /100 | #308 | Tragic 23.5% |
| Blackfeet | 0.0 /100 | #309 | Tragic 23.6% |
| Comanche | 0.0 /100 | #310 | Tragic 23.6% |
| Potawatomi | 0.0 /100 | #311 | Tragic 23.7% |
| Yuman | 0.0 /100 | #312 | Tragic 24.0% |
| Creek | 0.0 /100 | #313 | Tragic 24.2% |
| Choctaw | 0.0 /100 | #314 | Tragic 24.3% |
| Blacks/African Americans | 0.0 /100 | #315 | Tragic 24.3% |
| Alsatians | 0.0 /100 | #316 | Tragic 24.4% |
| Osage | 0.0 /100 | #317 | Tragic 24.5% |
| Chickasaw | 0.0 /100 | #318 | Tragic 24.5% |
| Dutch West Indians | 0.0 /100 | #319 | Tragic 24.5% |
| Immigrants | Congo | 0.0 /100 | #320 | Tragic 24.6% |
| Immigrants | Zaire | 0.0 /100 | #321 | Tragic 25.1% |
| Somalis | 0.0 /100 | #322 | Tragic 25.1% |
| Arapaho | 0.0 /100 | #323 | Tragic 25.2% |
| German Russians | 0.0 /100 | #324 | Tragic 25.2% |
| Immigrants | Saudi Arabia | 0.0 /100 | #325 | Tragic 25.3% |
| Yakama | 0.0 /100 | #326 | Tragic 25.3% |
| Ute | 0.0 /100 | #327 | Tragic 25.4% |
| Natives/Alaskans | 0.0 /100 | #328 | Tragic 25.4% |