Alsatian vs Alaskan Athabascan Per Capita Income
COMPARE
Alsatian
Alaskan Athabascan
Per Capita Income
Per Capita Income Comparison
Alsatians
Alaskan Athabascans
$47,284
PER CAPITA INCOME
98.3/ 100
METRIC RATING
96th/ 347
METRIC RANK
$39,163
PER CAPITA INCOME
0.6/ 100
METRIC RATING
260th/ 347
METRIC RANK
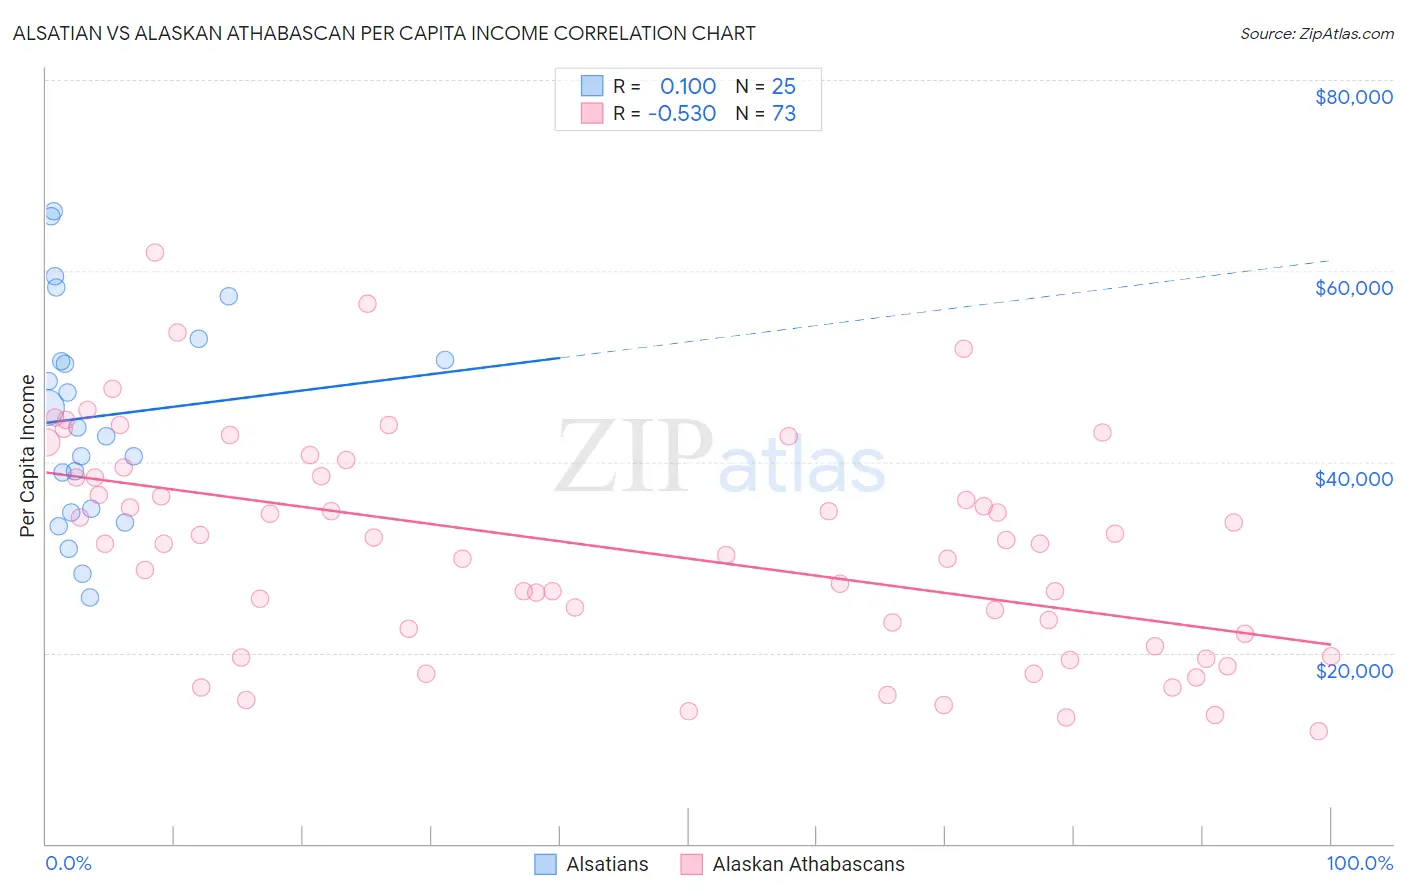
Alsatian vs Alaskan Athabascan Per Capita Income Correlation Chart
The statistical analysis conducted on geographies consisting of 82,682,365 people shows a slight positive correlation between the proportion of Alsatians and per capita income in the United States with a correlation coefficient (R) of 0.100 and weighted average of $47,284. Similarly, the statistical analysis conducted on geographies consisting of 45,821,401 people shows a substantial negative correlation between the proportion of Alaskan Athabascans and per capita income in the United States with a correlation coefficient (R) of -0.530 and weighted average of $39,163, a difference of 20.7%.
Per Capita Income Correlation Summary
| Measurement | Alsatian | Alaskan Athabascan |
| Minimum | $25,853 | $11,811 |
| Maximum | $66,221 | $61,991 |
| Range | $40,368 | $50,180 |
| Mean | $44,810 | $31,098 |
| Median | $43,610 | $31,460 |
| Interquartile 25% (IQ1) | $34,894 | $21,337 |
| Interquartile 75% (IQ3) | $51,799 | $38,931 |
| Interquartile Range (IQR) | $16,905 | $17,594 |
| Standard Deviation (Sample) | $11,224 | $11,398 |
| Standard Deviation (Population) | $10,998 | $11,320 |
Similar Demographics by Per Capita Income
Demographics Similar to Alsatians by Per Capita Income
In terms of per capita income, the demographic groups most similar to Alsatians are Carpatho Rusyn ($47,248, a difference of 0.080%), Immigrants from Egypt ($47,361, a difference of 0.16%), Albanian ($47,379, a difference of 0.20%), Immigrants from Zimbabwe ($47,394, a difference of 0.23%), and Immigrants from Moldova ($47,489, a difference of 0.43%).
| Demographics | Rating | Rank | Per Capita Income |
| Northern Europeans | 98.9 /100 | #89 | Exceptional $47,698 |
| Italians | 98.8 /100 | #90 | Exceptional $47,574 |
| Macedonians | 98.8 /100 | #91 | Exceptional $47,573 |
| Immigrants | Moldova | 98.7 /100 | #92 | Exceptional $47,489 |
| Immigrants | Zimbabwe | 98.5 /100 | #93 | Exceptional $47,394 |
| Albanians | 98.5 /100 | #94 | Exceptional $47,379 |
| Immigrants | Egypt | 98.5 /100 | #95 | Exceptional $47,361 |
| Alsatians | 98.3 /100 | #96 | Exceptional $47,284 |
| Carpatho Rusyns | 98.2 /100 | #97 | Exceptional $47,248 |
| Immigrants | Pakistan | 97.9 /100 | #98 | Exceptional $47,084 |
| Laotians | 97.8 /100 | #99 | Exceptional $47,041 |
| Immigrants | Lebanon | 97.5 /100 | #100 | Exceptional $46,938 |
| Immigrants | Uzbekistan | 97.5 /100 | #101 | Exceptional $46,929 |
| Immigrants | Western Asia | 97.4 /100 | #102 | Exceptional $46,876 |
| Syrians | 97.2 /100 | #103 | Exceptional $46,837 |
Demographics Similar to Alaskan Athabascans by Per Capita Income
In terms of per capita income, the demographic groups most similar to Alaskan Athabascans are Malaysian ($39,194, a difference of 0.080%), Marshallese ($39,108, a difference of 0.14%), Iroquois ($39,104, a difference of 0.15%), Jamaican ($39,231, a difference of 0.17%), and Belizean ($39,097, a difference of 0.17%).
| Demographics | Rating | Rank | Per Capita Income |
| Osage | 1.0 /100 | #253 | Tragic $39,568 |
| Alaska Natives | 1.0 /100 | #254 | Tragic $39,558 |
| Immigrants | Middle Africa | 1.0 /100 | #255 | Tragic $39,529 |
| Hawaiians | 0.8 /100 | #256 | Tragic $39,403 |
| Nicaraguans | 0.8 /100 | #257 | Tragic $39,372 |
| Jamaicans | 0.7 /100 | #258 | Tragic $39,231 |
| Malaysians | 0.7 /100 | #259 | Tragic $39,194 |
| Alaskan Athabascans | 0.6 /100 | #260 | Tragic $39,163 |
| Marshallese | 0.6 /100 | #261 | Tragic $39,108 |
| Iroquois | 0.6 /100 | #262 | Tragic $39,104 |
| Belizeans | 0.6 /100 | #263 | Tragic $39,097 |
| Americans | 0.6 /100 | #264 | Tragic $39,039 |
| Spanish Americans | 0.5 /100 | #265 | Tragic $39,012 |
| Salvadorans | 0.5 /100 | #266 | Tragic $38,858 |
| Immigrants | Zaire | 0.4 /100 | #267 | Tragic $38,848 |